data representation and interpretation
1/13
There's no tags or description
Looks like no tags are added yet.
Name | Mastery | Learn | Test | Matching | Spaced |
|---|
No study sessions yet.
14 Terms
What is discrete data?
Data that can only take certain values ( e.g - number of goals in a football match)
What is continuous data?
Data that can take any value ( e.g - height, time)
What is quantitative data?
Data which is descriptive ( e.g - eye colour, subjects)
What are the key components to a bar chart?
Should have gaps
Often represent proportions
What are key components to a pie chart?
Often represent proportions ( cannot make comments until we know the total frequency)
What are the key components of a histogram?
Used for continuous data
Area is proportional to the frequency
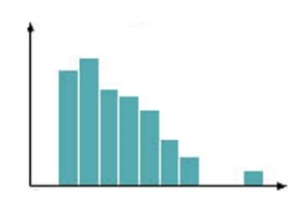
What does this histogram represent?
Positive skew
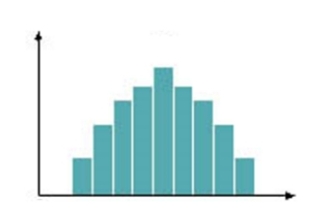
What does this histogram represent?
Symmetric distribution
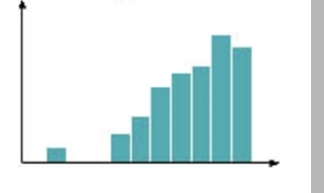
What does this histogram represent?
Negative skew
What are the key components to a cumulative frequency graph?
Used for grouped data and is plotted at the end of each group
Used for estimates, such as median, quartiles, percentiles
What are the key components to box plots?
Good for direct comparisons between two sets of data, as they show the median and IQR
Can determine skew
What does this box plot represent?
Positive skew
What does this box plot represent?
Symmetric distribution
What does this box plot represent?
Negative skew