GEO21014 Glacial Processes and Hazards
1/170
There's no tags or description
Looks like no tags are added yet.
Name | Mastery | Learn | Test | Matching | Spaced |
|---|
No study sessions yet.
171 Terms
what is a glacier?
Any large mass of perennial ice that originates on land by the recrystallization of snow or other forms of solid precipitation and that shows evidence of past or present flow ― Meier
A mass of temperate ice will start to exhibit flow when the vertical thickness of the ice body reaches c. 30 m
what is glaciology?
the study of glaciers of all types
the processes of ice formation and flow
glacial hazards
Hazards over a large temporal and spatial scale
E.g avalanches, outburst floods, sea level rise
Also a legacy of landscape changes pose hazards including moraine formation and steep valley walls
hazard assessment and mitigation
Model and research key processes
Think of different ways to reduce and mitigate impacts
sea level change past and present
Since last glacial maximum sea level has risen 120 metres
More recently more stable in holocene
But upticked now in last 20-30 years
Greatest component is ocean warming - thermal expansion
Greenland is main contributor - more recently become more dominant
Increasing in future due to warming - contributions may change
glacial formation and function
Glaciers transfer precipitation that has collected to form glacier ice
Compaction and build up of snow - if it doesn't melt in summer - the weight of snow densifies - loses air spaces - slowly transforms into ice - water also percolates into the gaps and refreezes
Snow → firn → glacial ice
glacier locations
Typically in polar regions but also can occur up to equator - because of altitude
High altitude or high latitude
types of glacier
Mountain glaciers
Typically land terminating
Smaller and thinner
Shorter residence times - 100 of years - sensitive to change - responds rapidly to climate change - retreating
Ice sheet - outlet- glaciers
Ocean termination
Larger, faster, thicker
Long residence time for ice within the ice sheet
Mountain glaciers
Discrete bodies of ice in mountain areas
Ice accumulation and flow determined by host/pre existing topography e.g river networks and fluvial valleys
Outlet glaciers
Drain ice from ice sheet interiors
Rapid flow - carasses occur - track these to monitor velocity
On reaching the ocean they terminate
Calving front - chunks of icebergs calve off into the ocean
Calving front - warm conditions
Ice shelves
Floating over sea
Occur in colder conditions
Can be thousands of km ling
Fast flow
measuring glaciers
Length change - monitor retreating from front of glacier - also measure the loss of mass vertically
Surface elevation change
Mass balance change - gains vs losses
Velocity change
length change observations
In general over last 100 years glaciers are retreating - but some fluctuations eg more precipitation in warmer climates
satellite methods
Retreat mapping
Now global - many sources provide monthly/daily coverage
Feature tracking
Melt events - changes in velocity?
GRACE
why and how do glaciers form?
when snow remains on the ground for a number of years
temperatures during the summer are most crucial - as this determines whether the snow remains
needs to be sufficiently cold during summer and sufficient snowfall during winter
in polar and high altitude regions
the weight of subsequent snowfall gradually compresses the underlying snow forcing the snow to recrystallize to simpler and more packable orms
the new crystals grow larger and intervening air pockets smaller as the overlying weight increases
eventually the air content is restricted to bubbles and glacier ice is formed
after a few winters (depending on snowfall rate) firn - an intermediate state between snow and ice - is formed
continued compression - further expansion of ice crystals - remaining air is compacted into bubbles
the time taken for snow to turn to glacier ice depends on the snowfall accumulation rate and the presence of meltwater in the snowpack
high accumulation + meltwater = the fastest
presence of meltwater freezing and refreezing speeds up the process of densification
density differences between snow/firn/glacier ice
new snow = 50-70 kg/m3
firn = 400-830
glacier ice = 830-917
characteristics of glacial ice
blue colour
air bubbles compressed out and more dense means it absorbs a small amount of longer wavelength red light leaving a bluish tint in the reflected light
when glacier ice is white there are many tiny air bubbles still in the ice or tiny fractures and it reflects all wavelengths equally
climate archives
analysing the chemistry of the air trapped in bubbles can tell us about the climate at the time that the ice was formed
once the air bubbles became isolated from the atmosphere
this idea has been used to great effect reconstructing past climate change from ice cores
what is glacier mass balance
difference between gains and losses - positive or negative over a given time period
two categories of processes
accumulation - adds mass to the glacier
ablation - takes away mass
mass balance varies over time and space
ablation processes
melting and runoff
surface melting most important - particularly for land terminating glaciers
subaqueous melt at lake and ocean terminating glaciers - melting of ice underwater - sensitive to temperature and motion of water
basal melt - when ice is in contact with substrate
frictional heating due to differential motion at the ice bed
geothermal heat from radioactive decay of elements in the earth’s core and mantle
basal melt induced by rainfall runoff
meltwater that refreezes elsewhere on or within the glacier does not count as mass loss - just redistribution
highest melt rates = where steep mass balance gradients enable glaciers to extend into relatively warm low altitudes e.g Franz josef glacier in new zealand (23m/yr at the terminus)
sublimation
transition from solid ice straight to water vapour; cold dry and windy climates where air humidity at the glacier surface is greater than in the free atmosphere above
solid ice discharge
either directly in a lake or ocean (iceberg calving) or motion of ice across the grounding line (the point at which a glacier begins to float) into an ice tongue or shelf
can result in very rapid loss of several km3 of ice e.g helheim glacier in greenland
calving from ice shelves does not count as this mass has already been lost from the glacier (i.e it is floating on the ocean)
dry calving
serac collapse and avalanches
possible in steep mountainous terrain
accumulation processes
snowfall
usually the most important form of accumulation
deposition of other forms of ice
depth hoar: temperature gradients between the insulated ground and cold snow surface lead to sublimation and deposition of uprising water and vapour in snowpack
Freezing rain: supercooled raindrops freeze to the ice surface
rime ice: water droplets within fog freeze to the ice surface
superimposed ice
ice that forms from the re-freezing of water saturated snow
avalanches
enable the existence of glaciers outside the climate envelope (where normally snowfall would not survive between winters)
wind blown snow
can cause significant variations in local mass balance
important for survival of small cirque glaciers
basal freeze on
terrestrial or aqueous
spatial variations in pressure mean basal water freezes onto overlying ice
water remains liquid at lower temperatures when the pressure is high (pressure melting point)
highest accumulation rates = mountainous regions with frequent onshore winds and much orographic precipitation (topography induced)
lowest accumulation rates = very dry and cold conditions. e.g the interior of antarctic ice sheet
surface mass balance and ablation
Many mass balance processes occur at the glacier surface and are collectively termed surface mass balance (SMB)
Whether the ice surface gains or loses mass is partly dependent on the surface energy balance - the net energy produced by
Solar radiation: mostly short wave radiation
Long wave (infrared) radiation: emitted from the atmosphere and earth surface when heated
Sensible heat: exchange with the atmosphere (like wind chill)
Latent heat: related to phase changes (water, vapour, ice)
Heat supplied by rain
If the energy balance is positive after the glacier surface has been raised to the melting point, the surface will ablate, if it is negative, ice will accumulate
Note also the importance of surface debris which typically hinders ablation
Latent heat example: freezing of liquid water releases energy while melting of ice absorbs energy
Albedo of the glacier surface controls the ratio of incoming to outgoing solar radiation; higher albedo surfaces reflect more radiation
determining surface mass balance - temperature and snowfall lapse rate
Mean temperature lapse rate under normal conditions = -6.5 degrees per km altitude
Snowfall typically increases with elevation for two reasons
Orographic precipitation (most air is forced to rise by topography)
Proportion if precipitation falling as snow increases with elevation due to cooler temperatures
Snowfall may reduce at high elevations because cold air cannot hold sufficient moisture (blue dotted line)
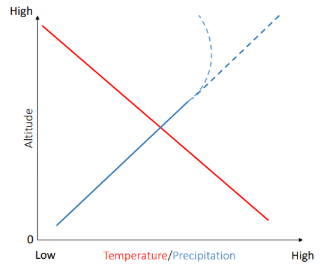
glacier mass balance: typical variation with altitude
Variations of temperature and precipitation with altitude result in typical ‘glacial zones’
Dry snow zone
theoretically no melt - but in greenland there isn’t anywhere like that now - but still in antarctica
Percolation zone
Surface melt but refreezes in snow
Wet snow zone
The whole snowpack can experience melt and refreezing (not just the surface)
Superimposed ice zone
Meltwater refreezes to colder ice surface
Bare ice zone
Each year’s accumulation of snow and ice is fully melted and ice from previous years can be removed
nolin and payne (2007)
mass balance: visible features
Equilibrium line altitude (ELA) - a line joining locations where ablation is exactly balance by accumulation for a mass balance year
Equilibrium line should balance with snow line and firn line - if glacier is in steady state and equilibrium
mass balance gradient
variation of mass balance with altitude
concept important for how a glacier might respond to climate change - related to temperature and precipitation lapse rates
Glaciers with a high mass balance gradient have greater ablation and accumulation - temperate maritime climates
Mass balance gradient is the average of accumulation and ablation gradients
Ablation gradient typically slightly steeper than accumulation, so inflection point in mass balance gradient at ELA
Balance ratio = ablation gradient/accumulation gradient
Glaciers with high balance ratios (greater rate if change of ablation with elevation) have small ablation areas compared with the area of the glacier and vice versa
glacier mass balance: typical seasonal pattern
Mass balance is usually seasonally governed, with distinct periods of net positive (winter) and negative (summer) mass balance (winter accumulation regime
A mass balance year extends between two successive mass balance minima
Most accumulation occurs in the winter, with only a small amount in the summer
Most ablation occurs in the summer with only a small amount in the winter
The sum of the winter (positive) and summer (negative) balances is the net balance
how is mass balance quantified?
direct field measurements: representative point measurements distributed across a glacier
Ablation
Repeated measurement of the length of stakes drilled into the ice surface
Accumulation
Short-term accumulation: can also be measured by ablation stakes
Seasonal accumulation: measured by reference to upper surface of the previous season’s firn
Multi-year accumulation: measured by digging a snow pit, or extracting a shallow ice core and identifying key seasonal variations in snow structure and density
Net mass balance
Compare ablation (m w.e.) with accumulation (m w.e.) over the balance year
glacier volume change (Geodetic methods)
From repeat topographic surveys or digital elevation models (DEMs)
Map contour comparison
Terrestrial photogrammetry
Remotely sensed DEMs - e,g from stereographic aerial or satellite radar altimetry
Must convert volume change to mass change and then water equivalent volume (i.e. need to know density of ablated/accumulated material
Can calibrate surface elevation changes with snow pits and cores
Or use average densities for snow, firn and ice
Can have change in volume with no change in mass e.g. snow melting but then refreezing within snowpack and firn densification
hydrological method (for valley catchment glaciers)
Stream gauges used to measure glacier and catchment runoff, R
Precipitation, P is measured on and off ice
Evapouration, is either estimated or measured (usually relatively small)
Mass balance = P - R - E
mass flux method (for ice sheets)
• Compares the mass flux (depth-averaged ice flow and ice thickness) through a downstream cross-section (often at the grounding line where the ice begins to float) with upstream observed or modelled accumulation and ablation
Weighting ice sheets: satellite gravimetry
Satellites (e.g GRACE) measure small changes in the earth’s gravitational r=field every 30 days
Temporal changes in the regional mass distribution of ice sheets and underlying bedrock can be extracted after removing the effects of tides, changes in ocean circulation and atmospheric loading
Two satellites send signals to each other/measure the distance between each other - because of the size of the greenland ice sheet is alters the gravitational pull - these satellites can measure this
glacier mass balance and climate
Knowledge about mass balance of current glaciers and its relationship with climate can be used to:
Reconstruct past climate from paleo glacier extent, shape and behaviour (e.g. Carr et al. (2010))
Quantify/predict impacts of changing glacier mass balance on
Catchment water resources (e.g. of mass loss of glaciers in the Alps – Farinotti et al. (2016))
Sea level (e.g. Arctic Canada – Gardner et al (2011))
But mass balance is typically difficult and/or expensive to measure, so glaciologists have produced some simpler ‘proxy’ metrics
contemporary mass balance proxies
Snow line (c. ELA) mapping of contemporary glaciers as a proxy for mass balance
For temperate glaciers, ELA estimated by mapping the end of the summer snow line (i.e. when glacier mass balance is at a minimum)
Relative position of snow line and firn line can be used to assess longer-term trends in mass balance
Snow line adjacent to bare ice = positive mass balance relative to preceding year (snow cover more extensive than long-term firn cover)
Snow line separated from bare ice by firn = negative mass balance relative to preceding year (snow cover less extensive than long term firn cover)
paleo glacier mass balance proxies
Maximum altitude of lateral moraines
Delineate ELA based on evacuation of debris by ice flow only in the ablation area
Accumulation area ratio (AAR)
Modern glacier ELA used to determine relative size of the accumulation area, typically ~0.6 (60 % of total)
Palaeo glacier extent and surface elevation reconstructed from geomorphology and a hypsometric curve constructed
Area altitude (mass) balance ratio (AABR)
AAR varies between glaciers based on hypsometry (distribution of area with elevation)
Inclusion of the (mass) balance ratio improves AAR by considering both glacier hypsometry and the ablation and accumulation gradients (Rea, 2009)
Complications
Debris cover insulates ice from atmospheric temperatures
Precipitation shadows change based on growth of down-wind glaciers
glacier response times
Response time is the time taken for a glacier’s geometry to adjust to a new steady state after a change in glacier mass balance (usually caused by a change in climate)
Response time depends on
Glacier volume & area (represented by thickness in table opposite)
A change in climate will produce a relatively larger change in ELA at a smaller glacier
Glacier mass balance gradient (represented by terminus ablation in table opposite)
Glaciers with steeper mass balance gradients respond faster due to more rapid mass throughput (these usually also have a steeper surface slope)
long term variations in climate and mass balance
Sustained positive mass balance
Glacier will advance and thicken
Sustained negative mass balance
Glacier will retreat and thin
Speed of the above changes depends on glacier’s response time and rate of climate change
Size of the above changes depends on the elevation range and hypsometry of the glacier
Glaciers with a greater proportion of their area close to the ELA will experience a bigger response to a change in ELA because a larger portion of their area will experience either a mass gain or loss
role of ice flow
move mass from accumulation to ablation area to try and maintain equilibrium - otherwise would be unstable
redistribution of mass: balance velocities
Balance velocities relate ice flux to glacier mass balance
For an idealised glacier of constant size and shape (side view, right)
Ice flux through a cross-section should equal the sum of accumulation and ablation occurring up glacier of the section
Based on this idea, glaciers with steeper mass balance gradients will have greater balance velocities
ice discharge increases from the head of the glacier to the ELA, and then decreases from the ELA to the snout
Useful concept to determine, from ice flow observations, whether a glacier is dynamically unstable (i.e. mass in = mass out)
But this is rarely the case – glaciers are not usually (or ever!) in steady state but reacting to changes in climate over many timescales
Glacier will move faster if more accumulation and ablation to balance
key concepts: newtons law of motion
1. An object either remains stationary or moves at a constant velocity unless acted on by a force
2. The sum of forces, F acting on an object, is equal to the mass, m of the object multiplied by its acceleration, a.
F = ma (1 N = 1 kg x m s-2 )
3. If an object exerts force on another object, the second object exerts an equal and opposite force on the first
key concepts: stress
Stress
Force per unit area (Units = Pascals: 1 Pa = 1 N m-2 , or kilopascals 1 kPa = 1000 Pa)
Same force acting across a smaller area - bigger stress
Different types of stress
Normal stress (tension or compression)
Acts perpendicular to a surface
E.g faster ice flow meeting slower flowing glacier
Pulling material apart
Shear stress
Acts parallel to a surface
Differential motion in same direction or opposite directions
Antarctica - fast flowing ice stream bounded by ice flowing in same direction but slower
Material properties
Yield stress: the stress at which a material begins to deform plastically (i.e. a permanent change in shape).
Non-permanent deformation is termed ‘elastic’
stresses affecting a glacier
Weight, W is the force on an object due to gravity – the product of an object’s mass, m and the acceleration due to gravity, g (9.81 m s-2)
W = mg
For a glacier, mass is a function of the density of glacier ice, i (~900 kg m-3 ) (rho ice) and its thickness, h (~100 m)
If the glacier bed is flat
W = ρi gh
W = 883 kPa
However, if the glacier is represented by a parallel-sided slab of ice on a sloping bed (e.g. = 6), W is split into normal stress and basal shear stress, (tau) components
τ = ρi gh sin α
τ = 92 kPa
It is basal shear stress (i.e. the down-slope component of gravity acting on an ice mass) that drives glacial flow
Ice moving under its own weight due wo these stresses
Stresses increase with ice depth as the weight of overlying ice increases
key concepts: strain
Strain
The relative deformation of a material experiencing stress (e.g. change in length in a given dimension) (unitless ratio)
Strain rate
The rate of change of shape of a material experiencing stress (often used in glaciology) (units: yr-1 )
Most common types of strain associated with ice flow
Pure shear: flattening or compressing (e.g. ice being forced to flow through a lateral constriction such as a narrow valley)
Simple shear: shear stress (e.g. where there are sudden changes in ice speed – at the edge of an ice stream)
Differential motion
ice flow mechanisms: internal deformation
Internal deformation/ice creep due to gravity acting on ice mass (driving stress)
Results from movement within or between ice crystals
Above yield stress but below brittle failure (not forming cravasses)
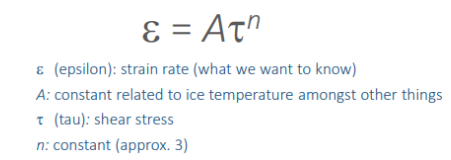
Glen’s flow law (Glen, 1955; Nye 1957) based on laboratory measurements of ice deformation
Strain rate roughly scales with the cube of the stress (if stress doubles, strain increases by a factor of 8)
Internal deformation velocity (UF ) profile – increases towards the surface because sum of deformation in each layer
Rate of most deformation is at the bottom due to more shear stress - lessens at the top
ice flow mechanisms: basal sliding
Sliding at the ice-substrate interface (basal sliding)
Water at the ice-substrate interface lubricates ice flow
Basal water pressure reduces normal stress (due to weight of overlying ice) resulting in a lower ‘effective pressure’ (the actual stress between the ice and its bed)
Water may be present because
Due to the stress of the overlying ice, ice melts at a lower temperature (see thermal regime slides)
Geothermal heat means the substrate is warm enough to melt the ice
Friction caused by ice motion melts the ice
Surface-derived meltwater reaches the bed through moulins and crevasses
The rate of sliding depends largely on the basal water pressure (you will learn more about this later in the module)
Leaves behind key evidence for former ice flow directions (more on this later in the module)
Rocks it carries - gauges out - striations
ice flow mechanisms: substrate deformation
Many glaciers are underlain by a product of glacier erosion called till, a mixture of sediments varying in size from clay to boulders.
Just like basal ice, the till experiences stress from the weight of the overlying ice can deform
The strain rates depend on various factors such as the pore water pressure in the till, and the mechanical strength of the till (affected by whether it is frozen solid)
Evidence:
Differential motion of segmented rods in till beneath a glacier in Iceland (Boulton et al., 1979)
Deformed palaeo subglacial sediment
valley glacier velocity profiles
Ice velocity in a section across a valley glacier is greatest at the top and centre of the glacier
Cumulative deformation of underlying ice and basal motion (sliding and/or deformation)
Least friction from valley sides
Can be seen from surface patterns (e.g. ogives) which deform with differential ice motion
typical ice flow velocities
Most valley glaciers flow at a rate of 10 – 100 m yr-1 (‘normal’ glaciers) by a combination of internal deformation and basal motion
Many tidewater glaciers and ice streams flow at a rate of 100 - >1000 m yr-1 (‘fast’ glaciers) and move mostly by basal motion up to ~12 km yr-1 (Jakobshavn Isbrae, Greenland)
Typically ice flowing > 100 m yr-1 (~0.25 m d-1 ) can be assumed to have a significant basal motion component (see example ice flow speed map of the Greenland Ice Sheet)
Surging glaciers (more later in the module) can temporarily flow at > 22 km yr-1 (>60 m d-1 )
limits on ice flow
Ice is ‘slippery’, and the gradient of glaciers’ beds is often steep, so why don’t glaciers simply slither off downslope?
Bed roughness
Ice must be transferred around obstacles in the bed
There are two main ways this can occur
Regelation sliding (bumps < 1 m): Higher stresses on the upstream side of basal obstacles reduce the pressure melting point allowing ice to melt and resulting meltwater to flow to the downstream side of the obstacle where the lower pressure allows the water to freeze back on to the ice.
Enhanced creep (bumps > 1 m): The same higher stresses that cause the ice to melt also result in enhanced ice deformation around basal obstacles
Adhesion by freeze-on
Requires ice below pressure melting point and variations in effective pressure
Can resist high basal shear stresses
Limits ice motion because basal motion is absent or minimal (i.e. only internal deformation in the layers above)
Friction from debris carried by the ice
Proportional to the force pressing particles to the bed (i.e. proportion of weight of overlying ice or normal stress)
Pressing down hard on sandpaper and trying to move it across a piece of wood is a useful analogy
quantifying ice flow
Movement of stakes drilled into ice
Traditional & laser surveying methods
GPS antennae
More recently
Very high temporal resolution but only at relatively few points
Matching of patterns in sequential aerial photographs or satellite images - can measure over a much broader area
So-called ‘feature tracking’ (cross correlation of brightness patterns)
Can cover very large areas at reasonable temporal spacing (days to weeks)
what is glacier thermal regime?
Thermal regime: variation of temperature of glacier ice
Glaciers are not uniformly cold
Typical valley glacier close to 0C Parts of Greenland Ice Sheet -20 C
Parts of the Antarctic ice sheet -40 C
Thermal regime characterises the temperature of a glacier’s ice and its behaviour
Pressure melting point of ice (PMP)
Melting point of ice decreases with pressure
Beneath 2000 m of ice (typical for Antarctic and Greenland ice sheets) ice melts at -1.27C
controls on ice temperature
Heat exchange with the atmosphere
Temperate regions
Seasonal variations in near-surface firn temperature related to atmospheric temperature
Winter ‘cold wave’ can penetrate down from surface
Cold regions
Firn and resulting ice will be close to the annual mean air temperature
Geothermal heat flux
Heat transfer from Earth’s gradual radioactive decay
Varies depending on tectonic setting
Global mean value sufficient to melt 6 mm of ice (at the pressure melting point) per year
Frictional heat generated by ice (and water) flow
Derived from differential ice motion (shear) within the glacier, basal sliding & water flowing in contact with ice (‘cryohydrologic warming’)
Typically, only significant for ice close to the ice base
Heat is equivalent to melt 100 times as large as typical geothermal heat for fast flowing glaciers
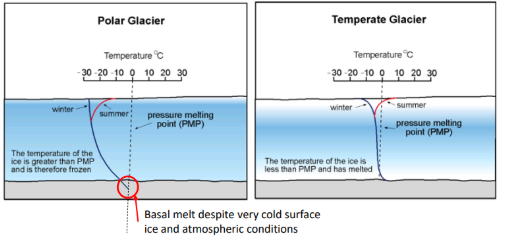
Glacier thermal regimes
Polar glacier (cold based)
Air temperature well below zero all year round
ice-bed interface is below freezing too (i.e. ice not thick enough to reduce PMP under high pressure)
Temperate glacier (warm based)
Air below zero in winter, but above in summer; surface-derived meltwater may get to the ice-bed interface
Ice-bed interface is at or above pressure melting point
Polythermal/subpolar glacier (mixture of cold and warm-based)
Typically temperate in interior, but cold at the margins
Typical ice temperature depth profiles
Typical ice temperature-depth profiles show an increase with depth due to influence of shear heating, basal friction and geothermal heat flux
Even in cold regions, basal ice may be at the pressure melting point if the overlying ice is sufficiently thick to reduce the PMP
effects of thermal regime on ice flow
Cold based
Ice-bed interface is strong and can support high shear stresses, so internal deformation dominates ice motion
Some regelation and enhanced creep may occur, but rates are slow
Generally low velocity
Warm based
Ice-bed interface is weak and ice slides readily over the substrate
Deformation of subglacial sediment may also occur
Generally high velocities
Characteristics of glaciers with different thermal regimes
Cold based
Relatively thin, shallow-sloped and slow flowing glaciers where winter air temperatures are very low (e.g. Arctic Canada, Antarctic Dry Valleys)
Minimal potential for landscape alteration (erosion and deposition – more later in the module)
Warm based
Relatively steep and fast flowing glaciers in more temperate climates (e.g. European Alps, New Zealand)
Huge potential for landscape alteration (erosion and deposition – more later in the module)
Glacier behaviour: mass balance, flow and thermal regime
Mass balance drives a glacier system
Ice flow attempts to redistribute the mass and maintain a steady state surface profile
Ice flow is influenced by thermal regime (variations in ice rheology & internal deformation, amount of basal sliding etc.)
Ice flow can also affect ice temperature (e.g. shear heating)
Together mass balance & thermal regime determine the form, flow and size of a glacier and its tendency to (and rate of) advance or retreat
Mass balance sensitivity to thermal regime
Dawson et al. (2022) used numerical modelling to explore how warmer basal ice temperatures could affect Antarctic Ice Sheet mass balance
Areas of thawing bed would cause new loci of mass loss – more sliding, sediment deformation could lead to faster ice flow into the ocean or to lower, warmer regions.
So important to look at the physical processes that could cause basal thawing
For example, external atmospheric and ocean forcing driving thinning, recession and acceleration (frictional heat at the bed, impact of warmer air on snow, firn and ice temperatures)
supraglacial definition
water flow on top of ice masses
englacial definition
flow within the glacier e.g crevasses, moulins etc
subglacial definition
water flow beneath the ice
importance of glacial hydrology
crucial to understanding of glacier motion and hazards
water sources
snow and ice melt at the glacier surface
most important
up to 10 cm per day - typically less that 10m per year
basal melt
frictional heating due to differential motion at the ice bed (few 10s of cm/yr)
geothermal heating (few cm/yr)
basal melt induced by rainfall and meltwater
groundwater and runoff from subaerial sediments and bedrock
very few estimates, probably quite small
liquid precipitation (ie, rain)
may be significant
depends on climate, altitude, location etc
primary permeability definition
the permeability of an intact block of snow, firn or ice
secondary permeability definition
permeability of fractures, holes, tunnels etc
primary and secondary permeability of snow
primary
high to low
water can move through linked spaces around snow crystals
but dense wind pack is less permeable and ice lenses can be locally impermeable
secondary
can have rills
but fewer passageways form due to high primary permeability
primary and secondary permeability of firn
primary
high to low
depends on density
water can move through linked spaces around compressed snow crystals
dense firn can be almost impermeable and ice lenses can be locally impermeable
secondary
can have rills but fewer passageways form due to high primary permeability
primary and secondary permeability of glacial ice
primary
low (if warm ice)
water can flow along boundaries of ice crystals if pressure gradient is steep
negligible (if cold)
air pockets are isolated and no water can flow
secondary
high for warm ice where there can be many moulins, englacial passageways and subglacial conduits
lower for cold ice although crevasses can provide an englacial pathway for melt water
variability of meltwater production
surface melt is largely controlled by incoming (shortwave) radiation (insolation)
but also by air temperature which is especially important for raising snow and ice to the melting point
spatial and temporal variation of melt rate
spatial
cloud cover, albedo, debris cover, slope, aspect, shadows, proximity to rock walls
temporal
sun elevation, air temperature, cloud cover, albedo (snowfall and snowmelt)
spatial variability of meltwater production
potential direct clear sky insolation is affected by aspect, slope, cast shadows
insolation changes relative to a flat glacier in the same geographical position
example
shaded relief, cast shadows e.g mountains, slope and aspect e.g south facing slopes - where sun is in sky in parts of world
glaciers typically form on north facing slopes
influence of temperature and albedo on ablation
high temp = faster melt
low temp, high albedo, high humidity = snowfall
snowfall leads to accumulation and then slower melt until snow is ablated
higher albedo = snow accumulation and then slower melt
typical pattern of melt rate
runoff decreases with altitude
temperature and albedo
runoff is much greater from areas of snow free ice because it has a lower albedo an is exposed at lower elevations
for a given glacier, runoff is greatest later in the melt season when surface snow has melted from the ablation zone and temperatures and insolation remain high
influence of debris cover on surface meltwater production
debris cover complicates melt rate
albedo: thin layer of surface debris reduces glacier albedo and increases melt rate and runoff
insulation: thick debris insulates the underlying ice resulting in low melt rates despite the lower surface albedo
meltwater flow theory
flow of water is governed by hydraulic potential - the energy of water available at a particular time and place
hydraulic potential is controlled by the hydraulic elevation head (elevation potential) and the hydraulic pressure head (Water pressure)
water flowing on a glacier surface (i.e where water pressure = atmospheric pressure which is even across the glacier) is only affected by the elevation potential and water flows downslope just like on land
within and beneath a glacier, the pressure head (where water pressure is controlled by the thickness of overlying ice) is also important and water flow routing is determined by a combination of bed elevation and pressure head
Flow of water governed by hydraulic potential
Energy water has at a given time and location
Hydraulic elevation potential and hydraulic pressure head
Water can flow uphill under glaciers due to variations in ice thickness therefore influencing pressure
meltwater routing
snow and firn: present year round in the accumulation area and snow in the ablation area in winter
meltwater generated at or near the surface percolates downwards through the snow
it may refreeze in the snowpack and not runoff, or if meltrate exceeds refreezing rate, water accumulates
this ponded water can form slush zones in topographic lows on shallow slopes
if sufficient melt occurs on steeper slopes, meltwater flows literally via rills (narrow and shallow channels) that may occur at the surface or within the snowpack
percolation depth is limited by the low permeability ice beneath
water from the snowpack flows onto the glacier surface at the firn line (assuming negative mass balance relative to long term mean)
ice is exposed at the surface in summer in the ablation area (but is present beneath snow and firn across the whole glacier)
glacial ice has low primary permeability, so in the absence of fractures etc. meltwater quickly accumulates into the supraglacial streams
streams thermally erode the ice surface faster than ambient ablation due to energy from turbulence
water flow in streams is rapid compared to percolation
meltwater may penetrate the top few 10s cm of the ice as solar radiation inducing melting enlarged veins along ice grain boundaries. This forms, a pale, crunchy weathering crust
temporal evolution
as melt season progresses and snow melts, its extent and thickness reduce
this reduces percolation times and exposes more ice
the combined effect is to reduce the time lag between variations in melt production and runoff
supraglacial drainage networks
supraglacial streams
shallower, lower discharge, transient, tributary segments of a supraglacial drainage network
supraglacial rivers
deeper, larger discharge, perennial, mainstem segments of a supraglacial drainage network
stream morphology
thermal erosion
frictional heat dissipation in turbulent water flow
solar heating due to lower albedo
after initial erosion, ablation along channel walls widens the stream
in a wider channel, streams tend to meander due to variations in water flow caused by differences in bed roughness
once initiated, meandering typically increases because faster flow around the outside of bends is more turbulent and generates more heat to melt the channel wall
streams tend to be straighter where the local ice surface is steeper and meander more where it is shallower
supraglacial ponds
form in topographic lows on shallow slopes on a melting glaciers surface
most common on debris covered glaciers where they significantly enhance local ablation rates due to heat absorption, ice melting and calving
many larger lakes form annually in ablation areas of ice sheets
englacial drainage: crevasses and fractures
fractures, including crevasses, caused by tensional stresses within the ice provide pathways for surface water to enter the glacier
locally generated meltwater flows into crevasses and can fill them up, acting as a temporary store of water
because water is denser than ice, the additional stress at the base of a water filled crevasse deepens the crevasse delivering water to the ice bed, either directly, or by intersecting an englacial conduit
englacial drainage: moulins
where a supraglacial stream or river intersects a crevasse, frictional dissipation of heat in the turbulent water flow locally enlarges the crevasse forming a quasi vertical shift called a moulin
ablation by insolation and relatively warm air enlarges the moulin, particularly near the ice surface
moulins can fill and overflow from the moulin base
moulins are often abandoned by water flow as they are advected down glacier
a new crevasse opens up up stream and a new moulin captures the water flow
ice flow parallel lines of relict moulins can often be seen down glacier of active moulins
spatial patterns of stress control where crevasses and thus moulins form, and therefore influence glacier hydrology
englacial conduits
evidence from boreholes drilled into glaciers suggests that englacial voids and conduits exist to depths of at least 200m
theoretically, ice walled conduits can form from water flow along ice crystal boundaries if closing rate from the pressure of surrounding ice compared to the water pressure in the conduit is balanced or exceeded by melt caused by heat dissipation in the flowing water
theoretical steady state conduit water flow suggests that
1. bigger conduits enlarge faster
2. bigger conduits have lower pressure
3. bigger conduits therefore capture water from smaller ones
4. water flow is down the steepest hydro potential gradient
englacial conduits do not tend to follow the steepest hydro potential gradient
instead, they form from overhanging closure of supraglacial channels (cut and closure), or existing fractures and crevasses that may have been exploited by hydrofracture (excess stress created by water presence or flow)
connectivity between fractures, moulins and channels remains poorly understood, but is likely complex
hydro potential field controls large scale water flow within temperate glaciers, but that water exploits all available structural weaknesses meaning that local water flow does not necessarily conform to theory
subglacial hydrology
flow of water at the base of the ice
at most temperate glaciers glaciers, the water comes mostly from the surface melt via the englacial system
basal inputs - from frictional melting caused by ice sliding over the substrate, from geothermal heat flux, ground water and additional melting caused by relatively warm surface derived water
for some polythermal and cold ice masses, there are no surface inputs and basal inputs dominate
delivers water to the ice margin where it exits via a portal into a proglacial river, lake or into the ocean
basal environment - hard or soft bed
glaciers underlain by a product of glacier erosion - till
till cover - deep and extensive - soft bed
till cover - shallow, patchy, or none - hard bed
type of substrate is an important control on how water flows and how the overlying ice behaves
subglacial water flow routing
beneath a glacier, the pressure head (water pressure controlled by the thickness of overlying ice) and elevation head are both important for hydropential
the resulting hydro potential surface, can be used to estimate the path of subglacial water down the steepest hydro potential gradient using gridded inputs of ice surface and bed elevation
steady state + equilibrium
steady state refers to a case where water flux into the system is equal to water flux out of the system
there is no change in the volume of water within the system
equilibrium refers to a state where the rate of conduit closure by ice creep from the pressure of surrounding ice compared to the water pressure in the conduit is balanced by melt caused by heat dissipation in the flowing water
subglacial hydraulic efficiency
subglacial hydraulic efficiency describes how well a subglacial hydrological system can accommodate an increase in water flux
in an efficient system, a large increase in water input (high melt day or intense rainfall) can be accommodated with minimal impact on water pressure
in an inefficient system, the same increase in water input results in a larger and longer duration increase in water pressure
efficient systems may have unused storage capacity or they can increase their hydraulic capacity rapidly to accomodate the additional flux
controls on subglacial water pressure
glacier thickness: the greater the weight of the overlying ice, the greater the subglacial water pressure
the rate of water supply: inputs of large amounts of meltwater may increase the subglacial water pressure as water backs up in the system
the rate of water discharge: an efficient subglacial drainage system will reduce subglacial water pressure
the nature of underlying geology: permeable bedrock or sediment will allow water to drain and therefore reduce subglacial water pressure
subglacial drainage configurations
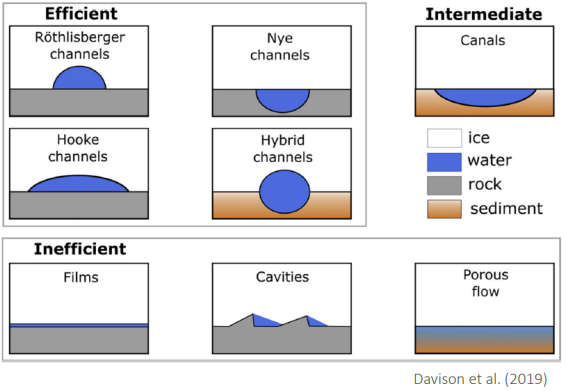
typical hard bed configuration
inefficient drainage - linked cavities
distributed system of cavities and connections with slow water flow and high water pressure
higher water flux - higher water pressure - lower basal friction
efficient drainage - rothlisberger channels
a few main channels with fast water flow and low water pressure
higher water flux - lower water pressure - higher basal friction
typical soft bed configuration
inefficient drainage - porous water flow through till
distributed slow water flow through subglacial till at high water pressure
higher water flux - higher water pressure - more sediment deformation
efficient drainage - hybrid channels
a few main hybrid channels with fast water flow at low pressure
higher water flux - lower water pressure - less sediment deformation
methods for observation of the seasonal evolution of subglacial drainage
fluorescent dyes
injected into supraglacial streams at moulins and detected in the proglacial river
the time taken for peak dye concentration to be detected, and the shape of the dye return curve provide information about the flow speed and hydraulic efficiency of the subglacial hydrological system
earlier in the melt season there is a greater lag between injection and detection, and the dye is released from the glacier more slowly
later in the melt season the dye is transported more rapidly and is more concentrated
this suggests an evolution in subglacial hydraulic efficiency (from a distributed to a more channelised system) as the melt season progresses
removal of snow cover and exposure of relatively low albedo ice in the ablation area is the key source of increased surface water flux
seasonal evolution of subglacial drainage theory
in equilibrium (where the channel or cavity is initially neither expanding or contracting)
for a system of linked cavities an increase in water discharge, Q, leads to cavity expansion, hydraulic jacking and lower effective pressure, N
for an efficient channel, a similar increase in discharge, Q, leads to enhanced channel wall melting via turbulent heat dissipation, an increase in channel cross section area and higher effective pressure
at a critical discharge, related to the amount of heat generated by the water flow and for a given ice thickness, ice viscosity and bed roughness, wall melting becomes sufficient to outweigh creep closure and an efficient channel can form
water exchange between drainage types
in equilibrium, water pressure in a channel drops with increasing water flux
but channel growth can take days to weeks, whilst meltwater supply can vary over hours, so true equilibrium is mostly theoretical
rapid increases in meltwater supply can overwhelm channels - water pressure increases
rapid decreases in meltwater supply can lead to open (Atmospheric pressure) flow in channels - water pressure decreases
diurnal water pressure fluctuations in channels drive exchange of water with surrounding linked-cavities across a variable pressure axis (hubbard et al 1995)
spatial variability in drainage type
connection to surface meltwater sources:
parts of the subglacial drainage system that are directly fed by surface derived meltwater are well connected:
experience greater water flux overall
have greater variability in water flux over diurnal to seasonal timescales
are therefore more likely to be channelised, though channels can be over pressurised daily
over pressurization of channels leads to exchange of water with poorly connected parts of the bed that
experience smaller water flux overall
have less variability in water flux
are therefore more likely to remain inefficient throughout a melt season
remaining unconnected parts of the bed may be hydraulically isolated from surface water
experience very small water flux as water is generated solely by basal processes, frictional and geothermal melting
have limited variability in meltwater flux
are very likely to remain inefficient
case study - small valley glacier, Yukon territory, Canada
• What and where: 8-year dataset of borehole observations on a small, alpine polythermal valley glacier in the Yukon Territory, Canada
Aim: to test how well current theory describes water pressure variations at this glacier
Findings
Theory of increasing subglacial hydraulic efficiency during a melt season explained most aspects of the data
Much of the bed becomes disconnected from surface meltwater inputs during melt seasons
Subglacial drainage is concentrated along narrow pathways adjacent to channels
In each year, subglacial drainage shuts down soon after snowfall remains for a few days on the glacier (rather than when temperature falls sharply) highlighting the important role of surface albedo
Dense borehole array on study glacier. Inset shows location (Rada and Schoof, 2018)
subglacial water storage
water can be stored beneath ice masses
the volume and duration of storage varies significantly
cavities:
form downstream of bedrock bumps and large boulders
part of a hard bed distributed drainage system
water flow through this system is determined by the hydraulic capacity of connections between cavities
water may remain in cavities for days to months
lakes (livingstone et al 2022):
water accumulated in lows in the subglacial hydro potential surface (e.g. behind very prominent bedrock ridges, or areas where the ice is frozen to the substrate)
may be hundred of meters in diameter at valley glaciers but can extend to 10s km beneath ice sheets (e.g. lake Vostok in antarctica)
some lakes form part of the well connected drainage system and can drain over a few days and fill over a few days
other lakes are isolated from surface meltwater inputs and have remained undisturbed from millenia
influence of bed topography on subglacial water flow
subglacial water flow direction is determined principally by the ice surface slope and aspect (and consequent variations in the pressure head)
however, steep adverse bedrock slopes can reduce the subglacial hydraulic gradient
this reduction hinders development of subglacial channels and encourages distributed water flow
presence of near terminus distributed drainage is confirmed by the relatively insensitive relationship between proglacial discharge and sediment concentration
glacier change and water resources: european alps
Farinotti et al. (2016)
glaciers can be considered as stores of water which release melt during the summer when precipitation is generally lower
modelling of glacier mass balance in european alps over the next 100 years under a moderate emissions scenario shows:
an initial increase in water supply from glaciers as they melt faster
but then a reduction as their overall volume decreases
glacier lake outburst floods
Melting glaciers frequently form proglacial lakes in glacier-eroded overdeepenings, dammed by moraine (poorly-sorted glacially-eroded sediment) or ice
• The moraine or ice dam can suddenly fail resulting in a GLOF: ‘a sudden release
of a significant amount of water retained in a glacial lake’ (Emmer, 2017, pg. 1)
• GLOFs
• Are a pervasive global natural hazard (Carrivick and Tweed, 2016)
• Often caused by ice calving, or slope failure into the lake resulting in wave overtopping the dam and subsequent incision
• Earthquakes can trigger the above mass movements
• Characterised by extremely high peak discharges giving high erosional and sediment transport capabilities (Grinsted et al., 2017)
• Can induce other types of mass movement (e.g. GLOF-induced debris flows)
• GLOFs have been recognised by the United Nations Development Program as a significant global natural hazard
importance of glacier hydrology proglacial rivers
glaciers store solid precipitation that falls in winter and release it as melt in the summer
glaciers moderate stream flow variability because glacier derived meltwater runoff correlates with temperature and is higher in the summer, while runoff from the rest of the catchment scales with precipitation and is higher outside of the summer season
glacier fed river flow compensation
this moderating influence of glaciers is called the glacier compensation effect (GCE)(van tiel et al 2019)
GCE theory suggests:
interannual streamflow variability can be predicted based on proportional coverage of glaciers in a catchment
there is an optimum coverage which results in minimal interannual variability
based on data from 50 partly glacierized catchments in the european alps, scandinavia and western canada (van tiel et al 2021) found that GCE during anomalously warm and dry periods varied considerably
antecedent conditions, snow cover, glacial water storage and presence of lakes complicated the simple theoretical relationship
distinct glacial meltwater drainage components
The time taken for glacial meltwater to reach the proglacial river varies considerably depending on where melt occurs and how it is routed
•In the accumulation area, melt percolates into the snow and firn, may be temporarily stored, and then slowly flows laterally (1-2 m/d) through the snowpack before entering fractures
•In the ablation area, once surface snow has melted, melt flows rapidly (0.5-2 m/s) across the low permeability ice surface and reaches the glacier bed via crevasses or moulins
• This results in two distinct meltwater flow pathways: quick and delayed
proglacial river hydrograph evolution
Discharge from heavily glacieriszed catchments
displays strong diurnal variability
superimposed onto a slowly varying base flow
• Diurnal variability (solid lines, opposite) is
driven by glacier surface melt via the quick
pathway, though there is a lag between peak
melt and peak discharge
• Baseflow (dashed lines, opposite) is from
groundwater flow, basal melt water, release of
stored meltwater and surface melt via the
delayed pathway
• Peak daily discharge may be double the
baseflow at small glaciers, but diurnal
variations will be relatively smaller at larger
glaciers
• Peak discharge is normally in late July or early
August in the northern hemisphere
The time lag between peak melt and peak discharge decreases as snow thins and recedes and a greater proportion of the runoff is transported via the quick pathway
why study the links between glacier hydrology and motion?
subglacial hydrology is the most important influence on short term ice velocity fluctuations at temperate glaciers and in many polythermal glaciers and parts of ice sheets too
subglacial hydrology mainly affects basal sliding
basal sliding is important because
it is often the largest component of glacier motion
it controls glacier erosion and sediment transport
mechanisms of glacier flow
ice sheets, ice caps and glaciers flow due to the effect of gravity on their mass
this so called ‘driving stress’ induces three mechanisms that can contribute to surface ice motion
internal deformation of ice
sliding between ice and its substrate
deformation of unfrozen substrate
first detailed observations of ice motion and melt
muller and iken (1973) observed a close association of daily resolution between surface melt rate and ice velocity at four stakes drilled into white glacier - canada
the ice flowed faster on days with more melting
iken (1972) also saw hints of a relationship between water height in moulins and local ice velocity
these observations indicate a causal connection between meltwater inputs to the subglacial system and ice velocity
first detailed observations of coincident horizontal and vertical ice motion
In 1983, Iken and colleagues used repeat photogrammetry and theodolite surveys to show that increases in horizontal ice velocity at Unteraargletscher, Switzerland (lower panel) coincided with uplift of the ice surface (upper panel)
Interestingly, peak horizontal velocity coincided with the greatest rate of uplift, rather than at the point of maximum uplift
This suggested that basal sliding is controlled by subglacial water pressure rather than by the total volume of water stored at the bed
such behaviour occurred multiple times throughout the 1974-1976 melt seasons
regelation sliding and enhanced creep
regelation sliding (weertman, 1957) - small obstacles
ice melts under pressure due to higher stresses on the upstream side of basal obstacles
refreezes on the downstream side due to lower pressure
enhanced creep - larger obstacles
ice is plastically deformed around the feature
larger obstacles result in increased stress and therefore enhanced ice deformation over a larger area
But neither mechanism could explain the association of faster ice flow with more surface melt, nor of faster horizontal ice motion with vertical uplift, so researchers looked to basal water pressure…