AP Statistics FINAL
1/80
There's no tags or description
Looks like no tags are added yet.
Name | Mastery | Learn | Test | Matching | Spaced |
|---|
No study sessions yet.
81 Terms
The most popular colors for cars and light trucks change over time. Here is a relative frequency table that summarizes data on the colors of vehicles sold worldwide in a recent year. What percent of vehicles would fall in the “Other” category?
2%
The scores on Ms. Martin’s statistics quiz had a mean of 12 and a standard deviation of 3. Ms. Martin wants to transform the scores to have a mean of 75 and a standard deviation of 12. What transformations should she apply to each test score?
New score = 4(old score) + 27
Here is the distribution of the adjusted gross income (in thousands of dollars) reported on individual federal income tax returns in a recent year. What is the probability that a randomly chosen return shows an adjusted gross income and $50,000 or more?
0.321
What percent of people aged 20 to 34 have IQs between 125 and 150?
21.95%N I

In recent years, approximately 55% of eligible voters take the time to vote in presidential elections. A poll based on a random sample… Does this data provide convincing evidence at the a = 0.01 level…
STATE:
null: p = 0.55
alt: p does not equal 0.55
p = the proportion

Which of the following CAN be interpreted from this dot plot?
The EPA mpg rating is greater on the highway than in the city for all but one of the cars.

A random sample of 26 high school football players was selected…
STATE:
mew, mean, all

What is the expected number of cars in a randomly selected American household?
1.75
Find the probability that the string of lights will remain bright for 3 years.
(0.98)²0 = 0.6676
construct and interpret a 90% confidence interval for the proportion of all U.S. adults who could name all three branches of the government.
We are 90% confident that the interval from 0.339 to 0.381 captures p = the true proportion of U.S. adults who could name all three branches of the government.
Using the random digits provided, give the number(s) of the first class…
07
Is this convincing evidence that more than half the students at the school would say they regularly recycle?
Yes, this would be convincing evidence that more than half the students at the school would say they regularly recycle. Only 1 of the 200 samples yielded a sample proportion of at least 0.63.
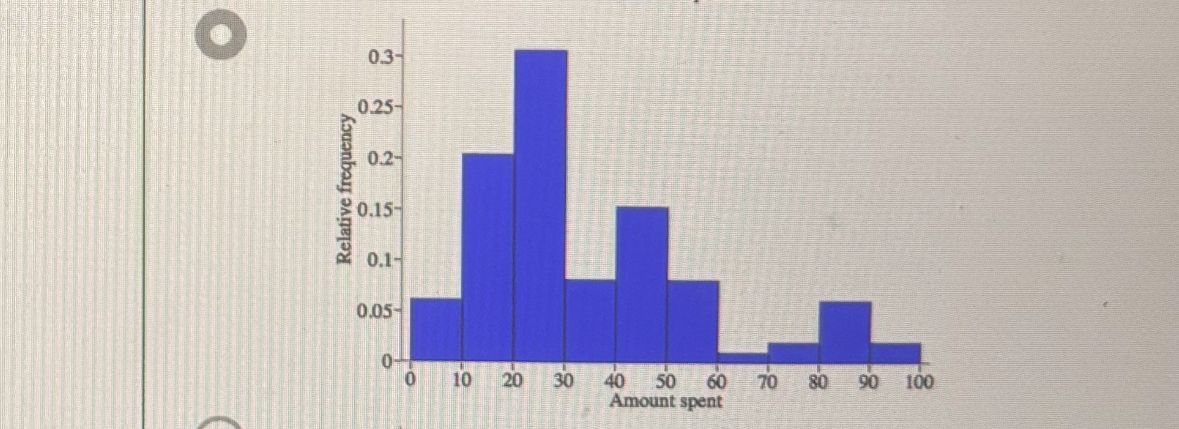
Why is the graph steepest…
…because more shoppers spent amounts in this interval than in any other interval
Which of the following expresses the event “child plays with 5 toys” in terms of X and gives the correct probability?
P(X=5) =OEY 0.11
What is the range of Joey’s first 14 quiz grades? What is the range of Joey’s quiz grades…
24; 98
The deciles… first decile of the standard Normal distribution?
-1.28
The student body president… Construct a 99% confidence interval for p.
(0.332, 0.588)
Which statement about the overall shape of the distribution of calories per serving is true?
The shape of the distribution is roughly symmetric with a single peak.nO
One company’s bottles of grapefruit juice are….what conclusion can be made at the a = 0.05 sig. level?

Tonya wants to estimate what proportion… construct at 90% confidence interval for p
(0.616, 0.824)
What percent of large lids are too big to fit?
Approximately 0%
What percent of Djokovic’s first serves have speeds between 100 and 110 mph?
33.64%upposeS
Suppose Ted is creating a football team in a video game…
Q1= -218.8
Q3 = 1755.3
Julio Jones
Antonio Brown

A random sample of 24 high schools from across the US
mew, mean number, all

The National Household Travel Survey gathers data on the time of day…What is the probability that the chosen trip did not begin between 9 am
0.766
what proportion of the sample is female?
0.633
Is the variability in sugar content of the cereals similar or different for the three shelves?
The variability in distributions of sugar content is similar for the three shelves, as they all vary from about 0 grams per serving to about 15 grams per serving.
How many text messages did Joelle
1 test messageA
About what percent of the cereal brand have 130 or more calories per serving?
10.40%
First-class letters weighing more than 1 ounce require extra postage. What percent of first-class letters at this post office…
2.60%
What percent of respondents are males and feel
12.1%
What is the probability that neither test is positive if the athlete has used steroids?
0.02
Flossie, the chimpanzee…Assuming Flossie sticks
A, B, P, AA, AB, AP, BA, BB, BP, PB, PP
does the 90% confidence interval provide convincing evidence that less than half of U.S. adults could name all three branches of the government?
Yes. All of the plausible values in the interval are less that 0.5, which provides…
last decile?
1.28
Which of the following characteristics of the data is not made easier?
The number of values in the dataset
Long words can make a book hard to read. What percent of words…
16%

mark claims that when given the choice, 60% of teenagers will choose….
null: p = 0.60
a: p does not equal 0.60
p is proportion

TSA…does this result provide convincing evidence that the TSA officers did not carry out a truly random selection?
No, there is not convincing evidence…If the selection is truly random…
Suppose Martin is a very talented used-car salesman. Mean and variance.
mean = 27.50 variance = 13.75
gallup poll found that only 28% of American adults…this means that…
the poll used a method that gets an answer within #% of the truth about the population 95% of the time
Note that high scores indicate good study habits and attitudes towards learning
The IQR of the distribution of SSHA scores for men is 45 and the IQR for of the distribution of SSHA scores for women is 28 studeA
A study in Switzerland examined the number of cesarean sections…based on the computer output, which
The distribution of female doctors is more symmetric because the mean and median are closer together than the mean and media of the distribution of male doctors.
A sample of 30 students at the local college…What is the mean test score?
5.3
Beans and other legumes


Nielsen Mobile, “Teenagers ages 13 to 17 are by far…”
mew, mean number, all

You and a group of friends … what is the probability
22.38haW
What percent of djokovic’s first serves are slower than 100 mph?
0.82%hT
pictograph
the area of the pictures should be proportional to the number of the students they represent
do the data suggest the critics claim, that supermarkets tend to put
Yes! where kids are most likely to see them second shelf eye level
dog cat Venn diagram

suppose the prevalence of a certain type of tree allergy is 0.17
0.1057
Find the probability that the person is a graduate student
0.383
What is the percentile for the shopper who spent $19.50?
The 26th percentile
which of the following choices correctly describes the information presented in the graph?
The most popular color of vehicles sold that year was white, followed by black, silver, and gray
Jim vehicle
truck, rv, tractor
In 2016, taxicabs
mean= 4.667 miles, standard deviation = 3.778 miles
suppose a high school gymnasium . Probability
0.14
A drug manufacturer forms tables by compressing
The test statistics is t = 0.77 and the P-value is 0.2247
Find the probability that eh young adult completed high school
0.87
what is the probability that ta household owns a dog or a cat?
0.54
Cobb, williams, and brett
all three players were at least standard deviations but Williams was the highest
Proportion of bean variaties
0.233
Choose an American household at random
The number of cars would typically be about 1.08 from the mean
What percent of respondents feel their weight is just right
71.25%
What is the event at least $20 is collected
The event is y greater than or equal to 20
What percent of djokovics first serves are faster than 120 mph
5.48%
Geometric distribution probability of success 0.16
What sit eh probability the person reads la times or washington
0.6
85th percenti
117.2 mph
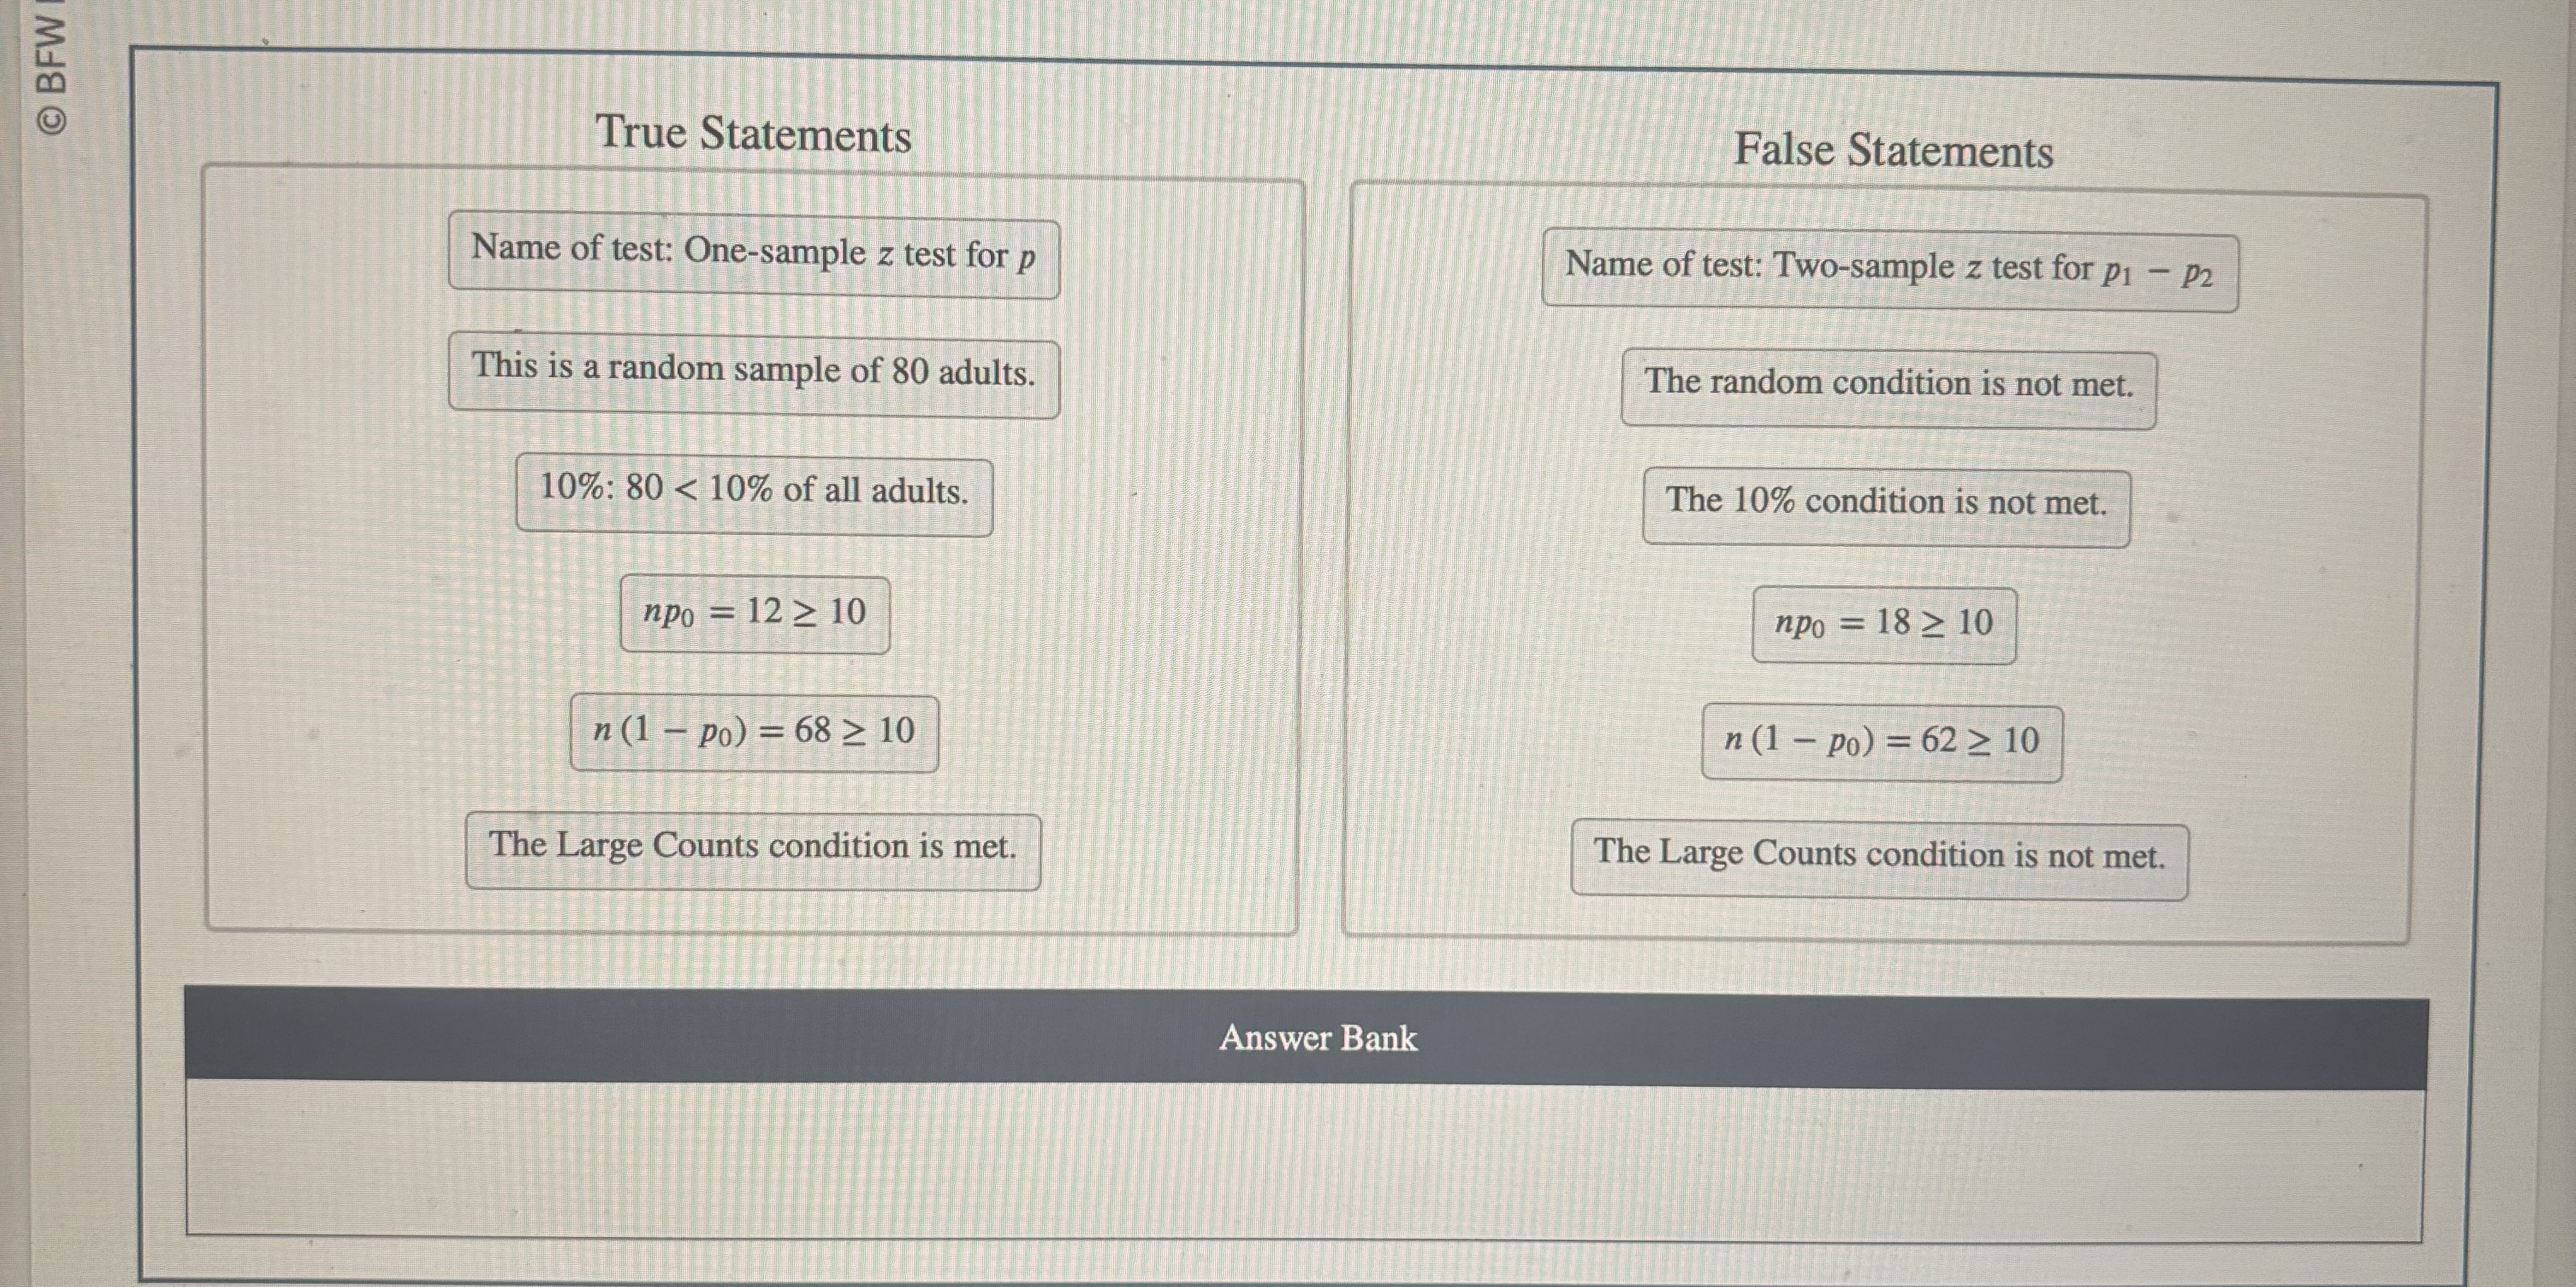
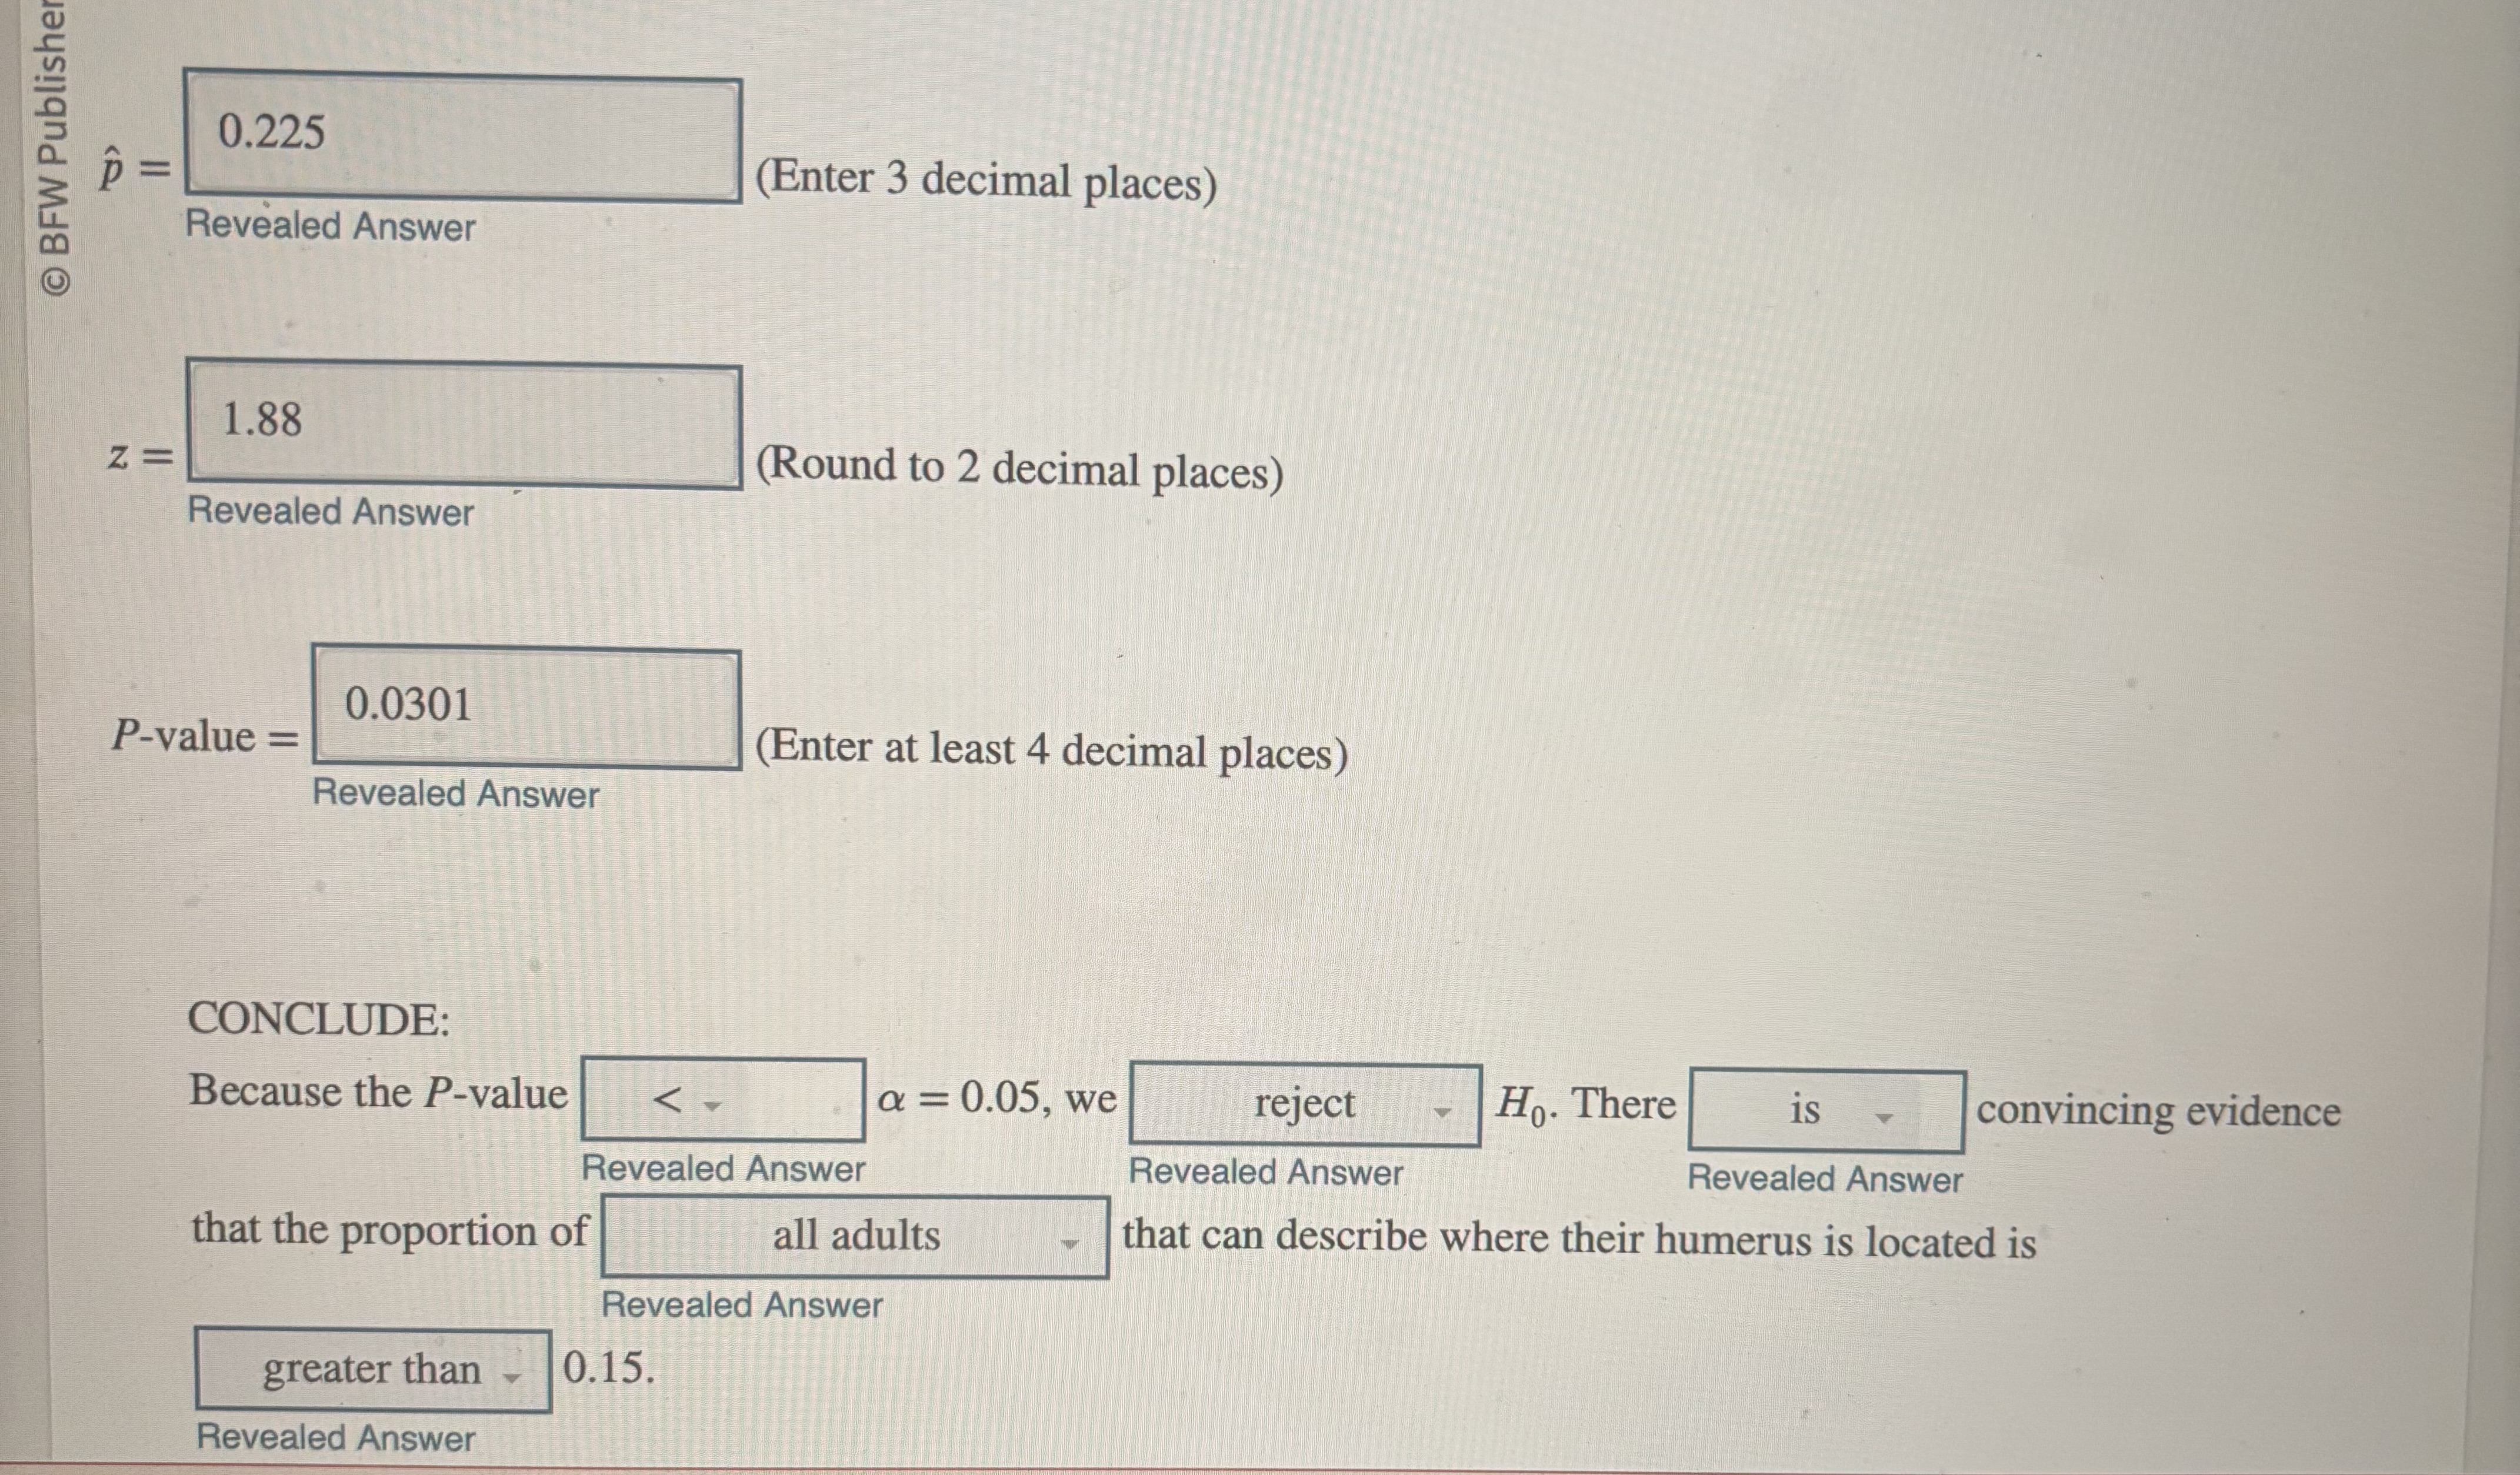
Susan believes that 15% of adults can point out where the humerus bone is located
p = 0.15
p does not equal 0.15
p is proportion
What percent of easy sudoku puzzles take ms starnes
21.7%
What percent of large lids are too small to fit
6.70%
What is the maximum number of calories per serving (yellow histogram)
Cannot be identified
Which histogram corresponds to the cumulative relative frequency graph
Wild caught salmon
Distribution of test scores for ms baddies first grade class
No outliers, right skewed
Not an underage business student
0.8
Downloads music and doesn’t care
.1943