Maxwell-Boltzmann Distribution
1/11
There's no tags or description
Looks like no tags are added yet.
Name | Mastery | Learn | Test | Matching | Spaced | Call with Kai |
|---|
No analytics yet
Send a link to your students to track their progress
12 Terms
What is a Maxwell-Boltzmann distribution curve?
A graph that shows the distribution of kinetic energies of particles in a sample (usually a gas) at a constant temperature.
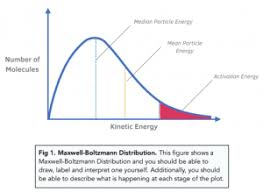
What do the x-axis and y-axis represent on a Maxwell-Boltzmann distribution curve?
X-axis: Kinetic energy (or 'Energy', E)
Y-axis: Number of particles (or 'Proportion of molecules')

What does the total area under the curve represent?
The total number of particles in the sample.

Why does the Maxwell-Boltzmann distribution curve start at the origin (0,0)?
Because no particles have zero kinetic energy (as all particles are in motion, unless at absolute zero).

What is the activation energy (Ea) and how is it shown on the curve?
Ea is the minimum energy required for a collision to result in a reaction.
It is shown as a vertical line on the x-axis.
The area to the right of this line shows the number of particles with E ≥ Ea.

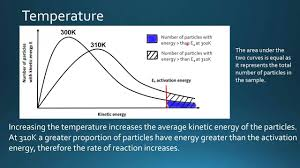
Draw a diagram showing how the curve changes when temperature is increased from T1 to T2
The T1 curve is lower and broader.
The T2 peak is shifted to the right.
Both curves start at (0,0).
The total area under both curves is the same.

Explain why increasing temperature increases the rate of reaction, using the Maxwell-Boltzmann distribution.
Increasing temperature shifts the curve to the right, so particles have more kinetic energy on average.
The activation energy (Ea) does not change.
The area under the curve to the right of Ea is much larger at the higher temperature.
This means a greater proportion of particles have energy ≥ Ea, so the frequency of successful collisions increases.
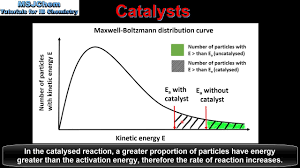
Draw a diagram showing the effect of a catalyst on a Maxwell-Boltzmann distribution curve.
The curve itself does not change.
The catalyst provides a lower activation energy (Ea(cat)).
A new line for (Ea(cat)) is drawn to the left of the original (Ea).
Explain why a catalyst increases the rate of reaction, using the Maxwell-Boltzmann distribution.
The catalyst provides an alternative reaction pathway with a lower activation energy (Ea(cat)).
The distribution curve does not change.
The area under the curve to the right of Ea(cat) is larger than the area to the right of the original Ea(cat).
This means a greater proportion of particles have sufficient energy to react, increasing the frequency of successful collisions.
(1 mark) What does the peak of the Maxwell-Boltzmann distribution curve represent?
The most probable energy (Emp) of the particles. (1)

(2 marks) A Maxwell-Boltzmann distribution curve is shown.
(a) Label the y-axis. (1 mark) (b) Label the x-axis. (1 mark)
(a) y-axis: Number of particles (or 'Proportion of molecules' / 'Frequency') (1)
(b) x-axis: Kinetic energy (or 'Energy') (1)
(3 marks)
Draw a Maxwell-Boltzmann distribution curve.
On your diagram:
Label the activation energy (Ea).
Shade the area that represents the number of particles with sufficient energy to react.
Correctly shaped curve starting at (0,0) and approaching the x-axis asymptotically. (1)
A vertical line correctly labelled Ea (1)
The area under the curve to the right of the Ea line is shaded. (1)
