Required reading knowledge from Devon
1/19
There's no tags or description
Looks like no tags are added yet.
Name | Mastery | Learn | Test | Matching | Spaced | Call with Kai |
|---|
No analytics yet
Send a link to your students to track their progress
20 Terms
Abhijit V. Banerjee and Esther Duflo. 2007. “The Economic Lives of the Poor”. Journal
of Economic Perspectives 21 (1): 141–167
Very limited formal insurance: Fewer than 6% of the extremely poor (except in Mexico) have health insurance. Informal networks (family, caste, neighbors) provide some risk-sharing but are weak and poorly diversified. Shocks often lead to borrowing, eating less, pulling children from school, or avoiding medical care.
Government support is inadequate: Public health care is often low quality, with high absenteeism and informal fees. Safety-net programs (e.g., food-for-work) exist but are limited and sometimes poorly targeted.
Land insecurity reduces productivity: Poor land titles and weak property rights discourage investment and efficient land use. Political power influences land security. Tenancy reforms that strengthen farmers’ rights significantly raise productivity.
Infrastructure is uneven and low quality: Access to electricity, water, sanitation, schools, and health services varies widely. Even where services exist, quality is poor (high teacher/health worker absenteeism, low competence). Infant mortality and malnutrition remain high.
Private providers fill gaps: The poor often use private schools and health care due to public system failures, though private providers are often less qualified.
Multiple occupations & small businesses: The poor diversify jobs to spread risk and fill seasonal downtime. Many become small-scale entrepreneurs because they lack access to capital and formal jobs—not out of choice but necessity.
Underinvestment despite high returns: Poor farmers underuse profitable inputs (e.g., fertilizer) due to saving difficulties and self-control problems. Commitment devices (like pre-purchase vouchers) increase investment.
Low savings despite strong need: Though precautionary motives should be high, saving is hard due to temptation, insecurity, social pressures, and lack of safe financial tools.
Limited migration: The poor migrate temporarily but avoid long-term migration, partly due to reliance on social networks for insurance and the psychological cost of pursuing higher income.
Overall insight:
The economic behavior of the poor—limited specialization, small enterprises, low investment, low savings—largely reflects constrained access to credit, insurance, secure property rights, and quality public services, combined with behavioral and social constraints.
*Abhijit V. Banerjee and Esther Duflo. 2003. “Inequality and Growth: What can the data
say?” Journal of Economic Growth 8:267–299
They test whether inequality affects economic growth using cross-country panel data and show that the standard assumption of a linear relationship is wrong. Instead, the data reveal a nonlinear, inverted-U relationship between changes in inequality and growth: both increases and decreases in inequality are associated with lower short-run growth (over 5-year periods). This implies that earlier findings (using fixed effects or GMM) showing that inequality raises growth are likely driven by misspecification and imposed linearity, not true causal effects. Their main conclusion is that macro cross-country data cannot credibly establish whether inequality is good or bad for growth, and stronger answers must come from micro-level evidence.
Capital in the Twenty First Century
Theodore W. Schultz. 1980. “Nobel Lecture: The Economics of Being Poor”. Journal of
Political Economy 88 (4): 639–651.
Schultz argues that poor people are rational and responsive to incentives, and standard economic theory fully applies to low-income countries. Poverty is not primarily due to fixed land constraints (contra Ricardo/Malthus), but to underinvestment in human capital—education, health, skills, and research. Agricultural productivity can grow substantially through improved knowledge and incentives, and farmers are efficient entrepreneurs when not distorted by government policies. The key to development is improving population quality (human capital), which raises productivity, reduces fertility (quality–quantity tradeoff), and drives long-run growth. The main obstacle is not nature, but bad politics and anti-agriculture policies.
Azariadis, Costas and Stachurski, John, 2005. “Poverty Traps” in:
Philippe Aghion and Steven Durlauf (ed.), Handbook of Economic
Growth, edition 1, volume 1, chapter 5 Elsevier. Sections 1 and 2 only
The reading argues that technology drives income differences but adoption is often blocked by self-reinforcing traps stemming from market and institutional failures. Institutions and economic interactions are endogenous, meaning poor governance or coordination problems can perpetuate poverty even when good technologies exist. While neoclassical models assume markets converge to efficient outcomes, real economies face frictions, increasing returns and externalities that can create multiple equilibria. Policies like a “big push” or coordinated investment may be required to escape low-income traps and achieve development.
Strauss, John and Duncan Thomas, 1995. “Human Resources:
Empirical Modeling of Household and Family Decisions”
The reading reviews empirical evidence on how nutrition, health and income interact. It finds mixed results on how income affects nutrient demand—calorie consumption rises with income at low levels but often plateaus once basic needs are met, implying households spend additional income on diet quality rather than calories. elasticities ranged from 0.01 to 1.18n in findings. Measurement issues, endogeneity and methodological differences explain variation in estimates across studies. Evidence also suggests better health and nutrition can raise productivity and wages, particularly for physically demanding work, though results vary by context and identification strategy. Overall, while strong causal claims are difficult, there is support for some feedback between health and economic outcomes, reinforcing the possibility of poverty traps where low income and poor health sustain one another.
Behrman, Jere R., and Anil B. Deolalikar. “Will Developing Country Nutrition Improve with Income? A Case Study for Rural South India.”
Indirect (aggregated) approach → Implied high calorie elasticity: 0.77–1.18 (derived from strong food category expenditure elasticities of 0.54–3.27, as seen in Table 2 for items like milk at up to 3.27).
This was the conventional method in earlier studies: Aggregate foods into broad groups, estimate expenditure elasticities for those groups, then apply average calorie content per rupee spent in the group.
Result: Suggested nutrition (calories) would rise roughly one-for-one (or close) with income growth, implying economic development would naturally reduce malnutrition quickly.
Direct (disaggregated) approach → Much lower calorie elasticity: 0.17–0.37 (from Table 2's nutrient rows, levels and first-differences).
Uses finer data (120 food groups vs. 6 categories) to track shifts in actual consumption items and their calorie contributions.
Captures reality: As incomes rise, households upgrade within/across categories (e.g., better rice varieties, more processed foods, variety-seeking like spices/condiments, or status foods) → pay more per calorie without proportionally more calories.
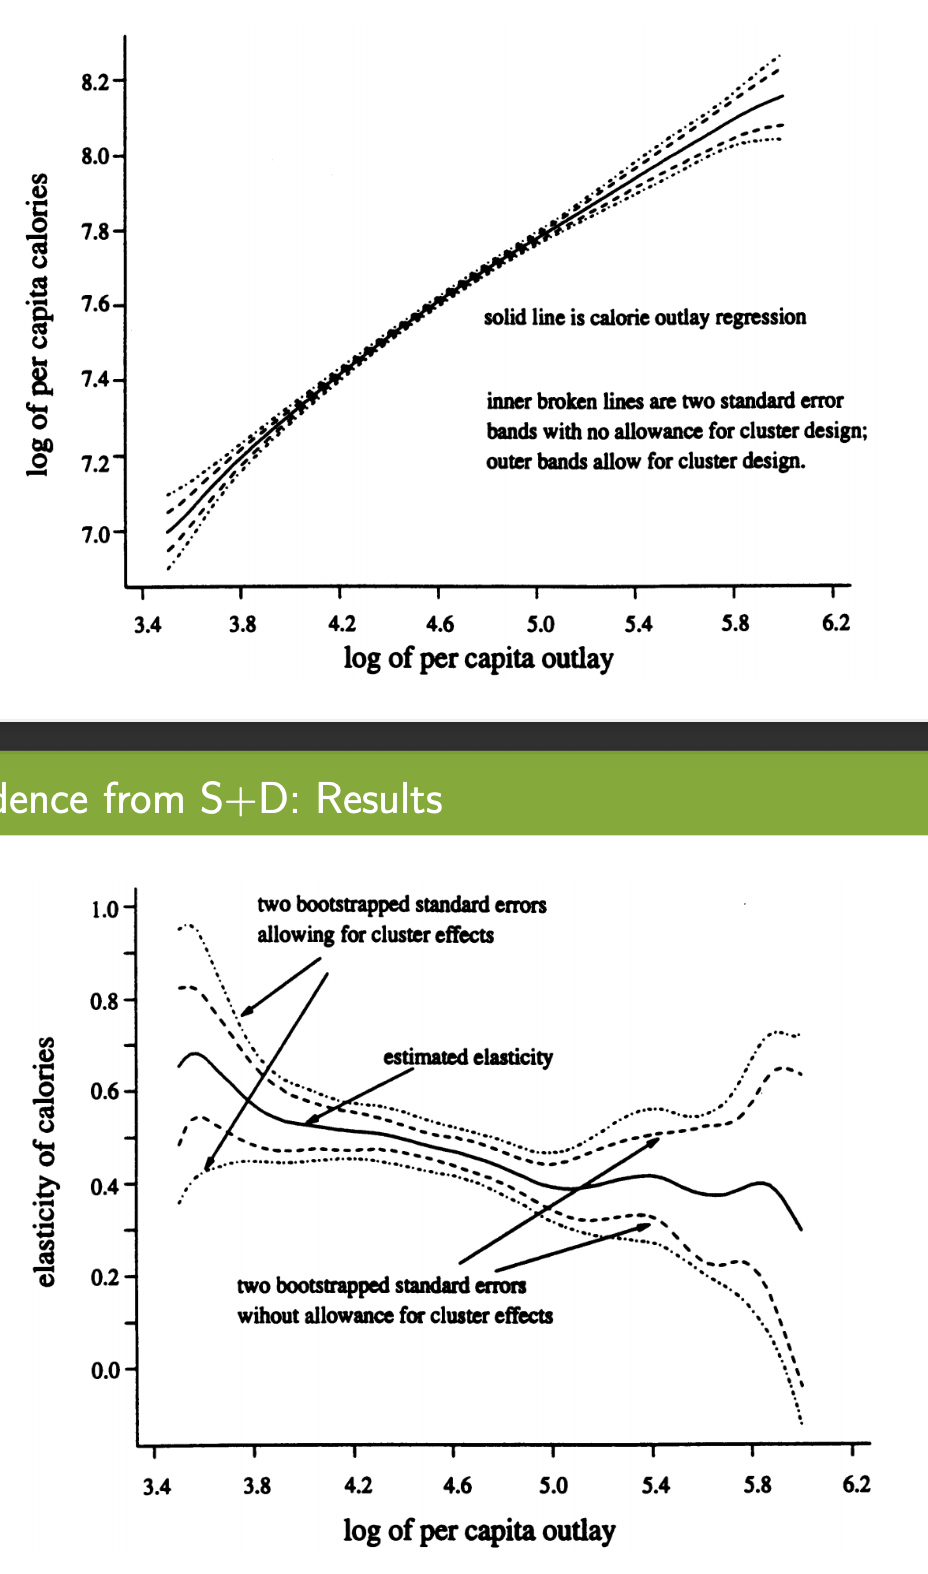
Subramanian and Deaton (1996) response to and extension of B+D
Calories increase with expenditure, but the relationship is concave (curving downward), meaning the poor get a bigger calorie boost from extra income than the rich. The widening bands at the edges reflect fewer observations and more uncertainty. Second graph reinforces the top graph – the income-calorie link is stronger for the poorest (elasticity ~0.5+ at low end) but weakens as households get richer (nearing zero).
Dasgupta, Partha, and Debraj Ray, 1986. “Inequality as a Determinant
of Malnutrition and Unemployment: Theory”
The paper by Partha Dasgupta and Debraj Ray argues that malnutrition and unemployment can arise endogenouslyin competitive economies because nutrition affects productivity. Low income → poor nutrition → reduced work capacity → lower wages → continued poverty, creating a potential poverty trap. Unlike traditional models, unemployment is not due to wage rigidities but to productivity differences linked to health and asset inequality. The economy can fall into different regimes: widespread malnutrition, malnutrition plus involuntary unemployment, or full employment when assets are sufficient. Policies like nutrition support or redistribution may be needed to break traps. The idea builds on insights similar to those of Alfred Marshall about the productivity effects of wages and human capability.
Aart Kraay and David McKenzie. 2014. “Do Poverty Traps Exist? Assessing the
Evidence”. Journal of Economic Perspectives 28:127–148
Kraay and McKenzie's analysis suggests that traditional poverty traps are rare and predominantly found in remote or disadvantaged areas. ResearchGate
A review of the reduced-form empirical evidence suggests that truly stagnant incomes of the sort predicted by standard models of poverty traps are in fact quite rare, and the empirical evidence regarding several canonical mechanisms is mixed.
Mechanism | Evidence verdict |
|---|---|
S-shaped savings / macro traps | Weak — stagnant incomes are rare |
Big Push / coordination failures | Not convincingly supported |
Nutritional traps | Mixed / insufficient |
Occupational traps (microenterprises) | Mixed |
Behavioural traps | Emerging evidence, inconclusive |
Geographic traps | Strongest empirical support |
"Returns to Capital in Microenterprises: Evidence from a Field Experiment"
de Mel, McKenzie & Woodruff (QJE, 2008)
Experimental Design
The authors use a randomized experiment to identify the effect of incremental cash investments on the profitability of all enterprises, regardless of whether they choose to apply for credit at market interest rates. They accomplish this by surveying microenterprises in Sri Lanka and providing small grants to a randomly selected subset of sampled firms, restricted to those with less than 100,000 Sri Lankan rupees (about US$1,000) in capital. Grants were either 10,000 LKR (about US$100) or 20,000 LKR (about US$200). Oxford Academic
Eight additional waves of the panel survey were conducted at quarterly intervals, from April 2005 through April 2007, across three southern and southwestern districts of Sri Lanka.
Key Findings
Returns are very high: The average real return to capital is 4.6–5.3 percent per month (55–63 percent per year), substantially higher than market interest rates. IDEAS/RePEc This is a crucial finding — it suggests capital-constrained microentrepreneurs are not investing enough, and are well above the threshold where microfinance loans would be profitable.
Heterogeneity matters: Returns vary with entrepreneurial ability and with household wealth, but not with measures of risk aversion or uncertainty. World Bank This supports the view that credit market imperfections (rather than risk/insurance market failures) are the main constraint.
A stark gender gap: Treatment impacts are significantly larger for enterprises owned by males; indeed, there is no positive return in enterprises owned by females. World Bank This is one of the most discussed findings — female-owned enterprises do not appear to benefit from capital injections in the same way, possibly because women have less control over household finances and injected capital may be diverted.
Implications
The paper speaks directly to the poverty trap debate from the first reading. If returns are high at low capital levels, there is no S-shaped production function and no minimum threshold below which investment is pointless. Entrepreneurs are constrained by lack of credit, not by fundamental non-convexities. This supports expanding credit access — but the gender finding complicates simple policy prescriptions.
"The Diffusion of Microfinance"
Banerjee, Chandrasekhar, Duflo & Jackson (Science, 2013)
Research Question
How do the network positions of the first individuals in a society to receive information about a new product affect its eventual diffusion?
Key Findings
Participants spread information far more than non-participants: Participants are seven times as likely to pass information compared to informed non-participants, but information passed by non-participants still accounts for roughly one-third of eventual participation.
It's mostly about information, not endorsement: Once information passing is accounted for, an informed household's decision to participate is not significantly dependent on how many of its neighbours have participated. Ox This is a striking result — peer pressure to join plays a limited role once you know about the product.
Network centrality of the injection point matters enormously: Microfinance participation is significantly higher when the injection points have higher eigenvector centrality. Ox In other words, who you tell first determines how far information ultimately travels.
A new measure — diffusion centrality: Communication centrality substantially outperforms other standard network measures in predicting microfinance participation. The simpler proxy measure — diffusion centrality — is strongly correlated with communication centrality and inherits its predictive properties.
Policy Implications
The paper has direct practical implications for how development programmes should be rolled out. Rather than simply entering a village and advertising, organisations should carefully select their initial contacts based on network position. Choosing a highly central individual — someone connected to many others who are themselves well-connected — can dramatically increase eventual programme take-up at no extra cost.
1. Ghatak, Maitreesh, and Timothy W. Guinnane (1999). “The Economics of Lending With Joint Liability.” Journal of Development Economics 60: 195-228.
Theoretical paper explaining why joint liability (group lending with collective responsibility) works well for lending to the poor.
Addresses key problems in traditional lending: adverse selection (hard to identify safe vs. risky borrowers), moral hazard (hidden effort), costly monitoring, and weak enforcement.
Joint liability leverages local information and social ties among borrowers:
Encourages peer screening — safe borrowers self-select into groups with other safe borrowers (positive assortative matching).
Promotes peer monitoring and peer pressure to ensure effort and repayment.
Reduces the lender’s need for costly audits or legal enforcement.
Cull, Robert, Asli Demirgüç-Kunt, and Jonathan Morduch (2009). “Microfinance Meets the Market”
Examines the tension between the social mission of microfinance institutions (MFIs) — serving the poorest, especially women — and the push for commercial viability and profitability.
Uses a large dataset of 346 leading MFIs serving nearly 18 million borrowers.
Key findings:
MFIs achieve very high repayment rates, proving poor borrowers can be creditworthy with appropriate mechanisms (group lending, frequent repayments, dynamic incentives).
Serving the poorest clients and women involves higher operating costs (small loans, intensive methods) and higher fees; these MFIs are often less profitable.
Evidence of a trade-off: more commercial MFIs reach more clients and are financially sustainable but may experience “mission drift” by shifting away from the very poor.
Discusses opportunities (cost-reducing innovations, targeted subsidies) and challenges as microfinance attracts private capital and “meets the market.”
Concludes that microfinance delivers reliable services to the poor but needs further innovation to balance outreach and sustainability.
Banerjee, Abhijit V., Esther Duflo, Rachel Glennerster, and Cynthia Kinnan (2015). “The Miracle of Microfinance? Evidence from a Randomised Evaluation”
Landmark randomized controlled trial (RCT) of a standard group-lending microcredit program (Spandana) in 104 Hyderabad slums (52 treatment, 52 control).
Short-run results (15–18 months after rollout):
Increased microcredit take-up by ~8–9 percentage points.
Boosted investment in small businesses (more spending on business assets; some households started new businesses, often multiple).
No significant increase in average household consumption or income.
Shifted spending: higher on durable goods, lower on “temptation goods” (e.g., alcohol, tobacco).
Longer-run results (~3–3.5 years): differences largely disappeared as control areas gained access; treatment households had borrowed longer/larger amounts, with some gains in business profits at the upper tail but not on average.
No significant impacts on health, education, or women’s empowerment/decision-making.
Conclusion: Microcredit is not the transformative “miracle” claimed by some proponents. It helps some households expand businesses and reallocate resources but does not deliver broad poverty reduction or social transformation (at least in the medium term). Results align with other contemporaneous RCTs.
Cole, Shawn, Wentao Xiong, and W. Xiong (2017). “Agricultural Insurance and Economic Development.” Annual Review of Economics 9: 235–262.
review of the state of agricultural (mostly index-based) insurance in developing countries.
Highlights that smallholder farmers face high weather and production risk, yet demand for insurance remains persistently low despite subsidies, product innovation, and marketing efforts.
Discusses major challenges: basis risk, low trust, liquidity/timing constraints for paying premiums, and behavioral factors.
Summarizes evidence on impacts: insurance can increase investment, improve technology adoption, and smooth consumption, but results are mixed and often modest in practice.
Emphasizes the potential role of agricultural insurance in economic development, while stressing the need for better product design, delivery, and complementary interventions (e.g., addressing credit constraints).
Townsend, Robert M. (1995). “Consumption Insurance: An Evaluation of Risk-Bearing Systems in Low-Income Economies.” Journal of Economic Perspectives 9, no. 3: 83–102
evaluating how well risk-sharing and consumption smoothing work in poor economies.
Tests the full risk-sharing hypothesis: in theory, if households fully insure each other, individual consumption should depend only on aggregate (village) shocks, not on idiosyncratic (individual) income shocks.
Reviews evidence from villages in India, Thailand, and elsewhere (including his own earlier work).
Finds partial but substantial consumption insurance in many low-income settings through informal mechanisms (family, friends, village networks, gifts, loans).
However, insurance is incomplete: consumption still responds somewhat to own income shocks, especially in the long run or with large shocks.
Discusses strengths and limitations of informal vs. formal risk-bearing systems and policy implications for financial development.
Karlan, Dean, Robert Osei, Isaac Osei-Akoto, and Christopher Udry (2014). “Agricultural Decisions after Relaxing Credit and Risk Constraints.” Quarterly Journal of Economics 129, no. 2: 597–652. (The link provided points to this well-known RCT paper.)
Landmark randomized controlled trial in northern Ghana with ~500 farmers using a cross-randomized design (cash grants × rainfall index insurance).
Key finding: Providing insurance (free or subsidized) had a much larger effect on agricultural investment (more land cultivated, higher spending on inputs/chemicals) than providing cash grants alone.
Cash grants had only small or modest effects on investment and output.
Insurance relaxes the risk constraint, encouraging farmers to take more productive risks because they are protected against bad outcomes (e.g., drought).
Supports the idea that uninsured risk, rather than pure credit/liquidity constraints, is often the binding barrier to investment for smallholder farmers.
Breza, E., S. Kaur, and Y. Shamdasani (2021). Labor rationing. American Economic Review, 111 (10): 3184-3224.
core question: Do rural labor markets in developing countries have excess labor supply (rationing), or do low employment rates simply reflect workers' voluntary choices?
Conducted in 60 villages in rural Odisha, India (2014–2018). Researchers created hiring shocks by employing on average 24% of the male labor force in external manufacturing jobs for 2–4 weeks, then observed how the remaining local labor market responded. Crucially, this was done across different months to compare lean vs. semi-peak seasons.
Key Predictions
Under no rationing, a supply shock (removing workers) should raise wages and reduce aggregate employment. Under rationing, it should do the opposite — wages and aggregate employment stay flat, but individual remaining workers find jobs more easily (positive e,ployment spillovers)
Main Results
Lean season (below-median employment months) — consistent with severe rationing:
Wages: no change (wage rigidity holds)
Aggregate employment: no change
Individual spillovers: remaining workers' employment rose by 5.4 percentage points (38% increase)
Semi-peak season (above-median employment) — consistent with a functioning market:
Wages rose by 5.0% almost instantaneously
Aggregate employment fell 22%
Each external job created crowded out 0.28 days of private employment
Nominal Wage Rigidity in Village Labor Markets – Kaur (2019)
Core Question
Do wages in rural Indian labor markets adjust symmetrically to shocks, or is there downward nominal rigidity? And if so, does this actually distort employment?
suggestion:
Rural wages are downwardly rigid (don’t fall easily), leading to labor rationing and unemployment.
Positive shock → wages ↑ ~4–5%
Negative shock → wages don’t fall (rigidity)
Past positive shocks keep wages high (ratcheting, +3.7%)
Inflation (>6%) allows real wage adjustment without nominal cuts
👉 Wages adjust upward easily, downward poorly
Positive shock → employment ↑ ~8%
Negative shock → employment ↓ ~5%
After a positive shock (with high wages) → employment ↓ ~9%
👉 Rigid high wages reduce future employment
why?
Majority think wage cuts are unfair
Workers reduce effort if paid less
Inflation cuts are accepted (money illusion)
conslusion:
Nominal wage rigidity causes labor rationing:
Wages stay too high in bad times
Not enough jobs → unemployment/disguised unemployment