2.2 Creating Frequency Distribution Theory
1/18
There's no tags or description
Looks like no tags are added yet.
Name | Mastery | Learn | Test | Matching | Spaced | Call with Kai |
|---|
No analytics yet
Send a link to your students to track their progress
19 Terms
What is a frequency distribution?
(1) a list of values with corresponding frequencies
What are the 2 simple components of a frequency distribution table?
(1) classes (just groups)
(2) frequencies (just counts or tallies)
What are classes?
(1) just groups, ranges
What are frequencies?
(1) counts, tallies
(2) how something occurs frequently
What is a class width?
(1) the difference between two lower class limits
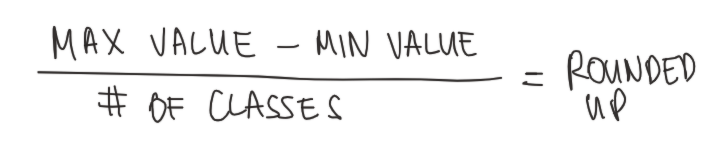
How do you solve for the class width?
What is the lower class limit?
(1) where the class starts, where the bound begins
(2) the smallest value belonging to a class
(3) the “left” value
What is the upper class limit?
(1) where the class ends, where the bound begins
(2) the largest value belonging to a class
(3) the “right” value
Steps to Setting Up a Frequency Distribution
Step 1: Determine number of classes
Step 2: Class width (rounded upwards)
Step 3: Make a table for the classes then frequencies
Step 3.1: Lower class limits — determine the lower class limits by beginning with the lowest value and adding by the class width
Step 3.2: Upper class limits — determine the upper class limits by subtracting 1 less from the consecutive lower class limit to figure out the “class range”
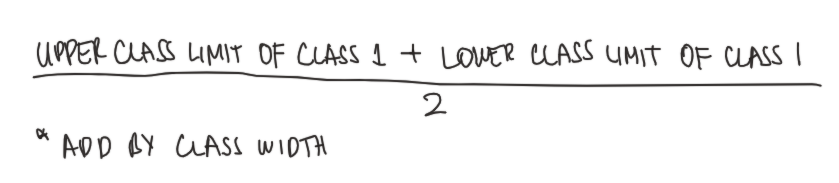
Step 4: Class midpoint — find the average of upper class limit and lower class limit, consequently figure out the succeeding values by adding the class width
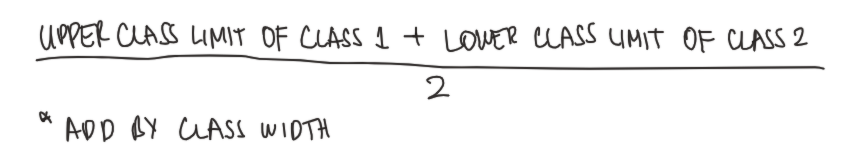
Step 5: Class boundaries — the “midpoint” between one class to the next (usually involves a 0.5), the average of the upper class limit of the previous class and the lower class limit of the succeeding class. Don’t forget the class boundaries at the edges of the entire range (lowest value, subtract 0.5; highest value, add 0.5). For faster work, figure out the succeeding values by adding the class width
Step 6: Frequencies (count)
Formula for Class Midpoint
Formula for Class Boundary
What is relative frequency distribution?
(1) compares the frequency of each class to the total number of data items you collected written as a percentage
Steps to Setting Up Relative Frequency Distribution
Step 1: Total frequency count, simply by adding all your frequencies
Step 2: Relative frequency percentage
Step 3: Create new column and fill out relative frequency
Relative Frequency Percentage Formula

What is cumulative frequency distribution?
(1) adding sequential classes together
(2) its like updating the balance every account as the table goes down
Steps to Finding the Cumulative Frequency Distribution
Step 1: Create new column: cumulative frequency distribution
Step 2: As you go down each row, add up everything before; like updating the balance each account
What does it mean when distribution is normal?
(1) when data rises to a peak and then falls down
What is a histogram?
(1) a touching bar chart
Steps to Creating a Histogram
Step 1: Create L-Chart
Horizontal Axis: Classes
Vertical Axis: Frequency
Step 2: Work on horizontal axis
(1) Determine whether to use midpoints or boundaries, and plot equidistant points
Boundaries
Marks land on edges of each data, begins on the y-axis
Midpoints
Marks land at the center of each data, begins after the y-axis
(2) Work faster by simply adding the class width after every each mark
Step 3: Work on vertical axis
(1) Determine whether to use frequencies, relative frequencies, or cumulative frequencies
Frequencies
Plot the range of frequencies from lowest at the bottom to highest
Relative Frequencies
Plot the range (in percentage) of relative frequencies from lowest to highest
Cumulative Frequencies
Plot the range of cumulative frequencies from lowest to highest