Lectures 7+8
1/56
There's no tags or description
Looks like no tags are added yet.
Name | Mastery | Learn | Test | Matching | Spaced | Call with Kai |
|---|
No analytics yet
Send a link to your students to track their progress
57 Terms
Initiation of cardiac cycle
Begins with spontaneous action potential from SA node
Cardiac cycle duration
Length of one heartbeat calculated as 60 divided by heart rate
Atrial contraction role
Contributes 10–20% of ventricular filling with most filling passive
Inflow phase
AV valves open and semilunar valves closed allowing ventricular filling
Isovolumetric contraction
All valves closed with increasing ventricular pressure and no volume change
Outflow phase
Semilunar valves open and blood is ejected from ventricles
Isovolumetric relaxation
All valves closed with decreasing pressure and constant volume
Phase 1 atrial systole
Atria contract increasing ventricular volume and pressure slightly, initiated by p wave, av open, sl closed, venous a wave
Phase 2 isovolumetric contraction
Ventricles contract with all valves closed and rapid pressure rise, exceeds atria, when LV > aortic pressure, aortic valve opens, venous c wave
Phase 3 rapid ejection
Semilunar valves open and blood rapidly exits ventricles, aortic pressure inc → max, t-wave begins/atria fills
Phase 4 reduced ejection
Decreasing ventricular contraction leads to reduced blood ejection, pressure in vent+ exits dec., venous return continues
Phase 5 isovolumetric relaxation
All valves closed and pressure falls with no volume change, venous v wave when atria full
Phase 6 rapid filling
AV valves open and ventricles fill quickly due to pressure gradient
Phase 7 reduced filling (diastasis)
Slow filling as pressure gradient decreases, 90% filled by end, aortic/pulmonary pressures still falling
ECG relationship to cycle
P wave → atrial contraction QRS → ventricular contraction T wave → ventricular relaxation
End diastolic volume (EDV)
Maximum ventricular volume at end of filling
End systolic volume (ESV)
Volume remaining after ventricular contraction
Stroke volume (SV)
Volume ejected per beat calculated as EDV minus ESV
Atrial A wave
Measured in jugular vein, atrial systole, blood regurgitate into veins when atria contract, causing increase in pressure
Atrial C wave
Measured in jugular vein, bulging of tricuspid valve (just closed) backward into the right atrium during isovolumetric ventricular contraction
Atrial V wave
Measured in jugular vein, mirrors rise in atrial pressure before the tricuspid valve opens during systole
Pressure volume loop
Graph of ventricular pressure versus volume during cardiac cycle
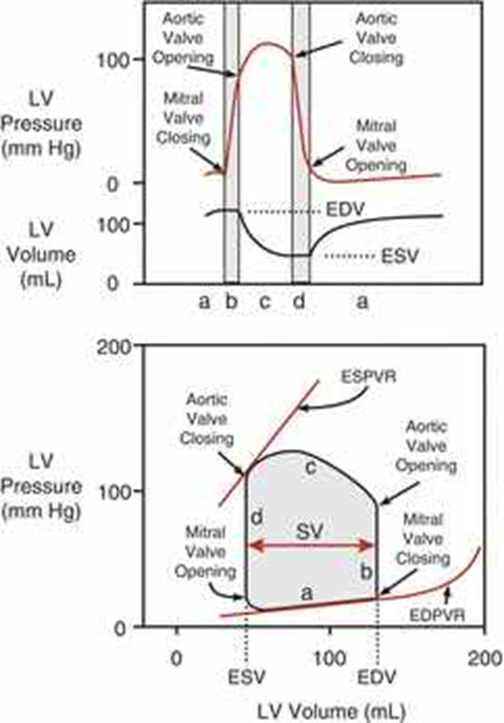
Width of PV loop
Represents stroke volume (sv= edv-esv)
Dicrotic notch
Brief increase in aortic pressure after semilunar valve closure
Heart sound 1/lub (S1)
Isovolumetric contraction, closure of mitral and tricuspid valves
Heart sound 2/dub (S2)
Isovolumetric relaxation, closure of aortic and pulmonary valves
S3 Heart Sound
Early ventricular filling, nromal in children and young adults associated with ventricular dilation
S4 Heart Sound
Atrial contraction, associated with stiff, low compliant ventricle (hypertrophy, ischemia)
Cardiac output (CO)
Volume of blood pumped by the heart per minute
Cardiac output equation
CO = heart rate X stroke volume
Normal cardiac output
Approximately 5 liters per minute in a resting adult
Venous return (VR)
Volume of blood returning to the heart per minute, should equal cardiac output
Mean arterial pressure
Diastolic pressure - 1/3 pulse pressure OR cardiac output x systemic vascular resistance
Systemic vascular resistance (SVR)
Resistance to blood flow in systemic circulation influencing afterload, increase SVR= increase MAP
Determinants of cardiac output
Heart rate, stroke volume, contractility, preload and afterload, = total volume of blood ejected form left ventricle per minute, = HR x SV, changes to meet body’s need for O2/nutrients
Heart rate effect on CO
Increased heart rate increases cardiac output, established by SA node
Contractility (inotropy)/effect on CO
Force of contraction at a given preload affecting stroke volume, direct relationship with ventricular output/CO, increased contractility increases cardiac output
Afterload/effect on CO
Resistance the heart must overcome to eject blood inversely related to output/ increased afterload decreases cardiac output
Preload/effect on CO
Initial stretching of cardiac muscle related to EDV, increased preload increases cardiac output via Frank Starling mechanism
Frank Starling law
Stroke volume increases with increased ventricular filling (EDV)
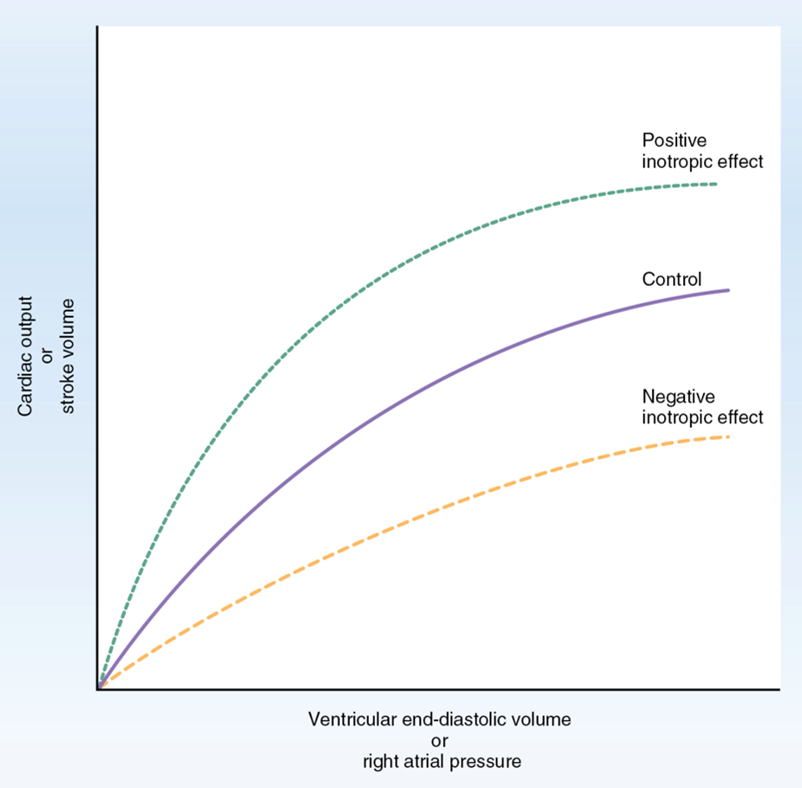
Length tension relationship
Greater fiber stretch leads to stronger contraction
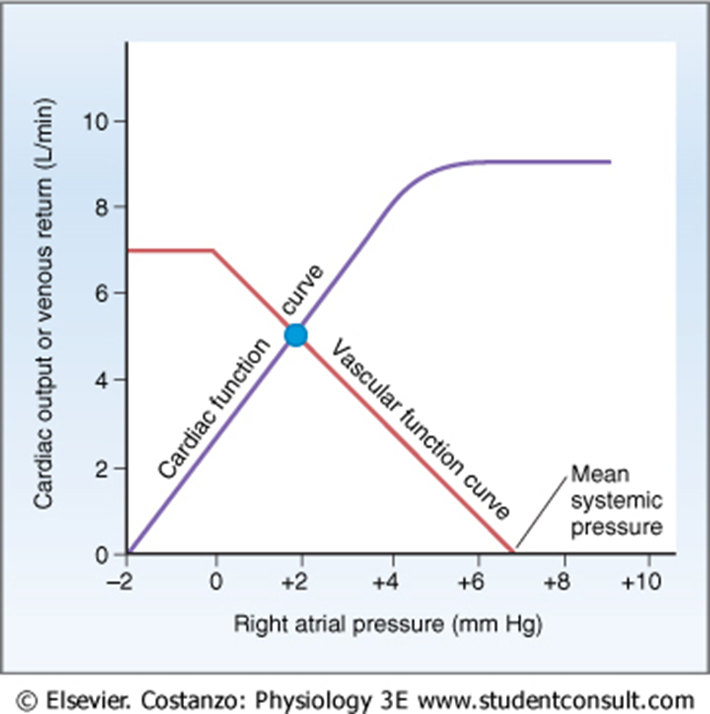
Cardiac function curve
Relationship between cardiac output and right atrial pressure (venous return= increase in right atrial pressure, EDV and end diastolic fiber length, leads to increase in CO)
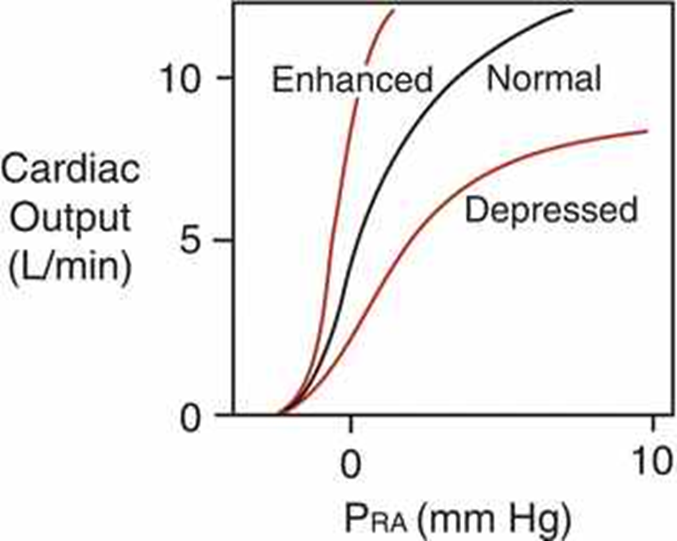
Enhanced cardiac function
Occurs with increased HR contractility or decreased afterload
Depressed cardiac function
Occurs with decreased HR contractility or increased afterload
Venous return equation
VR equals pressure gradient between venous pressure and right atrial pressure divided by resistance
Driving force for venous return/factors influencing
Difference between venous pressure and right atrial pressure/Muscle contraction & presence of valves, decreased venous compliance, respiratory activity, vena cava compression
Factors increasing/decreasing venous return
Increasing: muscle/respiratory pump, decreased venous compliance decreasing: vena cava compression and increased right atrial pressure
Vascular function curve
Relationship between venous return and right atrial pressure
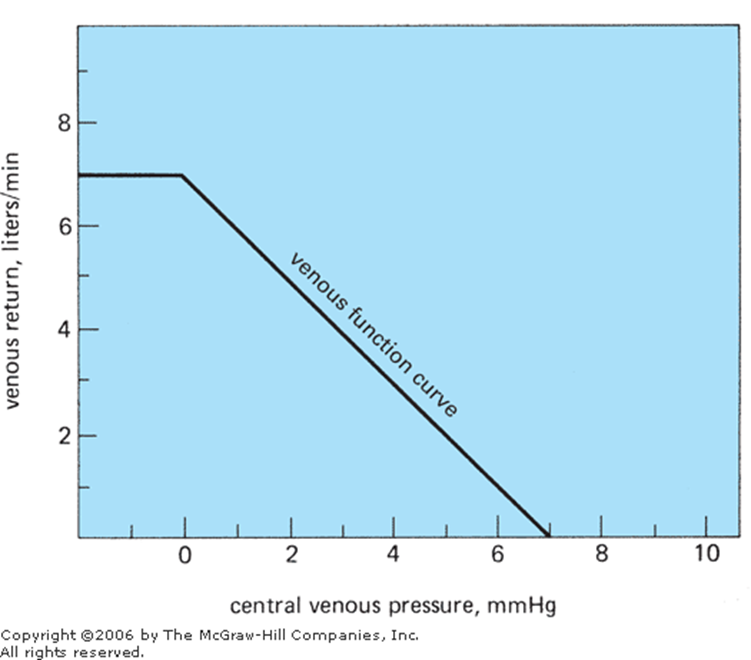
Mean systemic pressure
Pressure in circulation when heart stops determining venous return baseline (pressure in circulatory system if heart were stopped, determined by blood volume/distribution)
Equilibrium point of CO and VR
Intersection of cardiac and vascular function curves
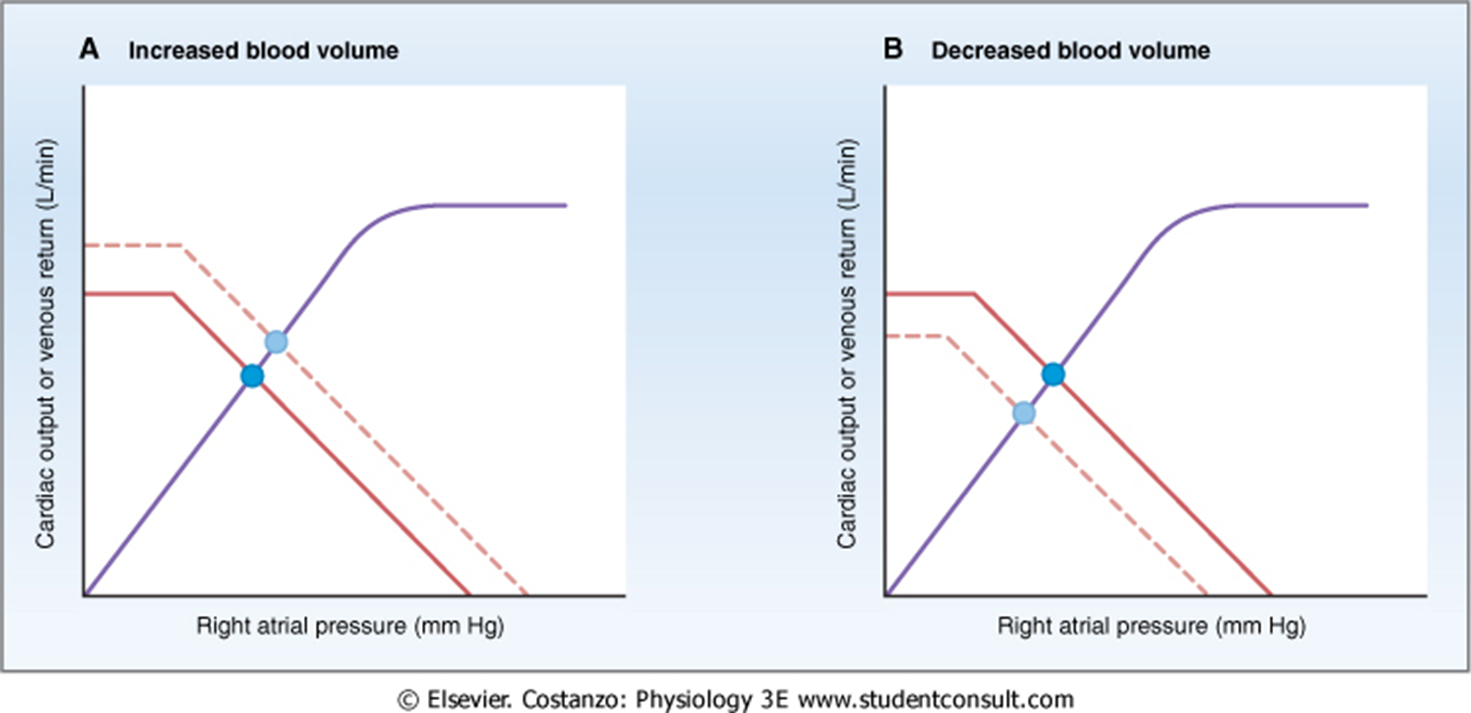
Effect of blood volume on cardiac/vascular function curves
Increased volume increases CO VR and right atrial pressure
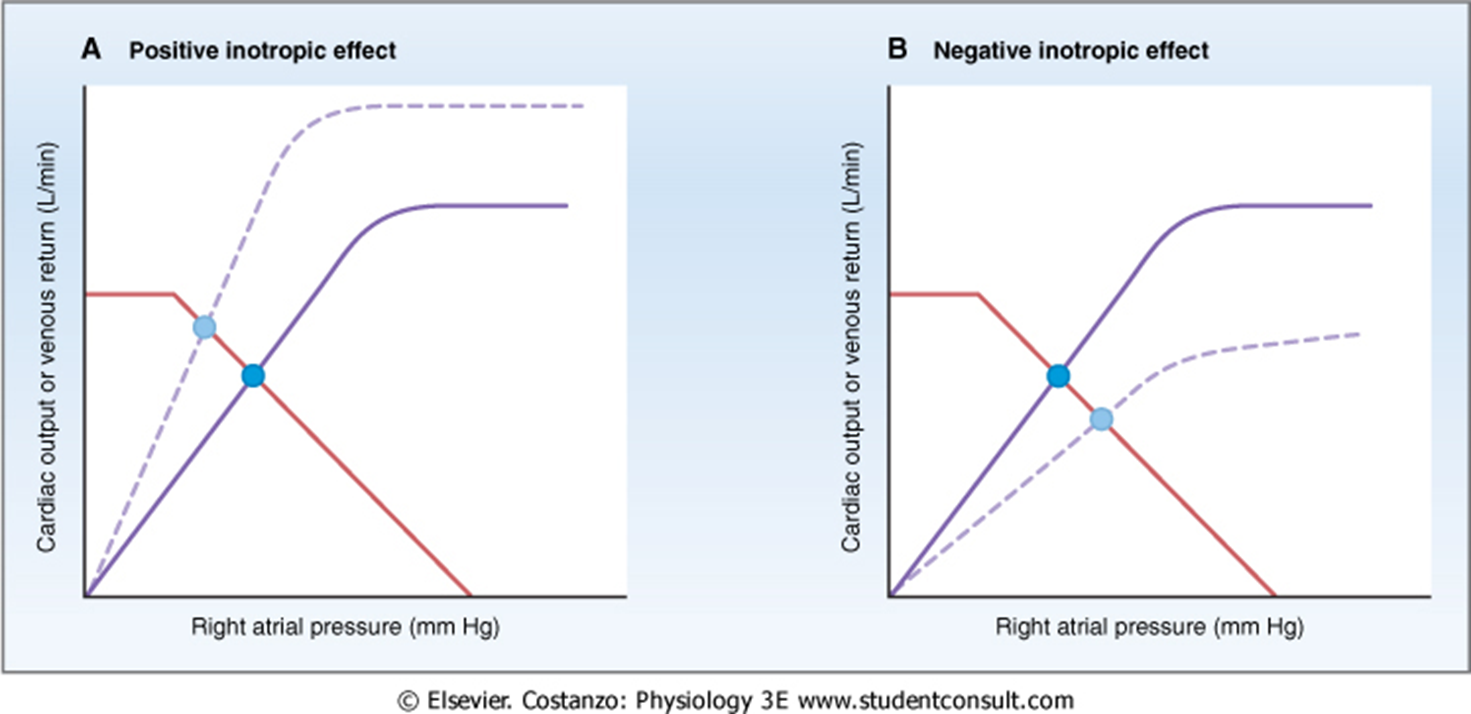
Effect of inotropic agents
Increase CO + VR and decrease right atrial pressure, no change in vascular function
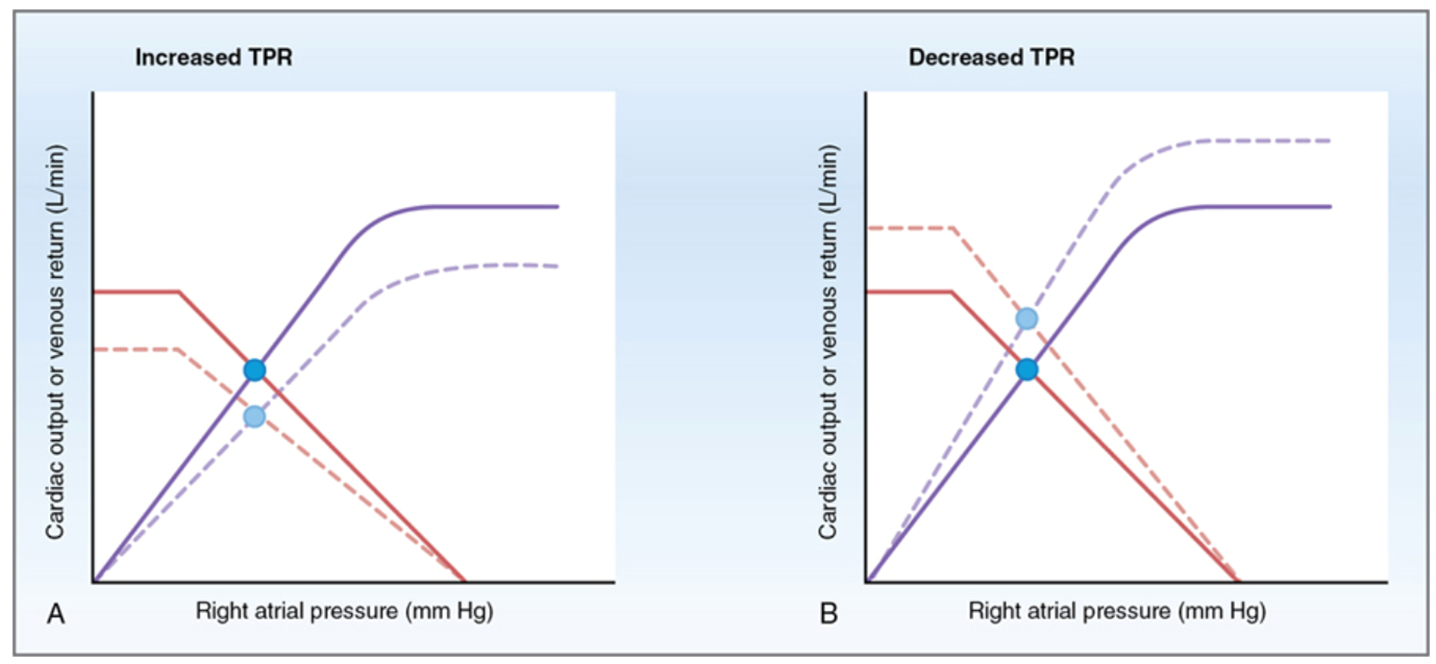
Effect of total peripheral resistance
Changes both cardiac and vascular function curves affecting CO
Myocardial metabolism
Primarily aerobic using fatty acids and glucose for ATP production
Oxygen extraction by heart
Heart extracts about 50 percent of delivered oxygen
Factors increasing oxygen demand
Increased heart rate contractility, afterload and preload
Myocardial ischemia
Occurs when oxygen supply is less than demand leading to dysfunction or infarction