Excel Terms and shortcuts
1/20
There's no tags or description
Looks like no tags are added yet.
Name | Mastery | Learn | Test | Matching | Spaced | Call with Kai |
|---|
No analytics yet
Send a link to your students to track their progress
21 Terms
cmd + 0
Hide Column
cmd + 9
hide row
cmd + shift + 9
unhide column
cmd + shift + 9
unhide row
cmd + shift + F
add/remove filter
Filter
Temporarily hides rows that don;t meet selected criteria. Access via right-click, Home tab, or Data tab
Sorting
Reorders data by one or more levels. Access via right-click, Home tab, or Data tab
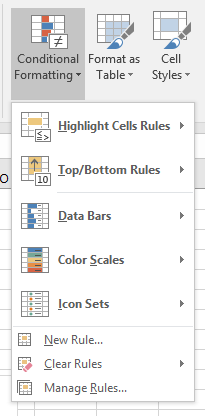
Conditional Formatting
applies formatting based on rules/criteria. Found in the Style group on the Home tab. Dynamically updates based on data changes
Filter

Sorting

Conditional formatting
CMD + P
Open print dialogue
Chart area
The entire chart, including elements like data series, axes, titles, and legends
Chart sheet
a worksheet that contains only a chart. Use the Move chart tool to transfer a chart to a chart sheet
data label
extra info shown with data points (like values or percentages); not always visible by default
data point
a single value from worksheet cells, shown as bars, lines, pie slices, etc, a chart
data series
a collection of related data points plotted on a chart
Gridlines
Lines across the plot area that help you visually align data with axis values
Legend
A key showing which colors/symbols represent each data series, usually outside the chart grid
Plot area
The part of the chart inside the axes where the data is visually represented
X & Y Axes
X Axis: Bottom, usually for categories
Y axis: Side, for values
(They are reversed in bar charts.)