Psychology Statistics Exam 1 Study Guide
1/37
There's no tags or description
Looks like no tags are added yet.
Name | Mastery | Learn | Test | Matching | Spaced | Call with Kai |
|---|
No analytics yet
Send a link to your students to track their progress
38 Terms
What is sampling error?
an unibiased error that’s more likley to be above than below the true value
Four Scales of Measurement (NOIR)
1) Nominal
is just used to name/list out
is the weakest
no actual order
2) Ordinal
subjects are separated into categories
has a ranking/order
interval size is unknown
3) Interval
has ranking
has an equal interval size
distance between points are equal
4) Ratio
has a true zero
meaning there’s an absolute absence of something being measured
has all the characteristics that the interval scale has
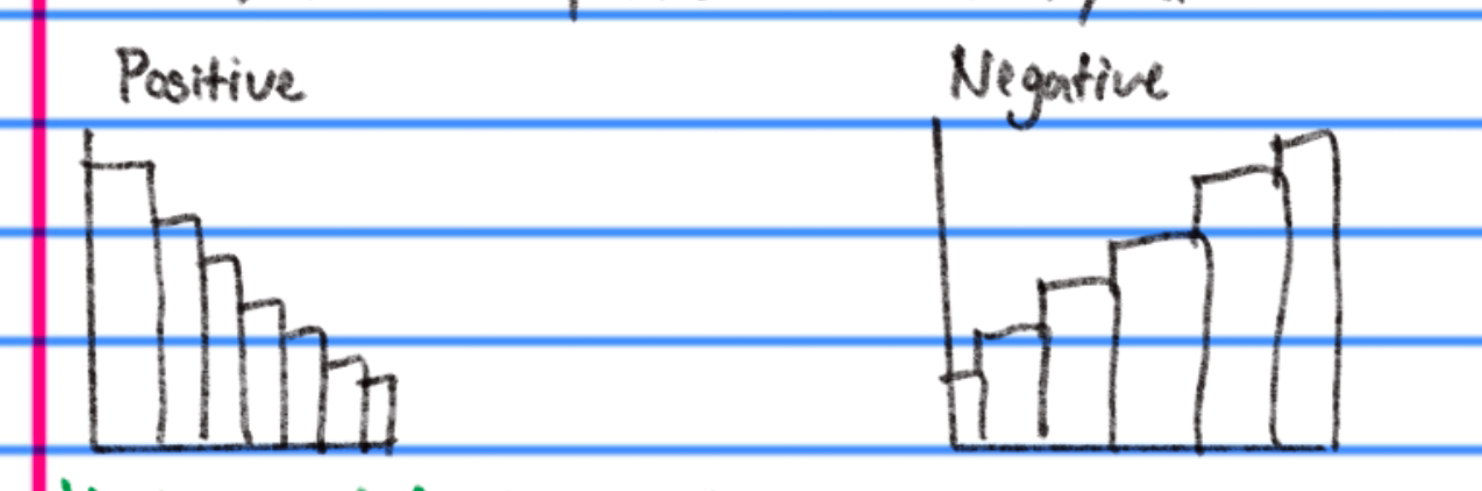
skewed distribution?
data points aren’t evenly distributed around the mean
is cluttered to one side
draw out a positive and negative skewed distribution
varaince definition?
a measure of variability
the degree to which scores in a distribution differ from the mean
what does variance tell about distribution?
variance tells how spread out data points are in a distribution
standard deviation (SD) definition?
a measure of the average amount in which scores deviate on either side of the mean
how does SD relate to variance?
SD is the square root of variance
what does SD tell approximately about a group of scores?
tells us how spread out a group of scores are from the mean
is SD or variance easier to grasp for variablity (opinionated)
n/a
discrete variable?
a variable that can only take a finite # of distinct values
most of the time is whole #’s
ex. number of objects in a jar
continuous variable?
a variable able to take on any number within a given range
ex. weight
difference between experimental vs non-experimental/correlational
an experimental study has an IV while non-experimental/correlational have a QIV
the goal of an expeirmental is to try and establish causation
two elements need for an experiment to be achieved
1) independent variable manipulation
2) control group
symbol for frequency
f
symbol for cumulative frequency
cf
how to find cumulative percentage?
cumulative%= cf value/total of the frequency
grouped frequency table
scores are grouped in class intervals
frequency distribution table
table that shows each score and the frequency it occurs at
what are the guidelines for selecting intervals in a grouped distribution table?
a) intervals:
no overlap
specific capture range (ex. 40-45)
b) decide the # of intervals
need to capture important aspects of the shape
ex. 5-15 interval
c) interval size:
2, 3, 5, or multiple of 5
how to find proportion?
p= f/n (frequency of score / total number of scores obtained)
what are the 3 measures of central tendency?
mean, median and mode (the three M’s)
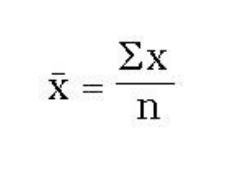
mean
is the sum of scores divided by the number of scores
mean = sum of X / N
median
the middle score
in odd # obeservations:
median is the value at position
in even # observations:
the avergae between the 2 values on either side of the position
mode
the most frequently occuring score (the highest frequency)
symbol for sample mean
x̄ (x-bar)
symbol for population mean
μ (mu)
symbol for populatuon size
N
symbol for sample size
n
symbol for population SD
σ (sigma)
symbol for sample SD
s
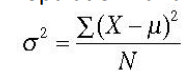
symbol for population variance
σ² (sigma squared)
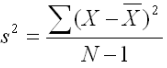
symbol for sample variance
s²
when is it best to select the mean vs the median to reflect central tendency is a given distribution, especially when there are outliers in your data set
best to select the median for central tendency measurement
why? because the median is not as affected by the outliers (extreme measurements) compared to the mean
population variance formula
sample variance formula
sample mean formula
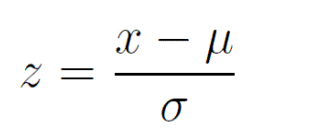
z-score formula