Epi - Lecture 2 - Frequency, risks, and associations - 9/1
1/15
There's no tags or description
Looks like no tags are added yet.
Name | Mastery | Learn | Test | Matching | Spaced | Call with Kai |
|---|
No analytics yet
Send a link to your students to track their progress
16 Terms
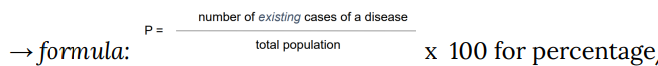
Prevalence
includes both new cases and those who contracted the disease in the past and still have the disease → at a specic time → accumulated amount of cases of a disease.
prevalence often preferred in chronic conditions and important info for pharmacies (how many drugs are needed).
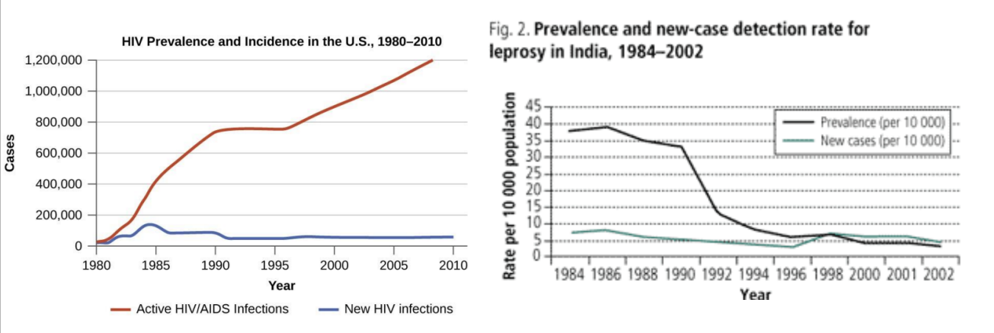
Explain this figure
left; amount of new cases (incidence) is low/ stable, but the accumulated amount of cases of AIDS is increasing, because people can live longer with AIDS
usually prevalence and incidence come closer together over time → which means people die close after contracting a disease or they get cured
right;
High prevalence: reflects high incidence or prolonged survival without cure or both.
Low prevalence: indicates low incidence, a rapidly fatal process or rapid recovery
studying prevalence
study designs: cross-sectional is most obvious (because you don’t follow patients over time), but also suitable for cohort and RCTs → definitely NOT in case-control studies (bc cannot match prevalence with controls).
calculations prevalence
incidence
new cases over a certain period
what is the difference between cumulative incidence and incidence rate
cumulative incidence → measures the proportion of individuals in a population who develop the disease over a specific period
incidence rate → measures the rate at which new cases occur in a population over time.
studying cumulative incidence
always prospective
cumulative incidence can be calculated → probability of getting disease
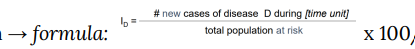
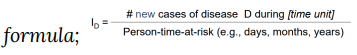
incidence rate / incidence density
new cases relative to the population at risk.
person time at risk = total amount of time contributed by each individual while he / she remained at risk of developing the disease
what are effect measures
also called measures of risk and association
effect measures are used to quantify the association between an exposure and an outcome
These measures help assess whether and how much an exposure influences the risk of an outcome
risk difference
the risk of outcome among a group minus the risk of outcome among another group
risk outcome group 1 - risk outcome group 2
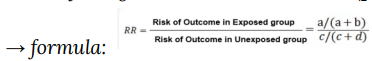
risk ratio
relative risk
the probability (risk) of an outcome occurring in the exposed group compared to the unexposed group
incidence 1 / incidence 2
formula risk ratio
outcomes risk ratio and risk difference
(close to) 1 → exposure is not associated with the outcome
>1 → exposure might be a risk factor for the outcome
<1 → exposure might be a protective factor against the outcome
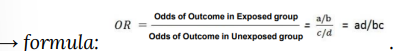
odds ratio
compares the odds of an event occurring in the exposed group to the odds of the event occurring in the unexposed group
for cohort the odds ratio can be calculated but it is not preferred (rr is better)
possible outcomes odds ratio
(close to) 1 → exposure does not affect the odds of outcome
>1 → exposure is associated with higher odds of the outcome
<1 → exposure is associated with lower odds of the outcome
formula odds ratio