Chemistry Structure 1.3—Electron configurations
1/6
There's no tags or description
Looks like no tags are added yet.
Name | Mastery | Learn | Test | Matching | Spaced |
|---|
No study sessions yet.
7 Terms
Emission spectra are produced by atoms emitting photons when electrons in excited states return to lower energy levels.
Emission spectra: the range of frequencies or wavelengths of electromagnetic radiation emitted during an electron transition from higher to a lower energy level. This is explained through the Bohr model, where electrons in an atom exist in discrete energy levels, where n=1 is closest to the nucleus (ground state) with lowest energy (energy levels converge at high energy). When energy is applied, electrons absorb it and move to higher energy levels, known as excited states. These states are unstable relative to the ground state, so emit the same amount of energy as energy absorbed and when the electrons return to lower energy levels, they release energy in the form of photons (particles of discrete amounts of electromagnetic radiation) and transitions back to the original energy level. The energy of these photons corresponds to specific wavelengths which can be seen on the emission line spectrum, and thus, each element has a unique emission spectrum.
The emitted light forms a line spectrum, which shows the range of frequencies or wavelengths of electromagnetic radiation emitted during an electron transition form a higher to a lower energy level and is unique to each element (only shows specific wavelengths of light as coloured lines on a black background). The lines in the emission spectrum get closer together (converge) at high energy (shorter wavelengths) where distinct lines represent different wavelengths of light. This is in contrast to a continuous spectrum, which shows a continuous range of all wavelengths of visible light
As the frequency of electromagnetic waves increases, their energy also increases, and their wavelength decreases. In the visible light portion of the spectrum, red light has the longest wavelength and lowest energy, while violet light has the shortest wavelength and highest energy. The electromagnetic spectrum spans from low-energy radio waves to high-energy gamma rays, with all forms of electromagnetic radiation traveling at the same speed, the speed of light (3 × 10^8 m/s).
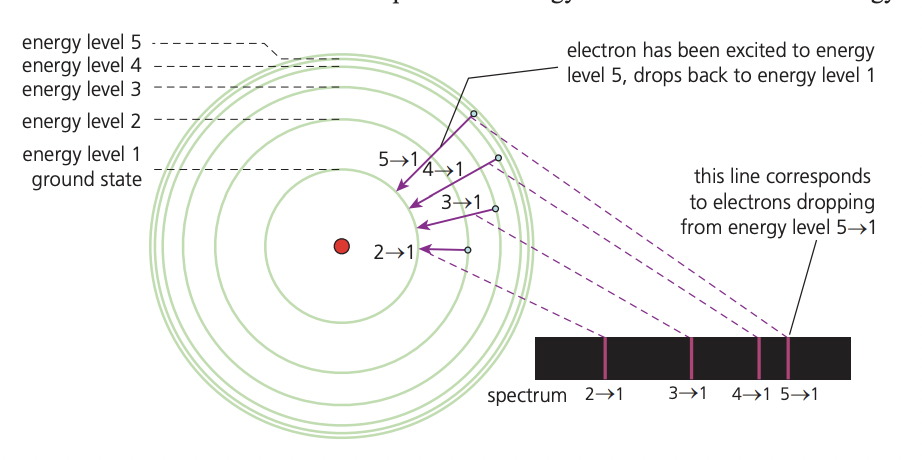
The line emission spectrum of hydrogen provides evidence for the existence of electrons in discrete energy levels, which converge at higher energies.
Hydrogen emission spectrum: The hydrogen line emission spectrum provides evidence for the idea that electrons occupy discrete energy levels in atoms. According to the Bohr model, when hydrogen atoms are exposed to energy, electrons absorb this energy and move from lower energy levels to higher ones (excitation). These excited states are unstable, so electrons quickly return to lower energy levels, releasing energy as photons of electromagnetic radiation. The energy of the emitted photons corresponds to the energy difference between the two levels and determines the wavelength (or frequency) of the light emitted. (if electrons could exist at any energy level, we would see a smooth, continuous spectrum of colors. But instead, we see only certain lines, proving that electrons can only occupy specific energy levels)
Each line in the hydrogen spectrum represents a specific electron transition between energy levels. Transitions to n = 2 (the second energy level) produce visible light (seen as coloured lines on a black background). These lines are evidence that electrons are restricted to certain energy levels, as only specific wavelengths appear—supporting the concept of quantization.
Transitions to n = 1 release more energy and fall in the ultraviolet (UV) region, while transitions to n = 3 release less energy and fall in the infrared (IR) region. The higher the energy change, the higher the frequency and the shorter the wavelength of the emitted photon. The lines in the spectrum become closer together (they converge) at higher energy levels because the energy difference between levels becomes smaller as n increases. At n = ∞, the electron is completely removed from the atom—this is known as ionization.
Instrumentation: A hydrogen emission spectrum can be observed using a gas discharge tube and a diffraction grating or prism, which separates emitted light into distinct lines based on wavelength. Qualitative data includes the observation of distinct lines and their colours. Quantitative data can include precise measurement of the wavelengths or frequencies of these lines.
Nature of Science—Structure: Because each element emits a unique line spectrum, this technique is used to identify the presence of elements in stars and gas clouds. This supports the atomic theory that different elements have different arrangements of electrons and energy levels.
The main energy level is given an integer number, n, and can hold a maximum of 2n2 electrons.
The main energy level of an atom is given by the principal quantum number, n. Each main energy level corresponds to a shell around the nucleus and is denoted by increasing integer values starting from n = 1. As n increases, both the energy of the level and its distance from the nucleus increase.
The maximum number of electrons that can occupy a given main energy level is determined by the formula 2n².
Electrons fill the main energy levels starting from the lowest energy level (n = 1) and moving outward. A lower energy level must be completely filled before electrons begin to occupy the next one. This pattern of filling continues based on increasing energy levels.
The highest main energy level occupied by electrons corresponds to the period number of the element.
A more detailed model of the atom describes the division of the main energy level into s, p, d and f sublevels of successively higher energies.
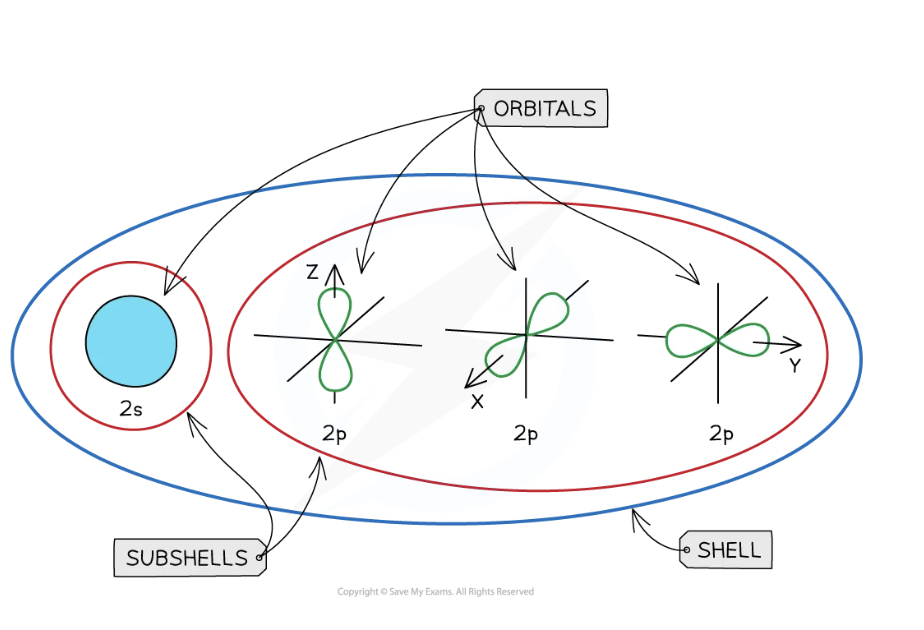
An electron has the properties of both a particle and a wave. Heisenberg’s uncertainty principle states that it is impossible to know the exact position and momentum of an electron at the same time. Instead of traveling in fixed orbits, electrons are described by atomic orbitals, which are three-dimensional regions where there is a high probability of finding an electron. These orbitals differ in shape and energy and are grouped into sublevels named s, p, d, and f, with each main energy level (n) divided into n sublevels.
The s orbitals are spherical, while p orbitals have a dumbbell shape and are arranged in three orientations at right angles to each other (x, y, z). A single s orbital makes up an s sublevel and can hold a maximum of 2 electrons, while a p sublevel contains three degenerate p orbitals, together holding 6 electrons. The d sublevel has five orbitals (maximum 10 electrons), and the f sublevel has seven orbitals (maximum 14 electrons). These sublevels explain the block structure of the periodic table: s-block (Groups 1-2), p-block (Groups 13-18), d-block (transition metals), and f-block (lanthanides and actinides).
Each atomic orbital holds a maximum of two electrons, and the total number of electrons per energy level follows the formula 2n². This model accurately explains the structure of the periodic table, the arrangement of electrons, and the chemical behavior of elements.
Each orbital has a defined energy state for a given electron configuration and chemical environment, and can hold two electrons of opposite spin.
Sublevels contain a fixed number of orbitals, regions of space where there is a high probability of finding an electron.
Each orbital is a region of space where there is a high probability of finding an electron, and it can hold a maximum of two electrons with opposite spins, according to the Pauli exclusion principle. Sublevels consist of a fixed number of orbitals: the s sublevel has 1 orbital, p has 3, d has 5, and f has 7.
To determine the electron configuration of atoms and ions (up to atomic number Z = 36), we apply three key principles.
First is the Aufbau principle, which states that electrons occupy the lowest energy orbitals available. (gives the lowest possible potential energy)
Second is Hund’s rule, when we have degenerate orbitals (orbitals of the same energy) then each orbital is filled with a single electron before being doubly occupied
Finally, the Pauli exclusion principle states that an atomic orbital can only hold 2 electrons and they must have opposite spins
Electron configurations can be written in full or in a condensed form using the noble gas core. Orbital diagrams (arrow-in-box diagrams) are used to show how electrons fill orbitals with their respective spins.
The 3d and 4s orbitals are very close in energy, and for the d-block elements, the 4s orbital fills before 3d because it is of lower energy but is also emptied first when ions form.
Special cases include chromium and copper, which do not follow the expected pattern.
Chromium has the configuration [Ar] 3d⁵4s¹ rather than [Ar] 3d⁴4s²,
Copper is [Ar] 3d¹⁰4s¹ instead of [Ar] 3d⁹4s².
These exceptions arise due to the extra stability associated with half-filled or fully filled d sublevels.
In an emission spectrum, the limit of convergence at higher frequency corresponds to ionization.
Ionisation energy (IE) refers to the energy required to remove one mole of electrons from one mole of gaseous atoms in their ground state. In hydrogen, this is equivalent to an electron transition from n = 1 to n = ∞, representing complete removal from the atom. This process is observed in the emission spectrum, where the limit of convergence at high frequency corresponds to ionisation—the point where energy levels merge, and the electron is no longer under nuclear attraction. The frequency at this convergence point allows calculation of IE using the equations: E = h f and c = λ f, with Planck’s constant (h = 6.63 × 10⁻³⁴ J·s) and the speed of light (c = 3.00 × 10⁸ m/s).
Across a period, first ionisation energy increases due to increasing nuclear charge and decreasing atomic radius, which strengthens electrostatic attraction between the nucleus and outer electrons. However, discontinuities exist, such as between Be and B or N and O, due to differences in sublevel energies and electron repulsion in doubly-occupied orbitals (repel each other). Down a group, IE decreases as outer electrons are further from the nucleus and experience greater shielding, reducing the energy required to remove them.
These trends explain reactivity: metals, found on the left of the periodic table, have low ionisation energies and lose electrons easily, making them highly reactive. Non-metals, found on the right, have high ionisation energies, so they tend to gain electrons instead. The periodic variation in IE helps classify elements and understand their chemical behaviour.
Because IE values span several orders of magnitude, a logarithmic scale is often used to display them. This allows for better visualization and comparison of values that would otherwise be difficult to interpret on a linear scale, similar to how [H⁺] concentrations are expressed using pH.
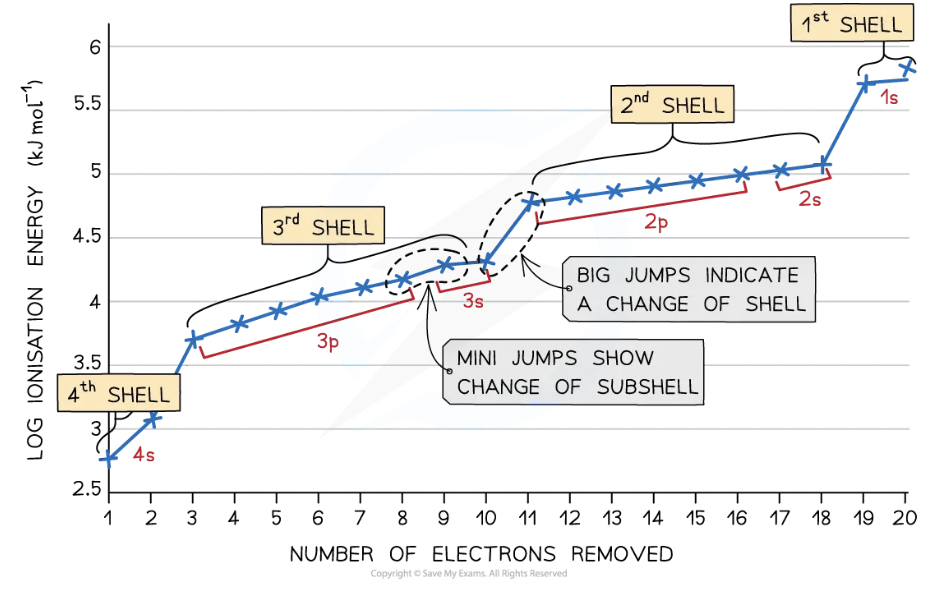
Successive ionization energy (IE) data for an element give information about its electron configuration.
Successive ionisation energy (IE) data provides vital information about the electron configuration of an element. As electrons are removed one by one, the increasing positive charge of the ion causes a greater electrostatic attraction between the nucleus and the remaining electrons, leading to higher ionisation energies. However, when an electron is removed from a new, inner energy level, there is a significant jump in ionisation energy.
By analysing these jumps, we can deduce the number of valence electrons in an atom. The first large jump in ionisation energy occurs after all valence electrons have been removed. This is because the next electron is removed from the inner level, which requires much more energy (less shielding).
These patterns also support the existence of principal energy levels and sublevels. Within a main energy level, electrons in the 2s sublevel are more tightly bound than those in the 2p sublevel, which can be seen in smaller jumps in ionisation energy data.
In the case of transition metals, patterns in successive ionisation energies help explain their ability to form multiple oxidation states. For example, titanium can exhibit +2, +3, and +4 oxidation states because the 3d and 4s orbitals are close in energy, leading to a gradual increase in IE. A large jump occurs when an electron is removed from a more tightly bound orbital, such as 3p, explaining why +5 is not a stable state for Ti.