A Level CIE Geography: Economic Transition
1/54
There's no tags or description
Looks like no tags are added yet.
Name | Mastery | Learn | Test | Matching | Spaced | Call with Kai |
|---|
No study sessions yet.
55 Terms
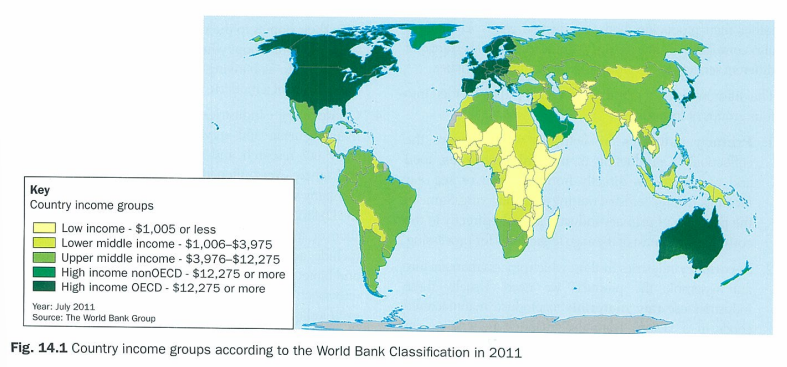
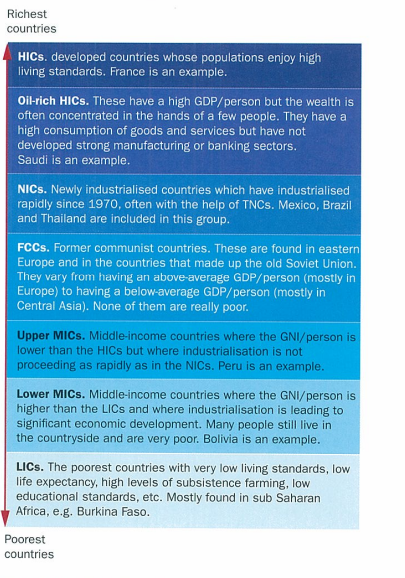
classifiication of countries based on GNI (gross national income) per person: 3
HIC - high income countries
MIC - middle income countries
LIC - low income countries
what are MICs subdivided into
lower-middle income countries and upper-middle-income countries
who uses GNI/person
World Bank considers it single best indicator of economic progress
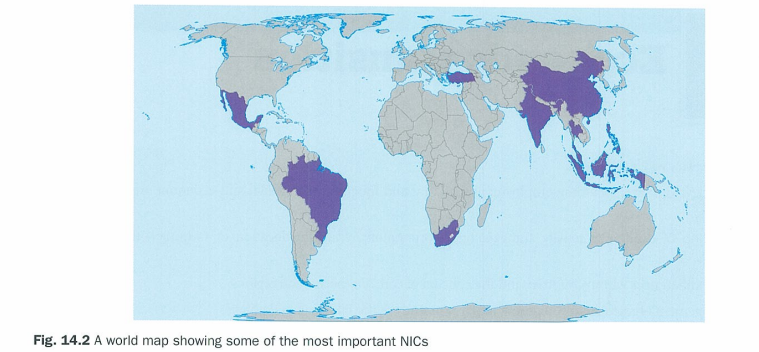
NIC
newly-industrialised country, upper middle income countries that have been undergoing rapid economic growth, especially in terms of export-oriented manufacturing industry
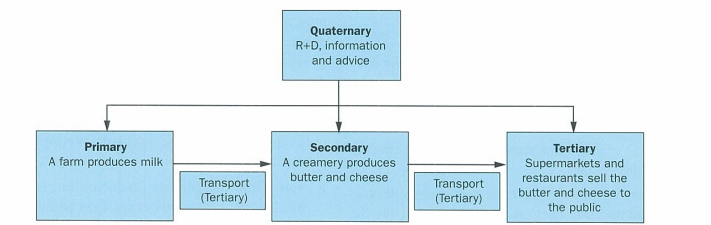
4 sectors of employment
primary
secondary
tertiary
quarternary
LICs jobs
narrow range of jobs available
many people work on land as subsistence farmers
subsistence farmers never have much they can sell, usually very poor nad contribute little to national economy
contribution to family’s health important as without efforst people die of hunger
MIC & NIC jobs
much wider range of jobs available
factory work producing goods earning a wage and contributing to the growing national and social infrastructure by paying tax
HIC jobs
very wide range of jobs available
many ppl well educated and most of them have jobs providing services rather than producing food or industrial goods
taxes also contribute to their country’s infrastructure
range of diff services keep growing as country gets richer
primary
industries are activities which involve the collection or production of natural resources, food and raw materials directly from land or sea e.g. farming, fishing, forestry, mining, and quarrying. some of prods of primary industry sold directly to consumer but most to factories for processing
secondary
process, manufacture and assemble the products we need. usually industries use raw mats to produce manufactured goods in a factory e.g. steelmaking, car assembly and papermaking. goods can be sold to public (consumer goods e..g car) or other factories for further processing and assembly (components e.g. car engine) or to companies for use in producing other things (capital goods e.g. dumper truck and machines on production line)
tertiary
produce no goods but provide a service. jobs in health, education, retailing, transport. no goods produced but great wealth created by service industries. transport services vital. financial services e.g. banking and insurance essential for running modern, market economy
quarternary
modern, high tech manufacturing and service industries. many carry out research and provide information, expertise and advice. very often part of much larger company where provide r&d facilities. e.g. aerospace, pharmaceuticals, comp sci, biotech.
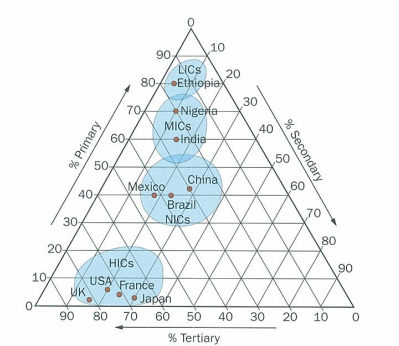
employment structure
proporition of people working in each sector in any coutnry or region. changes overtime as country develops and varies between diff places at one time. useful to measure countries dev or compare.
how can 4 sectors of employment be linekd
production chain/chain of production which makes it clear why diff sectors of employment have their names
employment structure changes
pre industrial
industrial
post-industrial
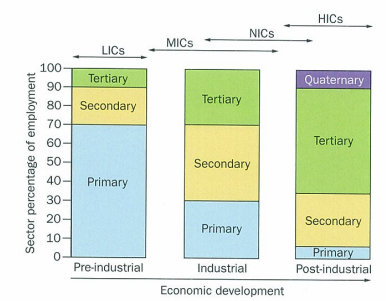
pre-industrial change
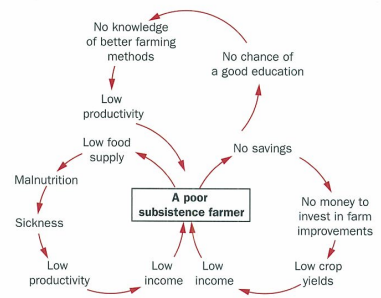
lics have high proportion of workers in primary industry
mainly subsistence farmers as only way to make living
areas of subsistence e.g. fertile parts of sub-saharan africa have large areas where each small farm supports a large family
ppl poor bc eat what they grow and little surplus to sell for money
not enough work on farm to keep everyone fully employed and undermployment common
despite large no. unemployed people, few other jobs available for uneducated so no choice
poverty trap = vicious circles, situations w no way to improve
other primary employment can be provided by fishing, forestry, mining, but once again difficult for workers to command more than basic income
fish for sale in urban/foreign markets. forestry controlled by foreign companies who employ local people for basic tree felling
mining controlled by large often foreign companies who use locals as cheap unskilled labour and take profits for themselves
secondary industry craft-based such as village blacksmith and carpenter. lack of educated workforce and poor national ifnrastructure dont attract large tncs so inward investment low
tertiary jobs demand level of education beyond what is available to most people and are almost all funded by govs
wages in these service industries are low bc gov colelcts very little money from taxes bc most people dont work in commercial, money based economy
industrial stage
mics and nics have v diff employment structure
proportion of primary jobs has come down bc agri more commercialised and mechanised
inward investment by foreign tncs = developed factories = jobs for workers forced off land by mechanisation of agri
tncs attracted by low wage rates and relaxed env laws and growing local market for manufactured goods and dev national infrastructure.
cumulative causation important in stimulating growth in manufacturing as phenomenon known as demographic dividend which affects many nics in stage 3 dtm
growing econ stims local companies, some of which become tncs in own right. largest of korean chaebol corporations e.g. daewoo, lg e.g. local become global names
no. tertiary jobs increase bc more complex economy requires more services
goods moved around so jobs in transport develop
factories need financial and legal support services and marketing and ads essential
education prioirty and as country develops = better health services
local corps develop r&d so stimulate quarternary jobs
post-industrial stage
in hics only few primary jobs bc:
agri is extremely productive but also heavily mechanised so no. jobs in farming is v low
most minerals and fuels have alr been mined and country relies on imports
fisheries over-fished and forests cut down
employment in secondary industry contracted bc:
many manufacturing jobs move to mics and nics where laboour costs lower. happens first w industries that rely on rel simple tech e.g. textiles and steel. later on more complex industries e.g. pottery manufactore move as levels of education and skill in nics improve. labour-intensive industries e.g. clothing and shoe manufacture benefit from low labour costs in mics
high labour costs and an ageing pop (shortage of workers) in hics mean automation increased, with computer-controlled robots doing much of the work on assembly lines of car factories. only a few people are needed in control room and few more for maintenance of machines
tertiary grown considerably. financial services in uk 30+% of countrys gdp. uk nhs 5th largest employer. uk unis expanding esp for inter students
quarternary industry more and more important. r&d for marketing and product development.
outsourcing meant that…
many service industry jobs from hics have going to nics
teleworking
working online or from home bc of IT leading to a growth in this
3d printing
could replace many manufacturing jobs
internet shopping
impact traditional retail
what must be considered for future
how service industry will change
new services in future
change in employment structures and management
tncs - driving force instead of national govs
change in working conditions
changes from demographic and economic factors = changes to school leaving age, retirement and provision of pensions
location ofemployment change
will changes = inequalities
development gap
difference in social and economic wellbeing between various countries of the world and what can be done to reduce it. millennium development goals by UN attempt to close gap
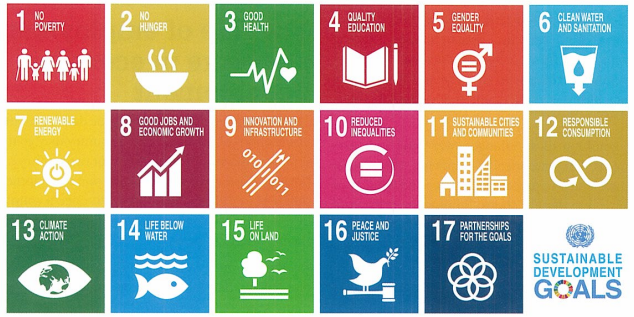
SDGS
to do with quality of life more than standard of living
country needs money to achieve so econ dev needed
UN CASE STUDY
ok
causes of global inequalities: 4
physical geography
stable government
economic policies
demography
physical geography factors 5
location - landlocked dev slower than coastline bc of ability to trade inter therefore gain wealth
size - small countries dev slower bc availability of resources and size of pop. big have more and bigger pop so more workers and market (but sg)
natural hazards - country that experiences frequent natural hazards less likely to dev than one with few causing death, damage, and econ disruption (but jp)
climate and soil - tropical countries dev slower than temperate bc tropical soils infertile so less agri rod. trop have lots of pests and disease so less pop growth and agri prod
range of plants and animals domesticated - temp move ahead more rapidly bc great range of plants cultivated to prod food and animals domesticate to prod muscle power, milk, and meat.
stable gov key political factors 3
maintenance of law and order - allows ppl to make money and keep property secure
lack of corruption - encourages investment bc people and companies know that their money will not be taken by corrupt officials
long term stability through political consensus (can be stable but criticized e.g. china communist) - even though diff pol groups come to power, theres agreement that general improvement in social and econ wellbeing will continue
econ policies factors 4
successful countries adopt econ policies to encourage growth:
low lvls of tax encourage econ growth. govs need to gather tax to pay for dev infrastructure but if too much, individuals and companies ability to invest in dev that are driving force of modern market economy is reduced
high levels of personal saving and availability of credit also encourage econ growth. individuals and banks w money to invest can fund new devs in trade and industry. many ppl in mics and lics have no savings to invest in dev projects which is why inward investment becomes vital. tncs key players in nat and glob dev
open econ that encourages inward investment have grown faster than closed econ emphasizing role of trade in nat dev. lics have traditionally suffered from unfair trading practices and some adopt closed, protectionist policies as result
when groups of countries work together e.g. EU or NAFTA, their collective dev is often faster than it would have been if the countries had worked alone. lics and mics have sometimes found it hard to join these groups or have found that their prods are disadv bc of import taxes and tariffs that these groups adopt
demography factors 5
once country goes stage 2 dtm, econ dev needs to keep up with pop growth
w/o econ growth rising pop won’t have enough food, housing, jobs or services
gov can achieve this either by ensuring econ growth fast enough e.g. brazil or by reducing BR to limit the amount of pop growth e.g. mauritius or by combining both e.g. china.
once country reaches stage 3 dtm, rising pop starts to provide econ benefits e.g. large and productive workforce and increasingly affluent domestic market
some countries econs unable to grow fast enough to keep up w pop growth, leading to high lvls of unemployment and underemployment = pov
4 economic consequences of global inequality
poverty - 20% of world’s pop lives on less than 1 dollar a day
gov can’t raise taxes from impoverished population = inability to dev country’s infrastructure
hunger - ppl freq lack ability to pay for food or grow enough of their own. don’t have money to improve their farms
difficult to attract inward investment when national infrastructure is inadequate and pop poorly educated
4 social consequences of global inequality
education - 800 million ppl in mics and lics cant read or write limiting chances of getting well paid job
gender - lack of education for girls and high fert rates = women have less chances to do well in life than men
health - lack of clean water and basic sanitation mean preventable diseases are common in mics and lics. infant mortality rates are v high as a consequence
housing - ppl in mics and lics live in v basic housing either in their rural villages or in shanty towns if they are forced to move to towns and cities
4 environmental consequences of global inequality
pop pressure and poor farming techniques often lead to env deg e.g. soil erosion
lics and mics need to use all of their resources to dev their econ. deforestation and environmental damage due to mining are just two of the ways that the exploitation of natural resources can lead to impacts on the natural environment
lics and mics are more vulnerable to impacts of env hazards are less resilient meaning it takes htem longer to recover from impacts of cyclones, earthquakes, etc.
bc of need to attract inward investment, govs in lics and mics often prepared to allow tncs to pollute the env much more heavily than allowed to in hics
standard of living
mostly to do w economics w money and wealth
qual of life
related to wealth but also determined by social and environmental factors. in other words it sums up all the factors that affect a persons well being and happiness.
two most common statistical ways o fmeasuring dev
gdp per person (PPP)
hdi
how is gdp per person (PPP) calculated
taking total value of g&s produced by country in any one year and dividing it by population of country. figures adjusted to take account of purchasing power of money in country (purchasing power parity or PPP)
expressed as us dollars per person so countries can be compared
economic measure of dev related to SOL rather than qual of life
easy to calc and easy to use but criticised bc doesn’t take into account g&s produced by peasant farmers and people working in informal econ.
means tends to underestimate production of poorer countries.
how is HDI calc
GDP per person PPP
adult literacy and other aspects of countrys educational provision
life expectancy at birth
broader measure than gdp and more likely reflects qual of life. difficult to calc, given as no. between 0-1 (1 highest)
big mac index 4
informal way of measuring purchasing poewr parity (PPP) in diff countries and seeks to make dev indicators more digestable.
introduced in sep 86 by pam woodall.
looks at amt of time that avg worker in given country must work to earn enough to buy big mac.
unlike gdp per person and hdi, focuses only on purchasing power of avg worker, taking into account local price of big mac and relating to local wage rates
limits of big mac index
in many countries eating mcdo is relatively more expensive than eating locally owned
demand for big macs isnt same in india/usa for cultural reasons
actual burger in q varies from country to country w diff nutritional values. e.g. aus has 22% less cals than canadian and is 8% lighter than mexican
still interesting way of comparing ppls purchasing power
also mcdo dont have restaurants everywhere
12 statistical indicators and if they rise/fall if country devs
death rate - falls once country stage 2 dtm but may rise stage 5
infant mortality rate - falls early in dev and stays low
birth rate - falls once dtm 3
life expectancy at birth - rises as country devs but falls if diseases of affluence important once country is rich
pop growth rate - rises in stage 2 and 3 dtm but falls once dtm 4
adult literacy - rises as country devs and education widespread
no. ppl per doctor - falls as healthcare more affordable as country gets richer
daily food supply - rises as country becomes richer
urban pop - rises bc of r-u migration
% of workers employed in agri - falls to v low lvls in hics
energy consumption - rise in per person energy cons linked to econ dev
mobile phone use - rises as country devs as does use of radio, tv, comps, other
development continuum
reflects that countries move from one category to another as develop and recognizes that countries make money in diff ways so orgnaized accordingly
globalisation
growth of international integration/increase in links betwen diff parts of globe
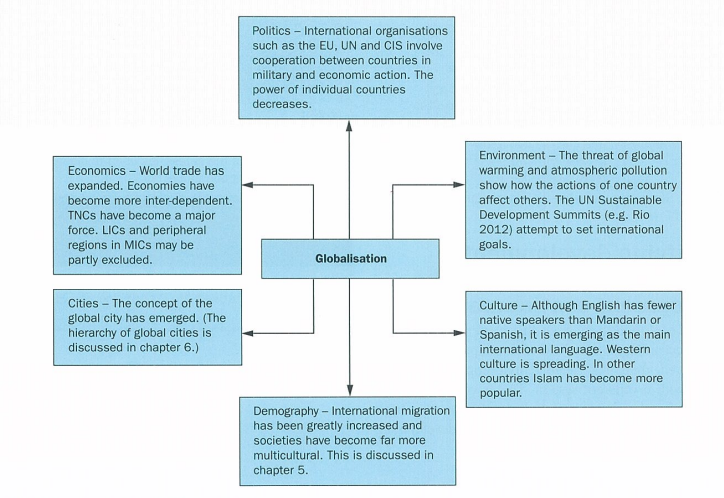
5 features of globalisation
cultures in diff countries becoming more similar in terms of langauge, food, clothing
increased trade and availability of goods from other countries
econs being affected by econs changes in other countries
worldwide env effects e.g. air pollution and global warming
increased global pop migration
4 causes of globalisation
growth in tncs
advances in transport allowing movement of ppl
advances in comms infrastructure e.g. internet and cell phones allowing movement of knowledge
growth of international political alliances e.g. EU
global patterns of resources
not equally distrib
exploitation of resources variable across globe, some mineral rich african countries yet to be exploted
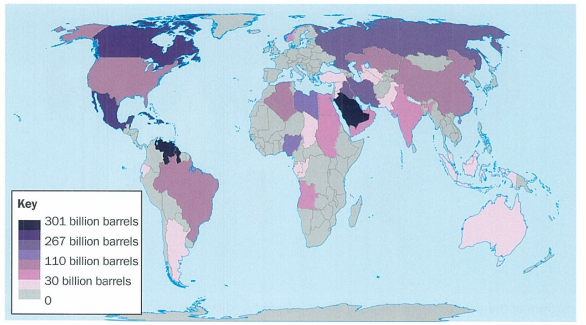
global patterns of prod
over half worlds energy comes from oil and gas so v important in chem industry
oil prod dominated by small no. countries and areas e.g. parts of africa and europe have v little oil
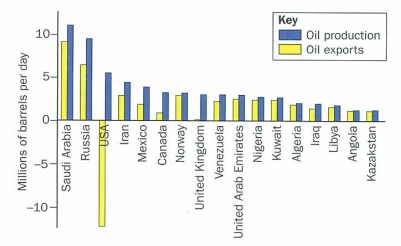
global pattern of markets
conusmption rate are function of size of countrys pop and level of dev
most oil-refining occurs in NA and EU
middle east has been scene of conflicts
rich oil consumign countries have interest in ensuring political stability in middle east. OPEC important in controlling price of crude oil and lvls of prod
patterns of consumption mirror lvls of econ dev and are sometimes expressed as ecological footprints - amount of land and water pop nees to produce resources that it consumes
foreign direct investment (FDI)
when company or indi from another country buys company in country or expands existing bus in that country (doesn’t include investment in securities of another country e.g. stocks/bonds). indicated in national accounts
fdi may inlcude 4
mergers and acquisitions of existing companies in host country
building new facilities
reinvesting profits earned from overseas operations
intra-company loans
fdi can improve econ growth in lics and mics throguh: 8
influx of capital
increased tax revs
dev of skills
access to more advanced tech
access to r&d
new infrastructure projects
encouraging productivity gains and greater efficiency in other industries due to comp
providing example of better coroporate governance standards
disadvantages of fdi for host country may include:8
few skilled workers may be employed
profits may go abroad
local labourers exploited at low wages
cost of manufactured goods too high for local ppl to buy
products such as oil are imported increasing national debt
local resources exploited
mechanisation reduces the demand for labour
ease at which tncs can shut down prod in a country
chinese fdi case study
new international division of labour NIDL
480