Divergence Within Species
1/64
There's no tags or description
Looks like no tags are added yet.
Name | Mastery | Learn | Test | Matching | Spaced | Call with Kai |
|---|
No study sessions yet.
65 Terms
Analogy
The relationship of any two traits that arose convergently (from unrelated ancestors)
Homology
Similarity between any traits due to common ancestry (usually with divergence)
Base-by-base alignment comparison
Compare the DNA sequence between species (but where do you start?) specific but computationally heavy.
Protein/Gene-by-gene alignment
Align corresponding genes/proteins in different species and compare them (amino acid comparisons)
WGA Challenges
While homologous genes/proteins should align well, different species will have rearrangements that occurred during evolution (inversion, translocation, duplication, del, insertions)
Orthology
Relationship of traits that came from a common ancestor between the species’ sharing the traits.
Paralogy (Duplication)
Relationship of two homologous traits resulting from a duplication of the gene for that trait, can diverge over time
Xenology (HZ Transfer)
The relationship of any two homologous traits whose history (since their common ancestor) involves a horizontal gene transfer
How do we tell all these -logs apart?
phylogenetic analysis (precise but computationally heavy), other methods are more indirect
Types of Duplication
Gene duplication, whole genome duplication (create an entire new set of paralogs)
Duplications
Whole genome duplication (entire genome of paralogs), Segmental duplication (tandem in eukaryotes, not common in bacteria)
Horizontal Gene Transfers
Homologous (replaces a gene or segment with an orthologous copy from another organism),
Non-homologous (introduces a gene or segment that is entirely new from another organism)
Was thought to have relatively little impact on evolution, UNTIL genome sequencing came along!
Subfunctionalization (Duplication)
The function of the ancestral gene is split (i.e. one binds to X and the other binds to Y)
Neofunctionalization (Duplication)
One copy acquires a whole new function
Pan-genome
All the distinct genes found in the population/species/unit as a whole
Genealogy
The ancestral relationships in a collection of gene sequences
Can vary between chromosome segments
SNP
The most pervasive form of variation within a species, it is a single nucleotide that differs from most other ppls
How do you answer “how much variation is there in the population?”
Average number of pairwise differences:
1) Sequence genomes from a pop
2) Choose a window in the genome where sequences can be aligned
3) Count DIFFERENCES between pairs of sequences
4) Take the average number of differences over ALL pairs of sequences
5) Divide by the number of sites sequenced
Average Number of Pairwise Diff (πlocus) PER LOCUS
Sum of pairwise differences across all pairs / number of pairs
134 total differences across all pairs / 45 pairs [aka all possible combinations of pairs!] = 134/45 = 2.98 = πlocus
Average Number of Pairwise Diff (πsite) PER SITE
Average number of pairwise diff per locus (πlocus) / total number of sites[bases] compared = 2.98/29 = 0.1ish = πsite
How do you answer “How common are SNPs in the population?”
SFS (Site frequency spectrum) for polymorphisms:
1) Sequence genomes from pop sample
2) Choose a window in the genome where sequences can be aligned
3) Identify each SNP and determine its frequency
4) Bin SNPs by FREQUENCY
5) Plot histogram showing number of SNPs per FREQUENCY BIN
SFS Example
Locus (window) = 1
n = 10 distinct sequences
L = 29 sites/bases sequenced and analyzed
9 different SNP sites in this set
Each SFS has a frequency between…
1/n and n-(1/n), where n is the number if sequences or sample size
SFS Shape depends on…
population history (pop up, pop down, natural selection)
Estimating Sequence Divergence
1) Sequence genomes from two or more species
2) Choose in the genome where sequences align
3) Count differences
4) Adjust the estimate to account for unobserved substitutions
5) Repeat for each window across the genome
What is an unobserved substitutions?
When a base mutates from A → G → back to A
Estimate interspecies divergence ASSUMPTION:
Each variant represents a single mutation
(May break down for frog/chicken [because very very old RCA] because of unobserved substitutions)
Fidelity
Perfect fidelity: # of canon substitutions = # of observed sequence differences
Bad Fidelity: # of actual substitutions is unequal/greater than observed substitutions
Sequence difference vs time graph expectation vs reality
Expected difference is perfectly linear, but observed difference flattens at the end. Difference between the expected linear & observed asymptote is the [underestimation of # substitutions]
![<p>Expected difference is perfectly linear, but observed difference flattens at the end. Difference between the expected linear & observed asymptote is the [underestimation of # substitutions]</p>](https://knowt-user-attachments.s3.amazonaws.com/5d63fd15-ca75-46f1-b940-50e92a05a535.jpg)
Jukes Cantor Correction
K = -3/4*ln(1-(4/3p)) … where K is the actual proportion of sites that changed, and p is the estimated proportion of sites that changed
What is p in jukes cantor
p = # obs difference / sites aka bases compared
We can estimate substitution rates for different site classes
Transition vs transversion
Coding vs non-coding
Amino acid vs silent
We can estimate substitution rates of insertion and deletion
Single base pairs
STRs/Microsatellites
Transposable elements
Tree of Life
With more genome sequences from increasing numbers of species, it’s now possible to measure substitution rates along branches of the TREE OF LIFE
Are individuals from the same species identical at most sites in the genome?
Yes, most sites will have the same base
Within species variation (average number of pairwise differences per site) of drosophila, arabidopsis, elegans, and humans
drosophila 0.01
arabidopsis 0.008
elegans 0.003
humans 0.001 (even adjusted for genome length, we have lower variation)
Differences among species in within-species variation are smaller than expected
Pairwise diversity varies over 3 orders of magnitude, approximate pop size varies over 10 orders
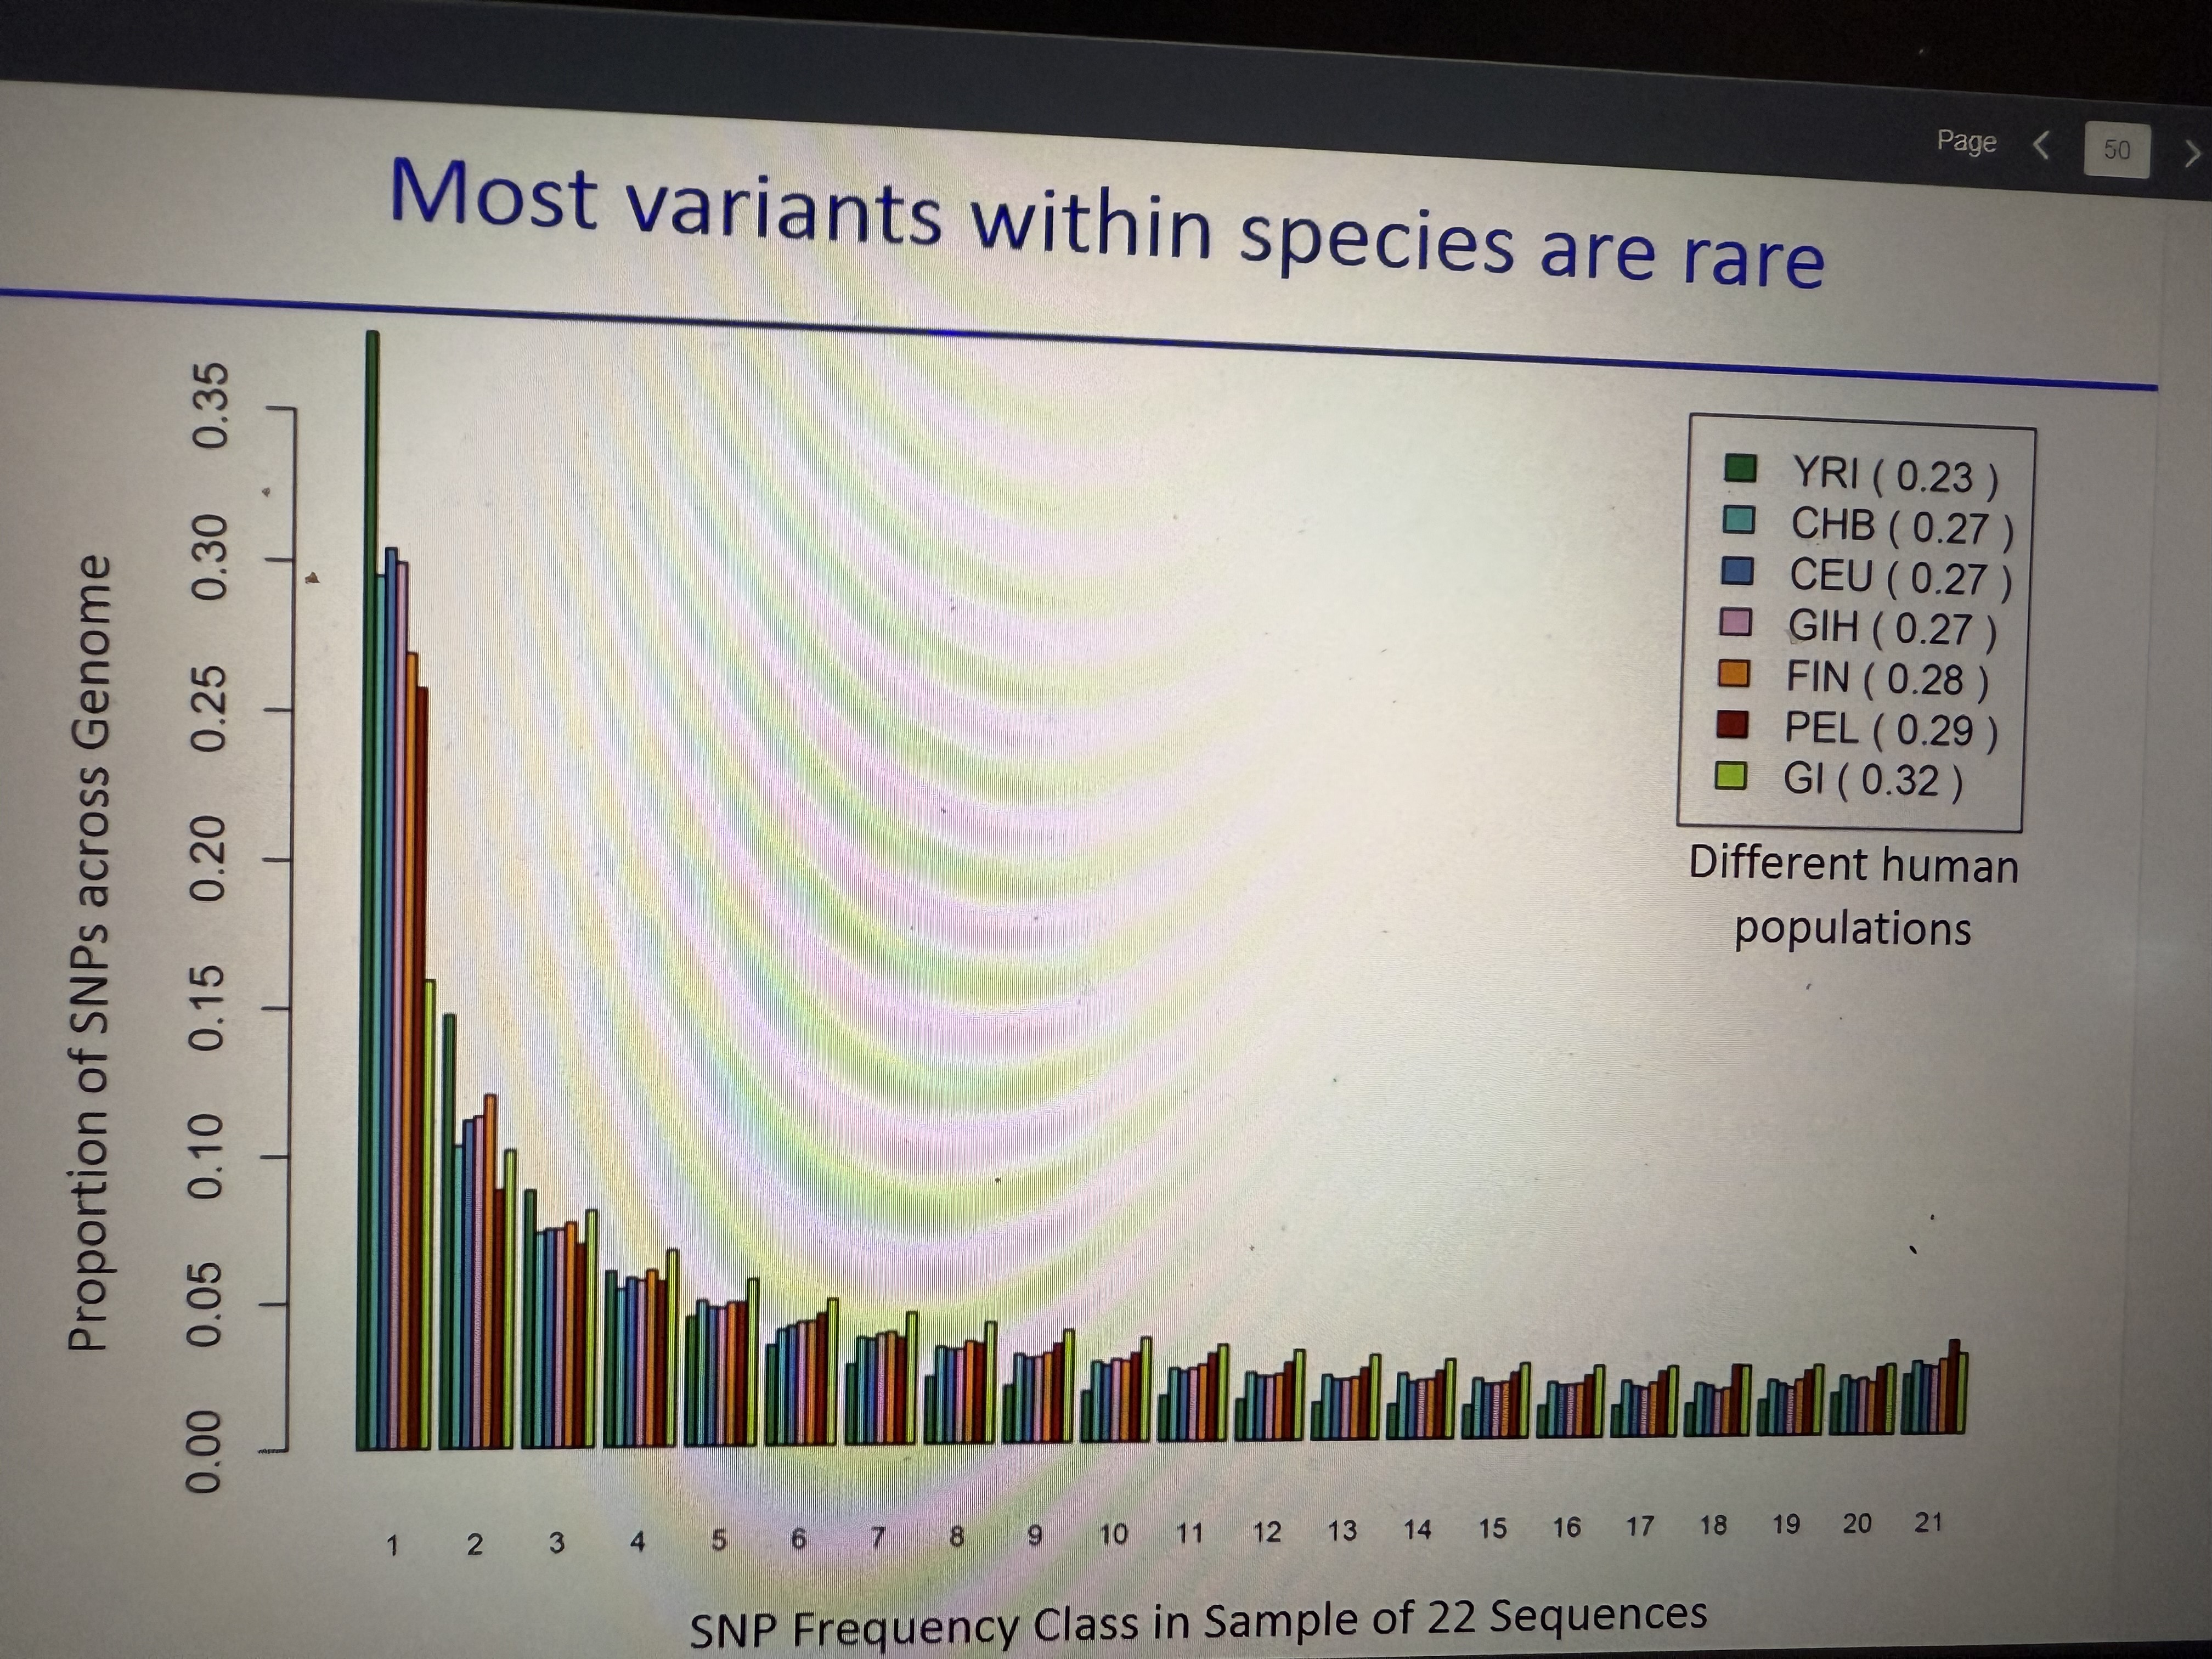
SFS varies among populations
Thus us because diff pops have diff histories (finland, pakistan, etc). Most variant sequences are lower frequency
What is the trend of rare variants in SFS (covered in Human Genetics)
amt of SNPs found in 1/22 genomes >>> amt of SNPs found in 21/22 genomes.
Because super rare RECENT variants pop up all the time whereas it takes generations for variants to become more common
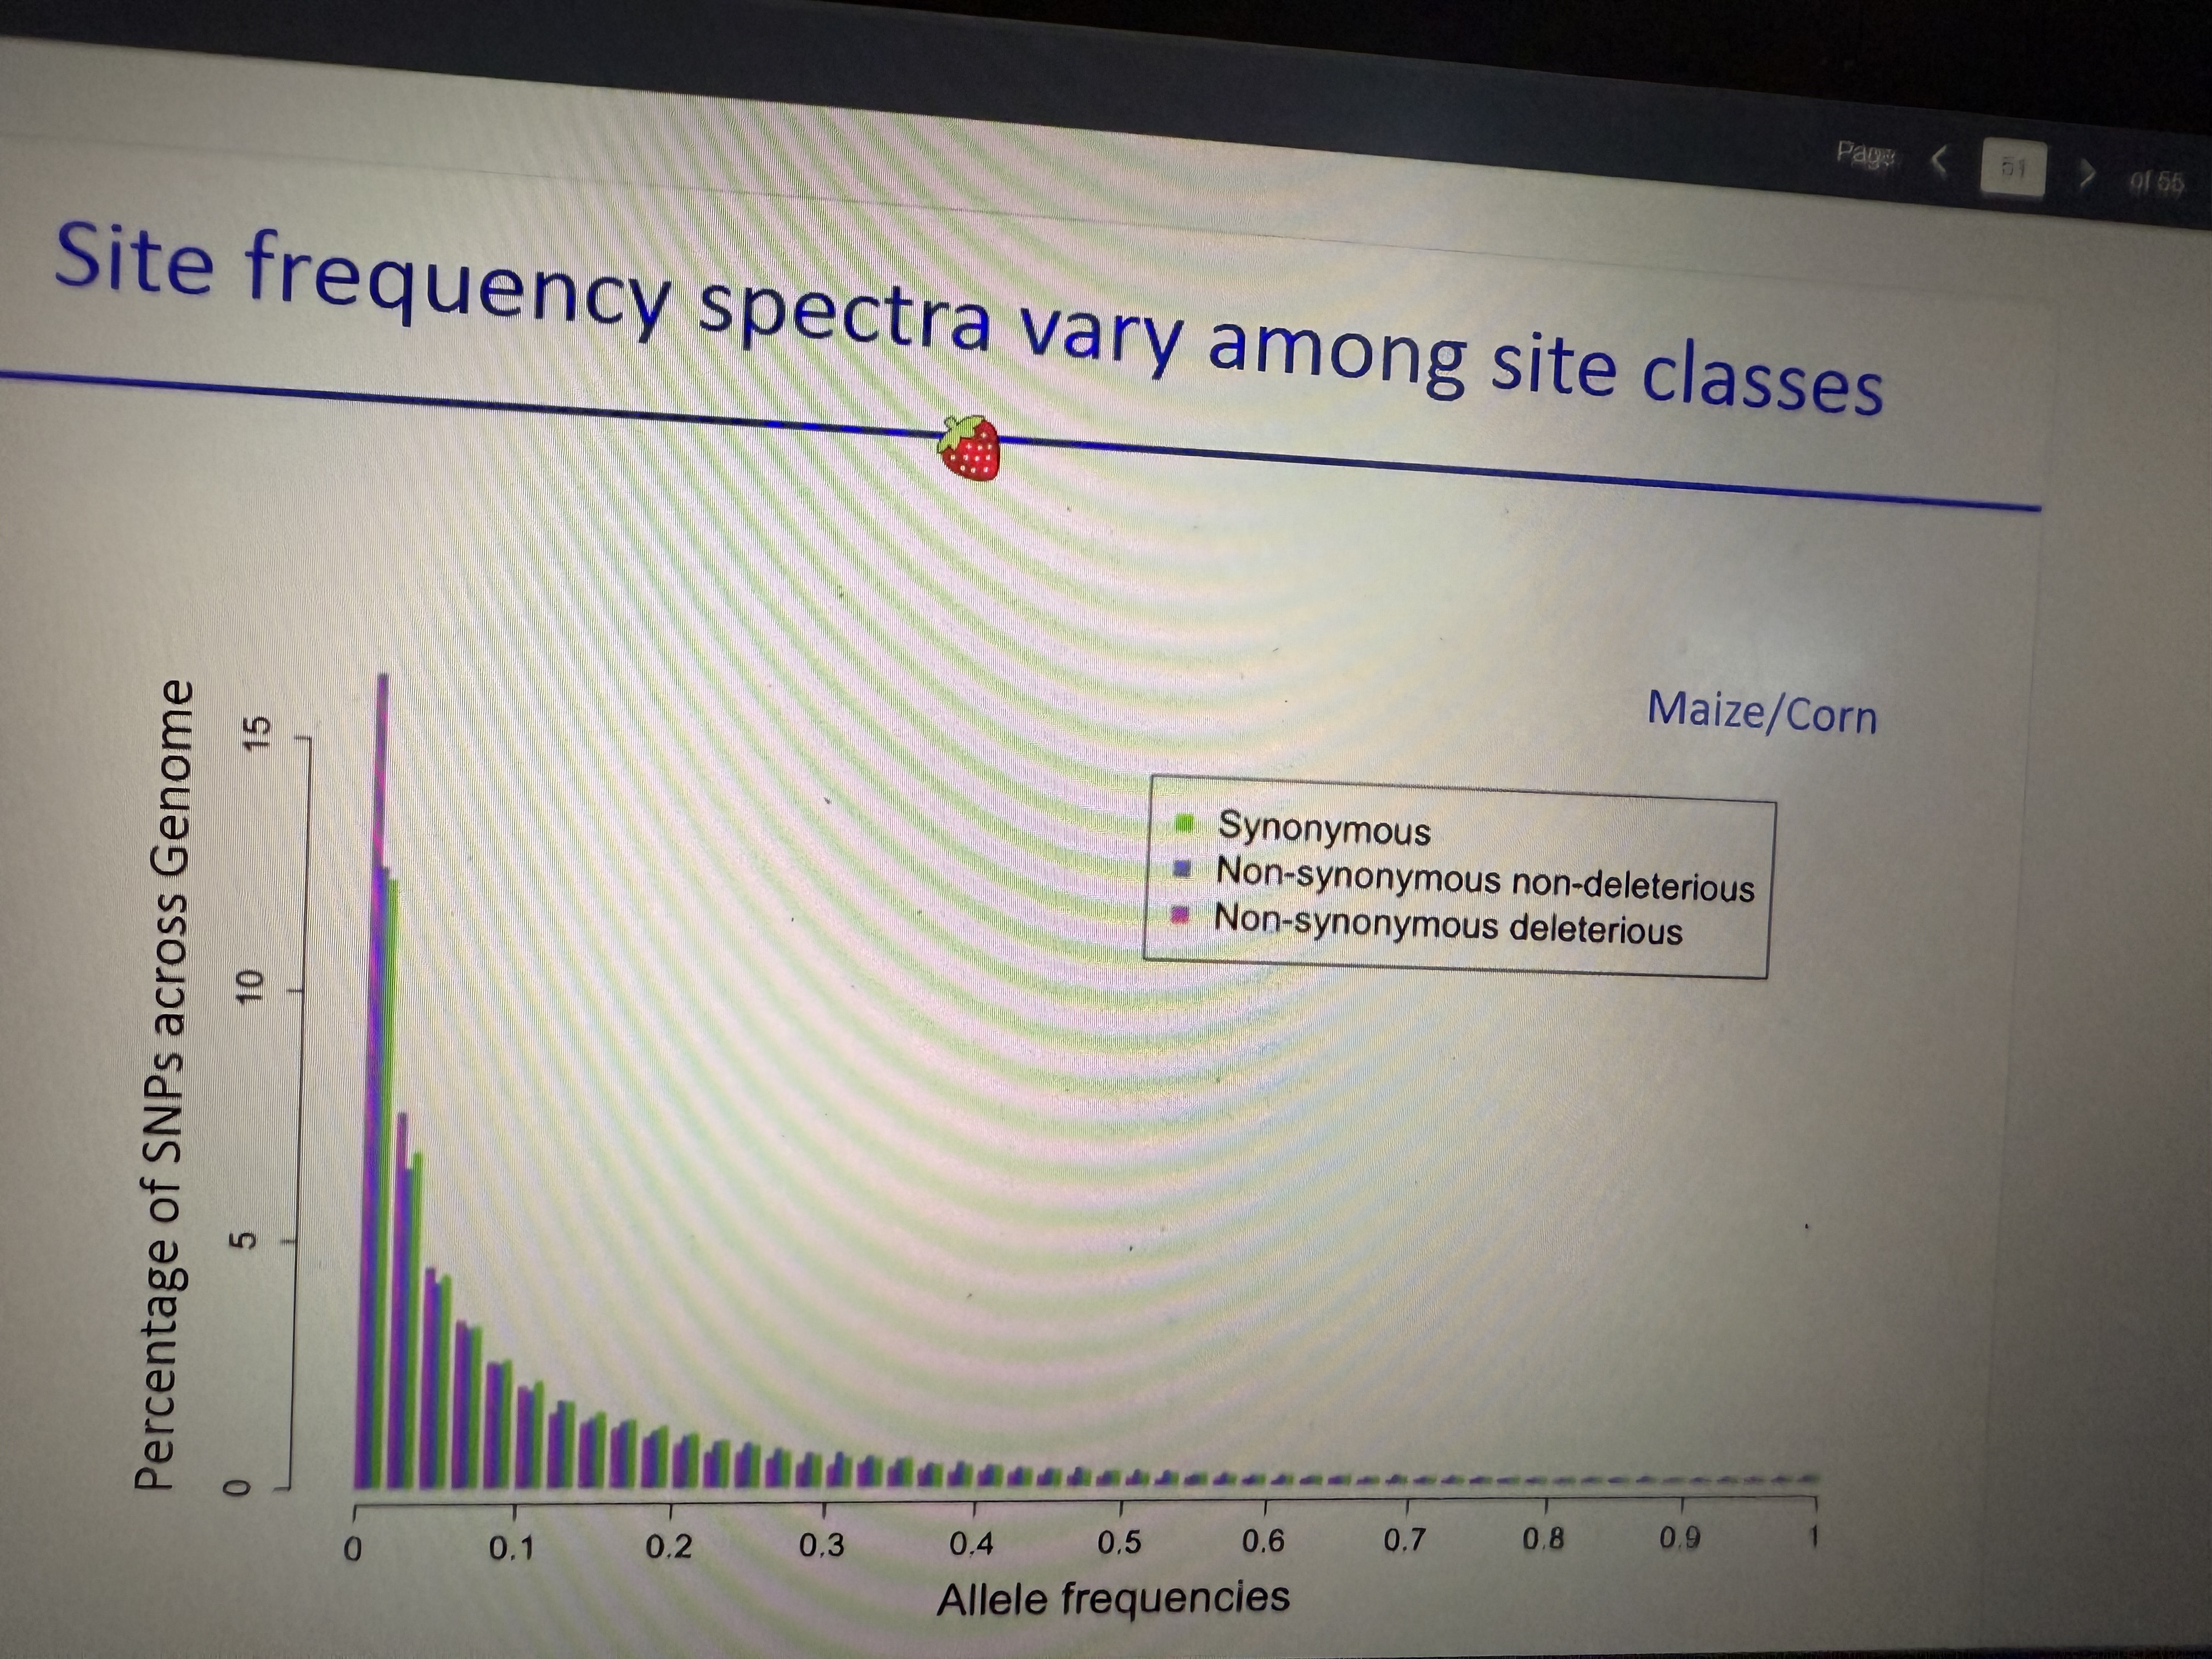
SFS varies among site classes
Synonymous vs non-synonymous non-del vs non-synonymous del…
Ex: In maize, non-synonymous del mutations are a higher percentage of SNPs in the 0.001% bin
Trend: Sequence divergence increases with time
True (bc of mutation accumulation) & MORE CLOSELY RELATED species have less sequence divergence (common sense)
Substitution rates vary among different lineages (even linages of similar species [EX: Enterococcus species])
True
How do SNPs/Variation arise?
Point mutations
How do you measure how often point mutations happen?
Mutation-accumulation experiments (Maintain inbred lines by selfing or sibling mating to keep population size small [that way the effects of selection are minimized])
Mutation-accumulation steps?
1) Conduct inbred line experiment
2) Sequence genomes
3) Count mutations
4) Divide the count by number of generations to estimate the mutation rate
Nuclear mutation rates in eukaryotes and prokaryotes are? [IMPORTANT BC HE REPEATED IT IN LATER LECTURE]
10^-10 to 10^-8 per site per generation
(If you randomly choose a base, this is the chance that it will mutate after 1 round of reproduction)
Nuclear mutation rate trends?
Nuclear mutation rates can be orders of magnitudes higher in VIRUSES
Transitions occur 2x more than transversions
KA, KS, KA/KS
KA = non-syn mut rate
KS = syn mut rate
KA/KS is their ratio
Genetic Drift
The random effect of biologically random sampling on sequence variation
(Drifting frequency of an allele relative to others in a population as a result of chance/stochastic events)
Basic principles of genetic drift?
Direction of allele frequency change is RANDOM (can be up or down)
After enough time, the allele is either LOST or FIXED
Drift reduces sequence variation (homogenizes population)
Variation is lost faster in smaller populations
Mutation & Drift Feedback Loop
Mutation adds variation, drift removes variation
How do you measure the expected level of sequence variation within a species?
Average number of pairwise differences (π)
Formula: π = 4*Ne*μ
Where Ne is the effective population, and μ is the mutation rate per locus per site (think MIUtation rate to remember)
[assume autosomal seq, diploid, no selection]
Calculate Expected Sequence Divergence?
Exp Seq Div = 2*μ*t
Find MRCA & two branches (two offshoot species)
Mutation rate is μ & multiply 2 (TWO BRANCHES) by number of generations since MRCA (t)
Assumed no selection, have to account for multiple substitutions if t is large
The neutral theory of molecular evolution states…
Most mutations that effect fitness are deleterious & removed by selection
Most sequence variation within species/divergence between species us NEUTRAL (due to drift, not selection)
THIS SERVES AS THE NULL HYPOTHESIS FOR EXPERIMENTS MEASURING SELECTION
Purifying and Positive Selection
Mutation produces heritable sequence variation in a trait affecting survival/reproduction
Purifying: Removes deleterious variants from WITHIN species, LIMITS SEQUENCE DIVERGENCE BETWEEN SPECIES
Positive: Fixed beneficial variants within species, INCREASES SEQUENCE DIVERGENCE BETWEEN SPECIES
Most proteins experience purifying selection, why?
In most species, the synonymous substitution rate in proteins >>>> the non-synonymous. Proteins are easy to mess up & hard to enhance via mutation. So oftentimes, mutations in proteins are deleterious and experience purifying selection.
Synonymous divergence predicts what non-synonymous divergence SHOULD be under neutrality (aka no selection)
This makes sense because synonymous mutations tend not to affect phenotype at all, so they’re subject to no selection. So in a hypothetical system with no selection, non-synonymous would behave similarly
Selection sweep
A beneficial mutation might arise in an individual, then experience positive selection → fixation. This causes a localized reduction in the populations nucleotide diversity in that section of the chromosome
It brings neutral variants along with it (hitchhikers)
Trend on graph for fixation/positive selection sweeps
Valley of π (avg # of pairwise differences) along chromosome in entire population.
OR
Spikes of FST tell you fixation has occurred
So it locally decreases variation IN a population, but increases sequence variation between populations.
Kachroo et al. Paper 2015: Do orthologs have conserved function?
Conclusion: Replaced yeast genes with human orthologs, 47% of essential yeast genes could be successfully humanized when replaced with their human orthologs. Suggests some retention of function between orthologs despite long history of evolutionary divergence.
Rogozin et al. 2014 - Is ortholog function more conserved than paralogs?
Conclusion: In general, when background noise is taken into account & Z scores are calculated, between-species orthologs express greater expression similarity than paralogs. This AGREES with the Ortholog Conjecture but acknowledges that OC is only one aspect of gene evolution.
Orthologs >> Within-species paralogs > Between-species paralogs
Soria et al. Paper 2014: Do paralogs exhibit functional divergence?
Summary: There are significant levels of functional divergence of ohnolog (arose from gene duplication) pairs within phenotypic levels (protein, gene expression, organismal growth) but the functional divergence across these levels varied. NEARLY ALL OHNOLOG PAIRS SHOWED FD by at least one measure, aka displayed FD.
Methods: 499 S. Cerevisae ohnolog [subset of paralogs, arise from WGD] pairs present in 4 other post-WGD species in the S. clade were identified via synteny. Got protein sequence data, gene expression data, and organismal phenotype data of the 499 ohnologs in the 5 species to measure functional divergence. Identified type I (evolutionary rate-based) and type II (AA sequence-based) FD, and used quantitative values to calculate Pearson’s correlation coefficient which showed whether FD in one level can predict FD in another. Overall they found that FD had strong internal correlation (protein-level analyses all agree), but it had weak external correlation (protein-level analyses won’t agree with organismal level). But that nonetheless, paralogs/ohnologs DO display FD.
Zhang et. al: What determines the rate of protein evolution
Found that the evolutionary rate of a protein is predominantly influenced by it’s expression level rather than by functional importance.
Hypotheses include:
mRNA-folding requirement: Highly expressed genes may evolve slowly to preserve optimal mRNA secondary structures that enhance translational efficiency and stability
Protein misfolding avoidance: Proteins expressed at high levels are under strong selection to avoid misfolding, as misfolded proteins can be toxic and energetically costly.
Protein misinteraction avoidance: Abundant proteins must avoid unintended interactions with other cellular components, leading to evolutionary constraints that minimize indiscriminate binding.
Expression cost: The energetic and resource burden of producing proteins imposes selection against unnecessary or inefficient sequences, especially in highly expressed genes.
These all serve to explain the E-R Anticorrelation and why it exists
E-R Anticorrelation
The anticorrelation of expression and evolutionary rate that is seen across ALL DOMAINS OF LIFE and THROUGHOUT THE GENOME.
Xu et al: Determinants of genome sequence variation
Methods: Sequenced 68 globally distributed genotypes of Giant Duckweed to asses genome-wide genetic diversity. They ALSO conducted mutation accumulation (MA) experiments under indoor/outdoor conditions to directly estimate the spontaneous mutation rate. WGS and variant-calling were used to identify de novo mutations & POPULATION GENOMIC ANALYSES were performed to estimate Ne and LD.
Conclusion: Despite its insanely high Ne, Giant Duckweed shows extremely low genetic diversity, which the authors attribute to a exceptionally low mutation rate (7x lower than other eukaryotes). This supports the drift-barrier hypothesis in which large Ne enables natural selection to reduce mutation rates. Mutation rate, not just Ne, shapes genome-wide variation