Correlations
1/16
There's no tags or description
Looks like no tags are added yet.
Name | Mastery | Learn | Test | Matching | Spaced |
|---|
No study sessions yet.
17 Terms
What is the difference between correlations and experiments?
Experimental designs require manipulation of the IV and a measurement of the resulting change in the DV. In a correlational study, no variables are manipulated, two co-variables are measured and compared to look for a relationship
What are co-variables?
The two factors/variables that are measured/collected by the researcher and then compared to each other
What are some examples of co-variables?
Age
IQ
Reaction time
Bank account balance
Number of pets
Height
Hostility level
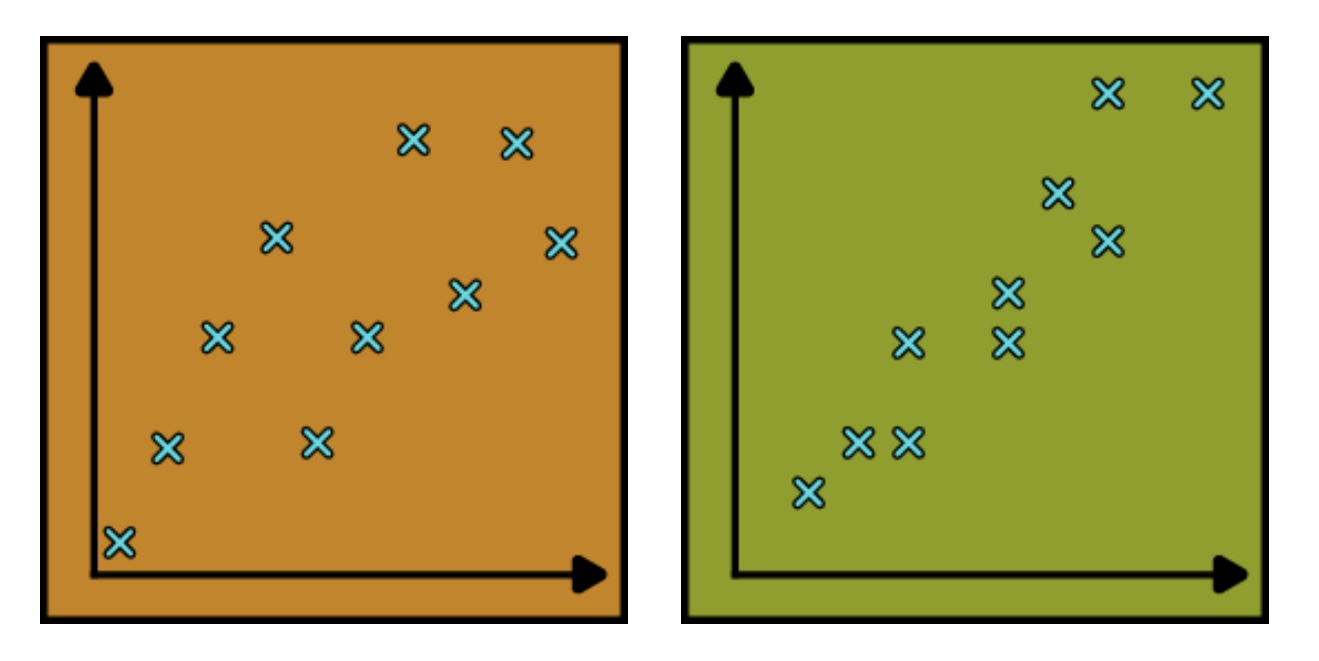
What is a scattergram?
A graph used to plot the measurements of two co-variables. Scattergrams visually display the relationship between co-variables
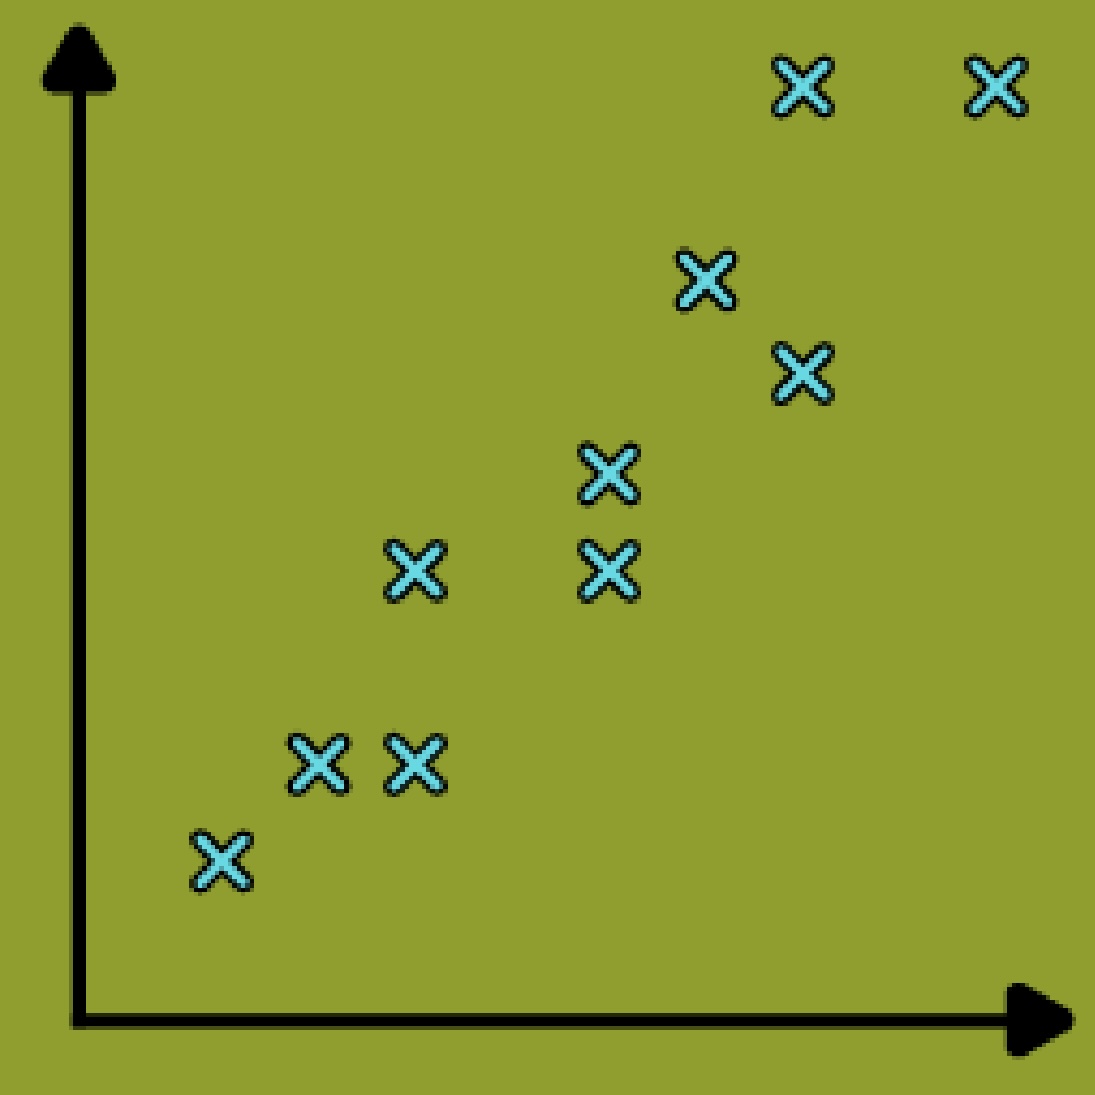
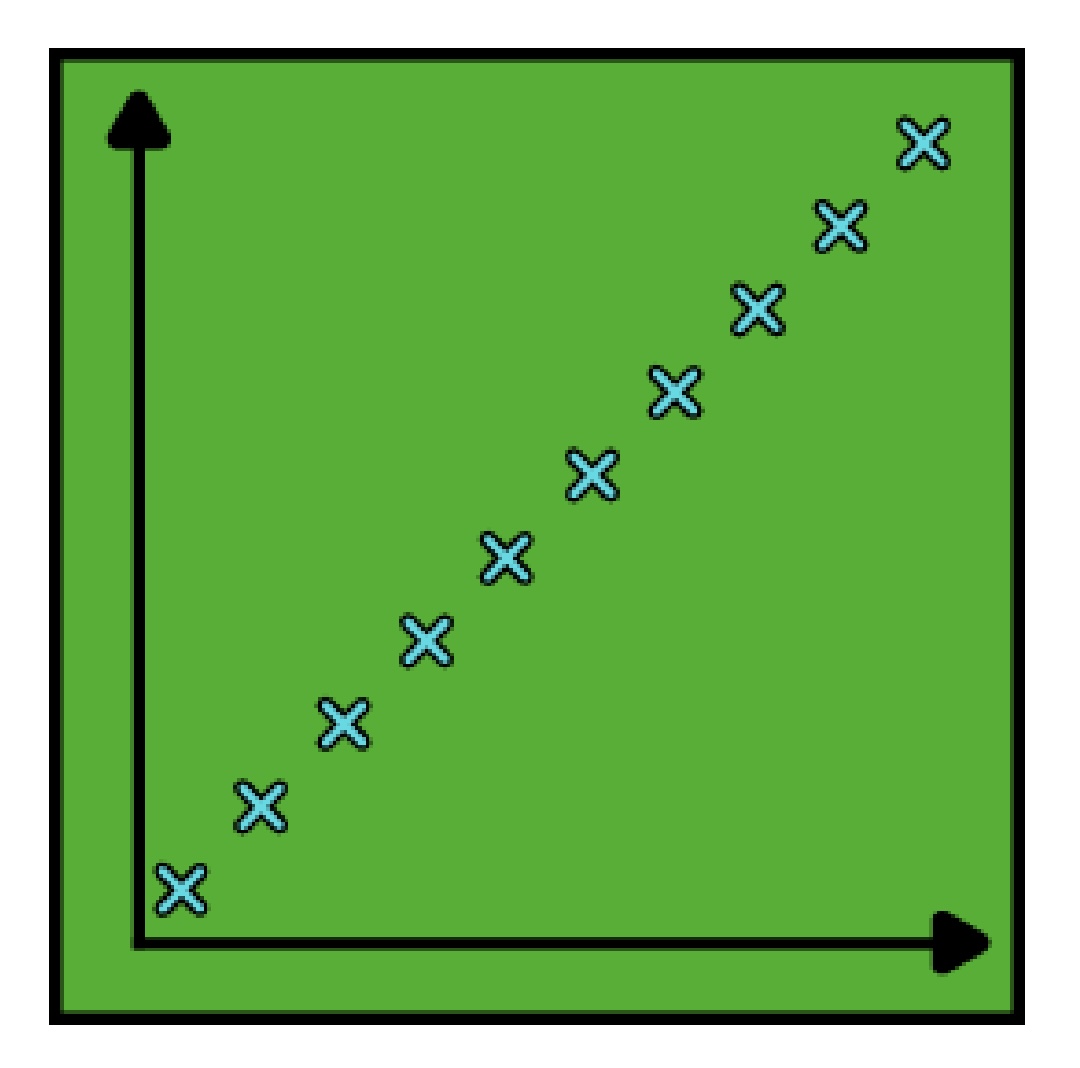
What is a positive correlation?
As one co-variable increases the other co-variable increases
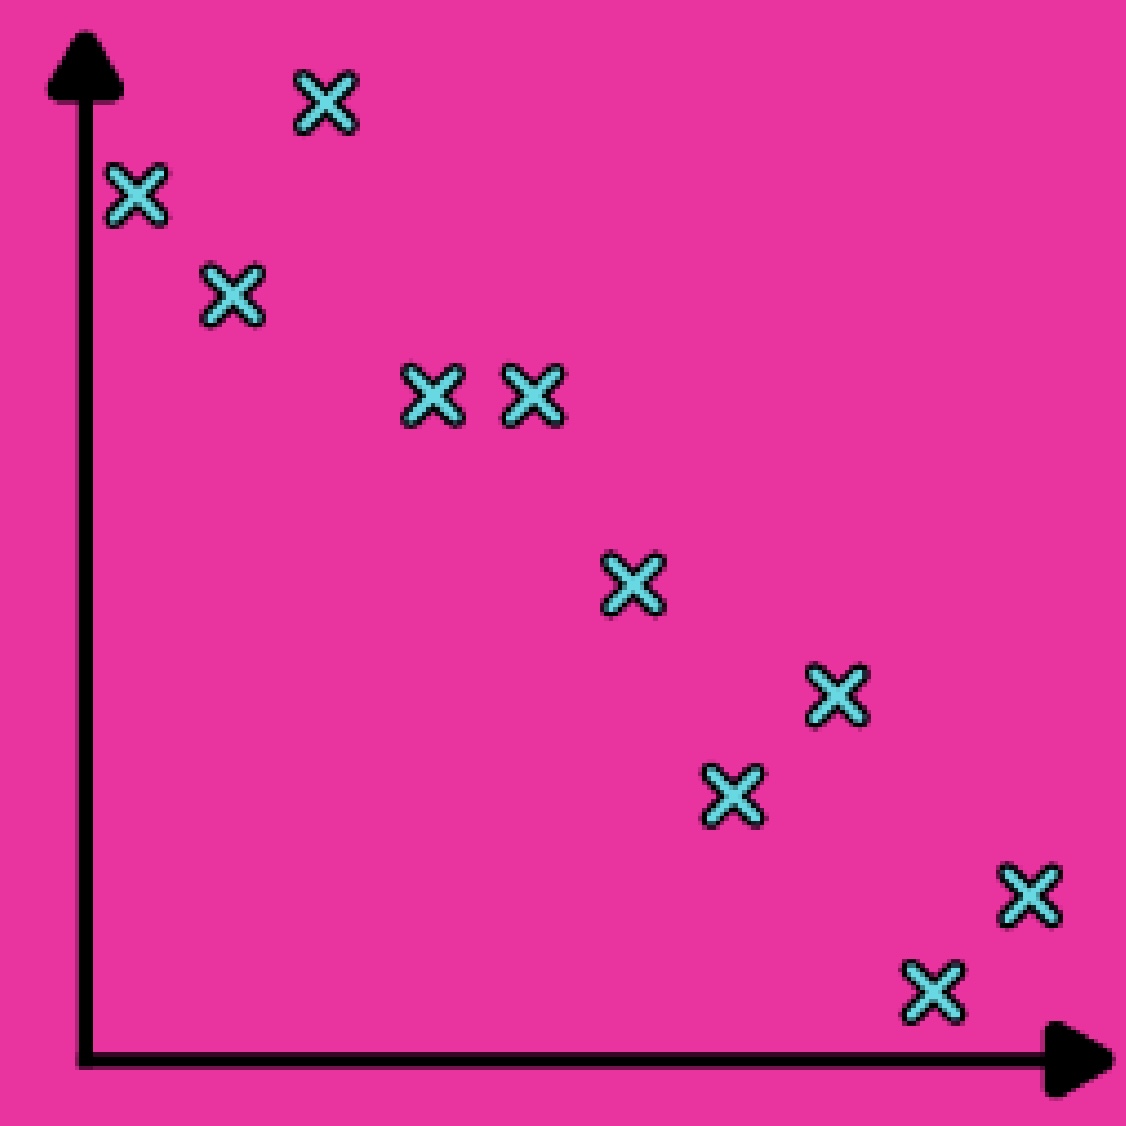
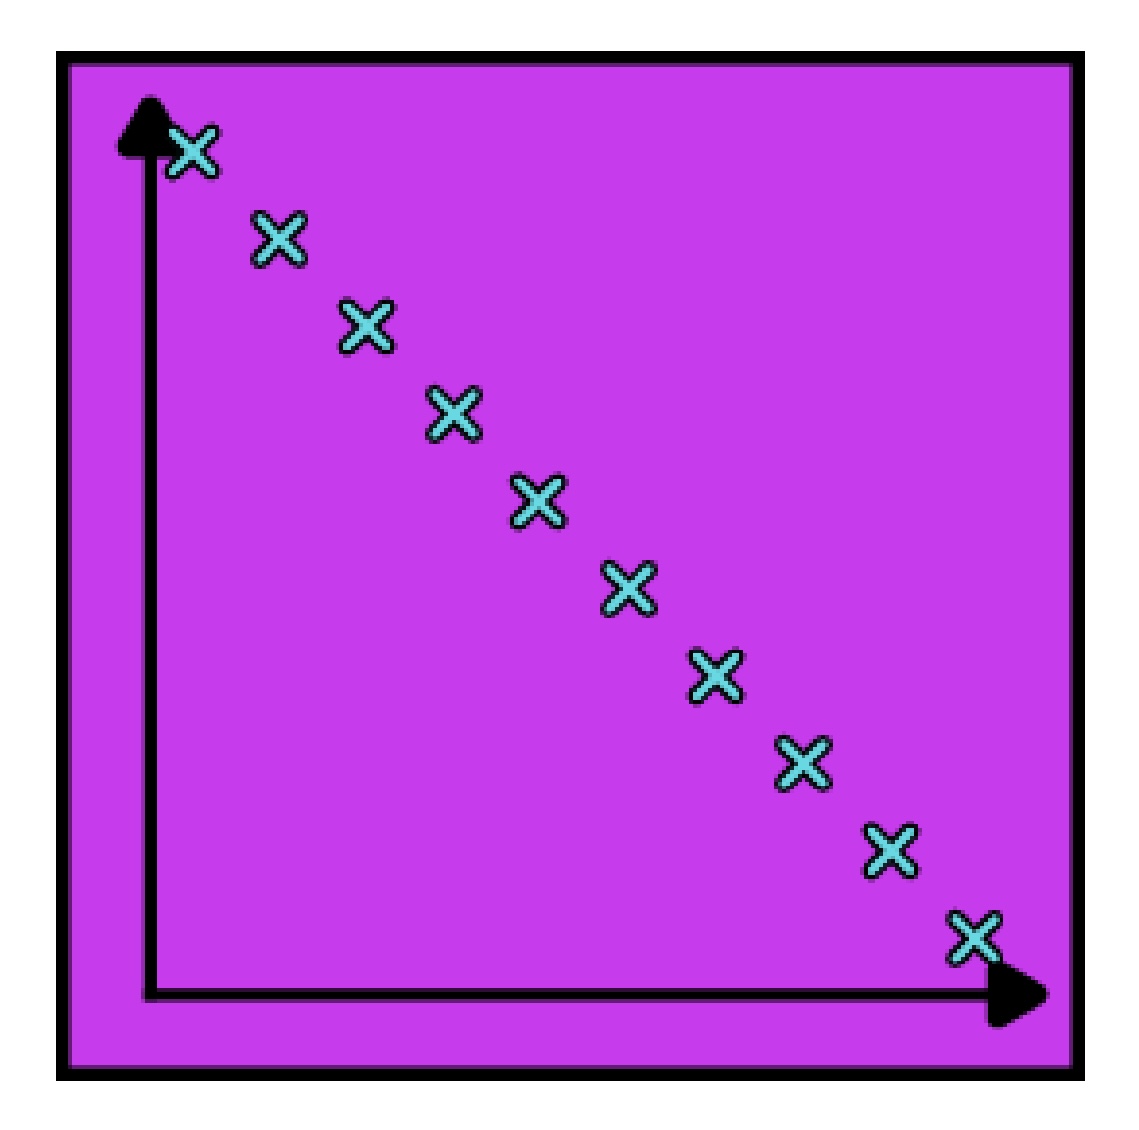
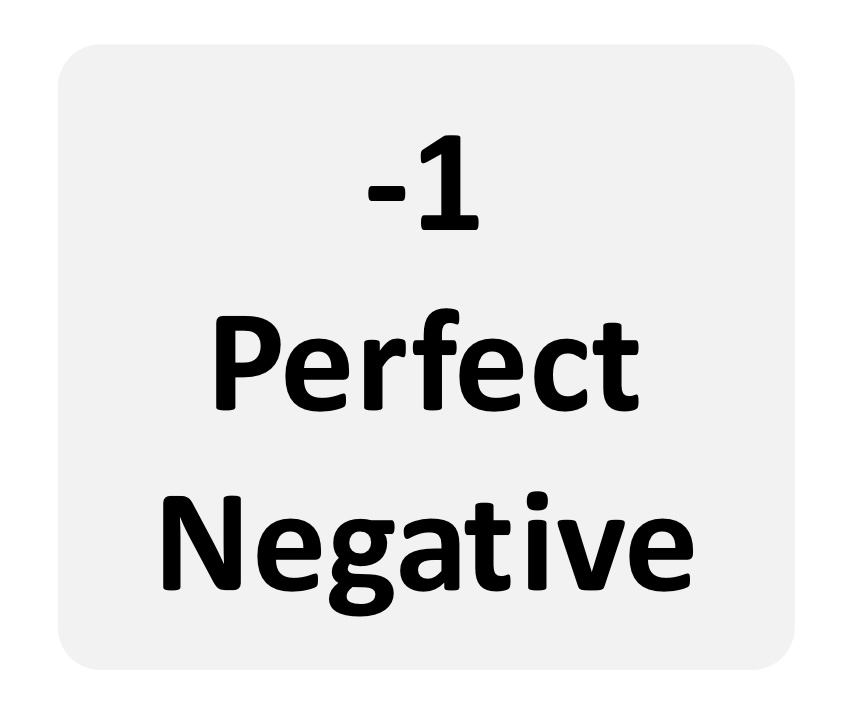
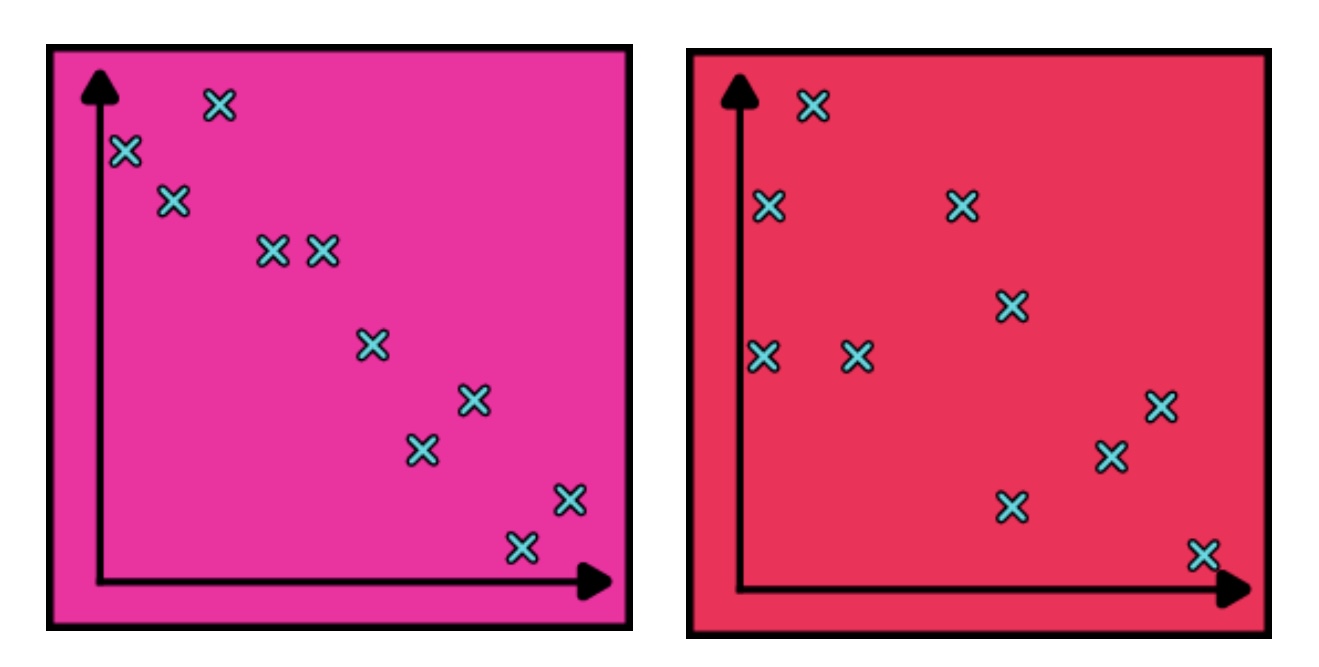
What is a negative correlation?
As one co-variable increases the other co-variable decreases
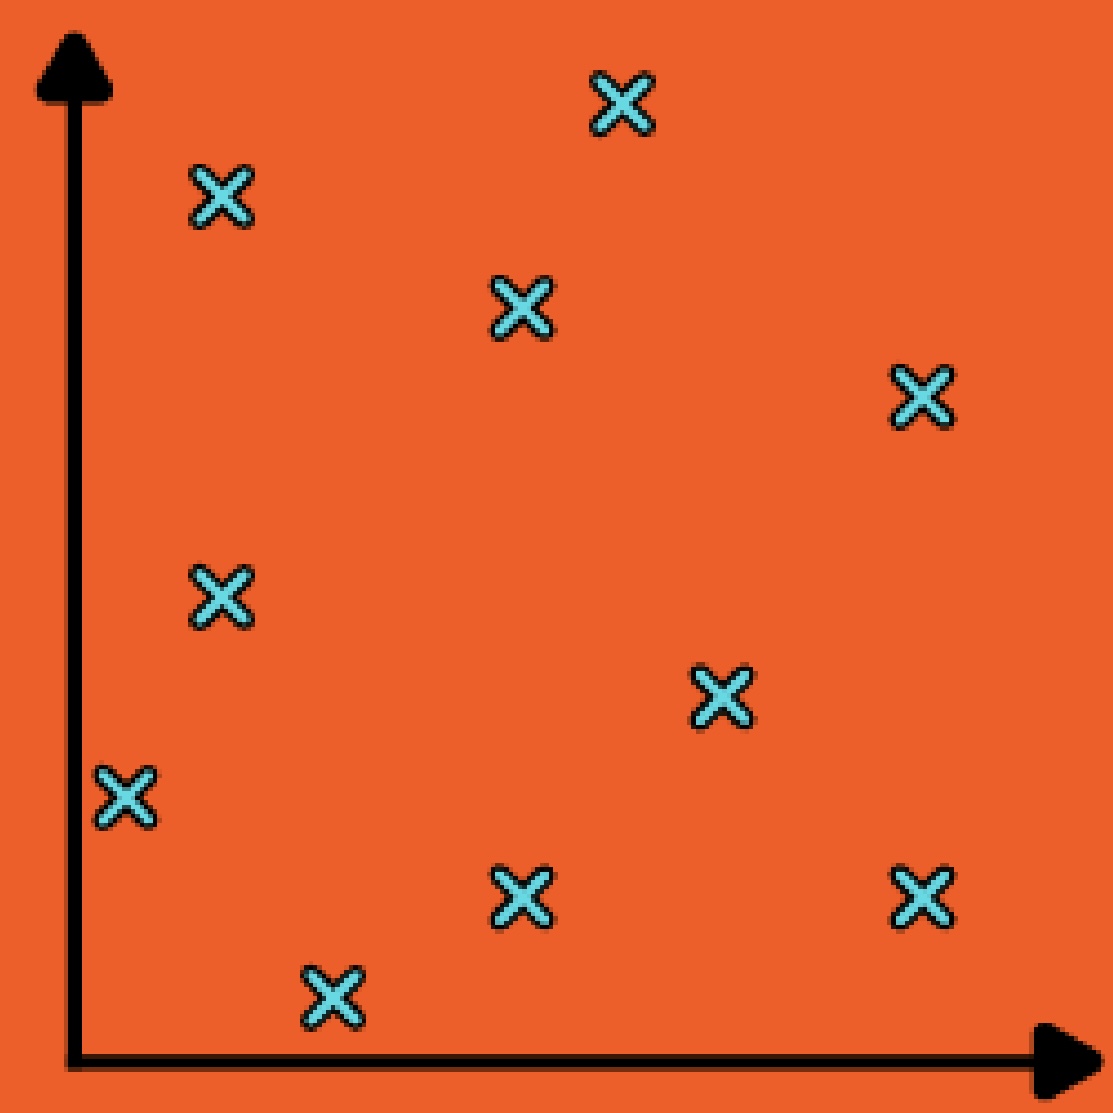
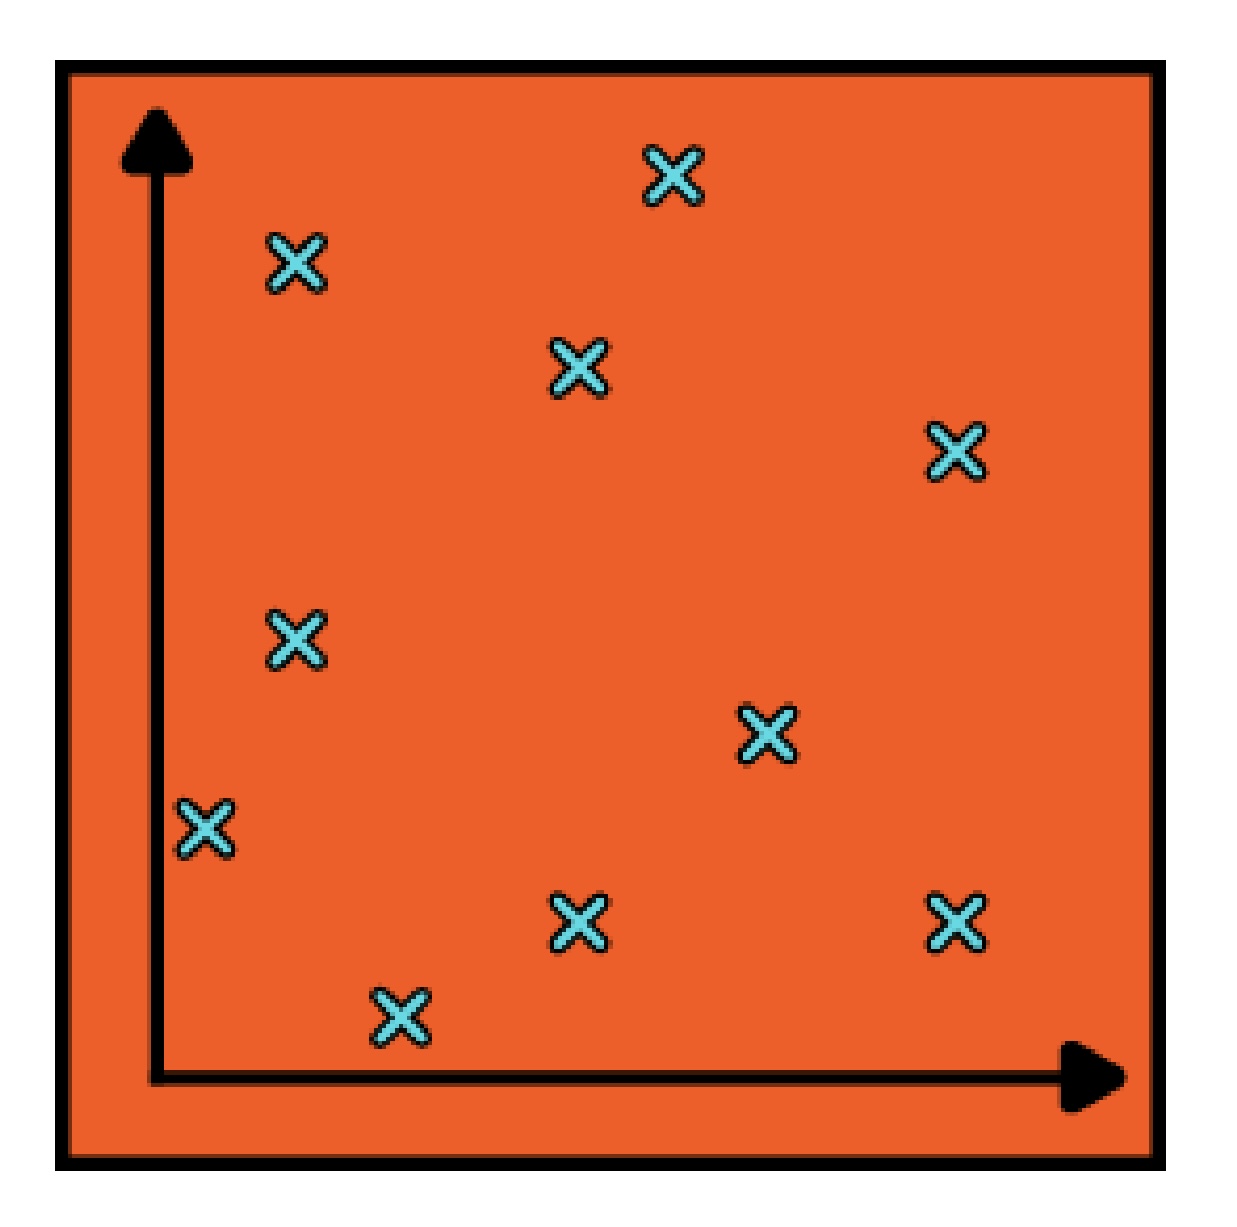
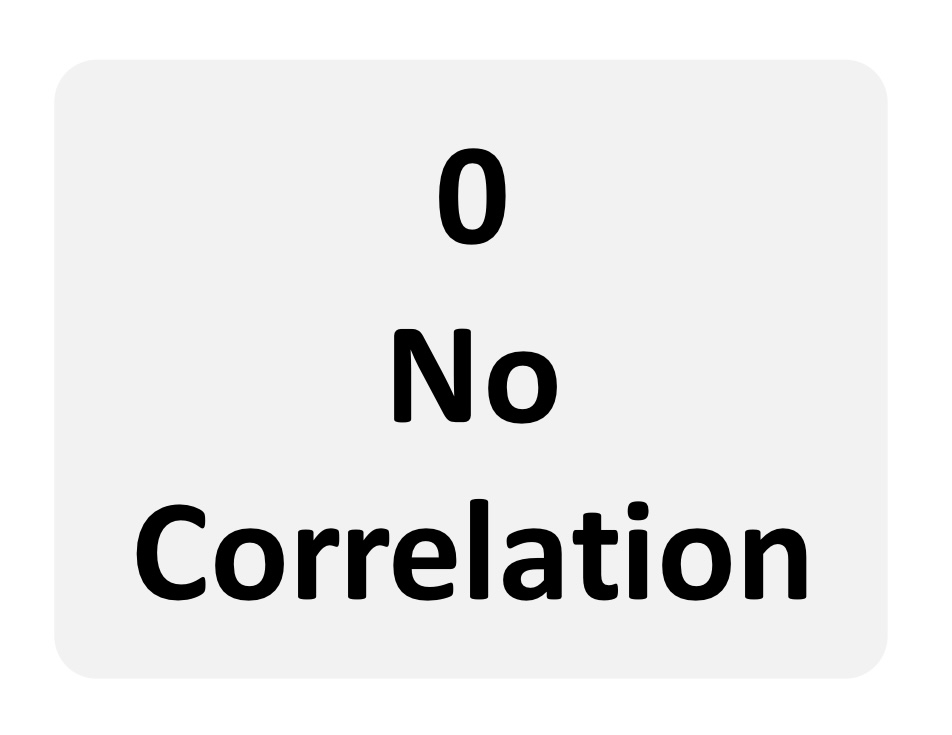
What is zero correlation?
There is no relationship between the values of the two co-variables
Analysis of the relationship between co-variables:
The strength and direction of a correlation can be described visually with a scattergram, or numerically with a correlation coefficient
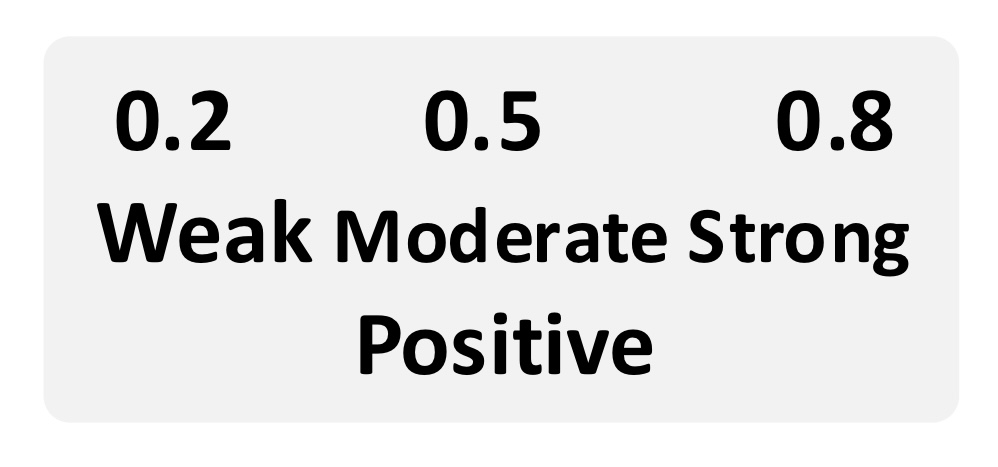
What is a correlation coefficient?
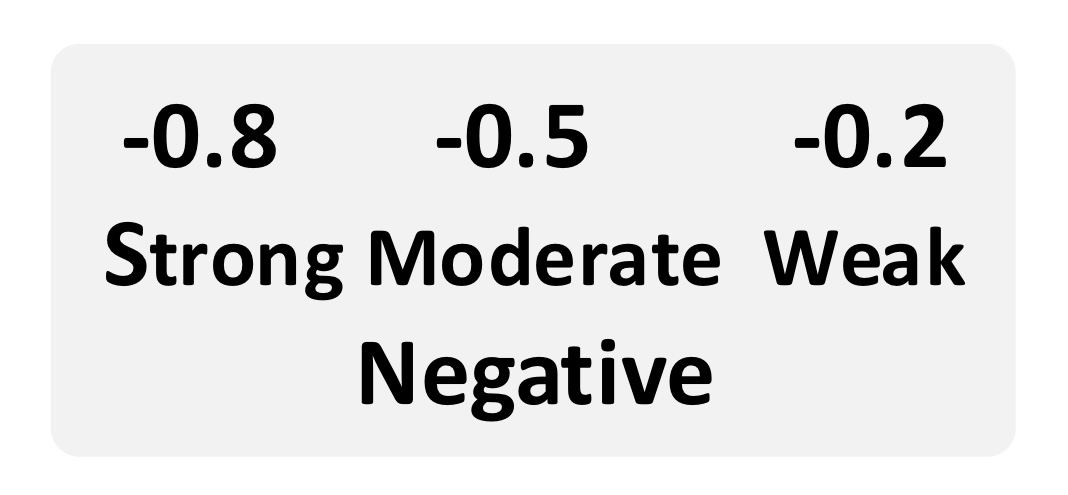
Represents both the strength and direction of the relationship between the co-variables as a number between -1 and +1
How are correlation coefficients calculated?
Using statistical tests such as Spearman’s rho or Pearson’s r. Inter-rater and test-retest reliability is assessed in this way. A correlation coefficient equal to or greater than 0.8 is usually judged to show a strong correlation
AO3 - Limitations
Correlation does not show causation. While a strong correlation may suggest a relationship exists between two variables, it does not show which co-variable led to the change in the other co-variable and there is the possibility that an unknown third variable caused the change in both covariables
AO3 - Strengths
Correlational studies can highlight potential causal relationships, these can then be tested with experimental methods to discover cause and effect relationships
Often the co-variable data already exists and is easily accessible, this means there is usually few ethical problems in data collection
Correlation coefficient is a useful tool in describing both the direction and strength of relationships between factors