Production, Costs, and Industry Structure in Microeconomics
1/56
There's no tags or description
Looks like no tags are added yet.
Name | Mastery | Learn | Test | Matching | Spaced |
|---|
No study sessions yet.
57 Terms
Private enterprise
the ownership of businesses by private individuals
Production
the process of combining inputs to produce outputs
Firm
an organization that combines inputs of labor, capital, land, and raw or finished component materials to produce outputs.
Revenue
the income a firm generates from selling its products.
Profit
the difference between total revenue and the opportunity costs of resources used in production
Total Cost
consists of Explicit and Implicit costs
Explicit costs
out-of-pocket costs; actual outgoing payments showing on the accounting statement.
Implicit costs
the opportunity cost of using resources that the firm already owns.
Accounting profit
the difference between dollars brought in and dollars paid out, does not account for implicit costs.
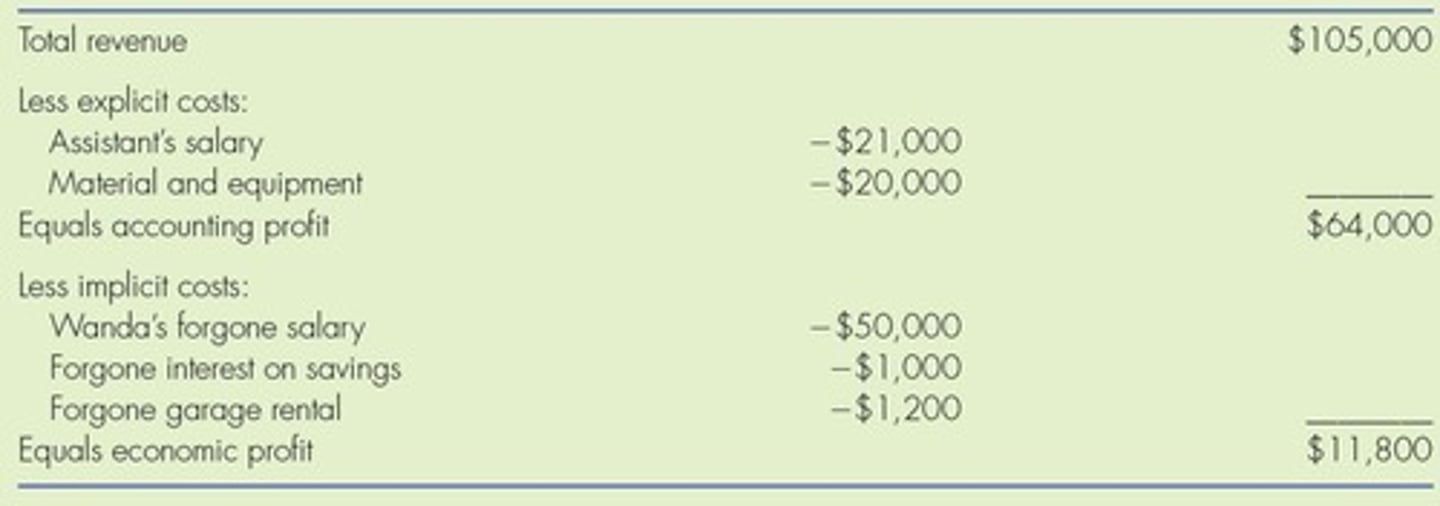
Economic profit
takes both explicit and implicit costs into account.
Production function
mathematical equation that tells how much output (Q) a firm can produce with given amounts of the inputs.
Fixed inputs
factors of production that can't be easily increased or decreased in a short period of time
Variable inputs
factors of production that a firm can easily increase or decrease in a short period of time
Short run
period of time during which at least some factors of production are fixed.
Long run
period of time during which all factors are variable.
Total product (TP)
the firm's total output.
Marginal product (MP)
Change in total product from an additional unit of resource
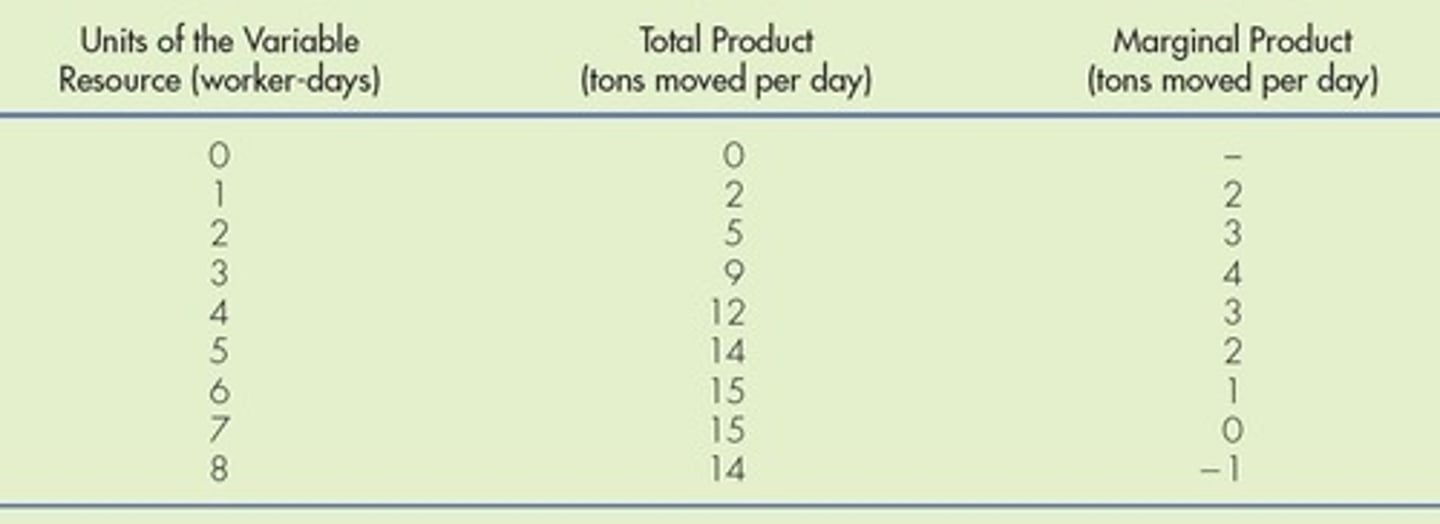
Law of Diminishing Marginal Productivity
general rule that as a firm employs more of one variable input, eventually the amount of additional output produced as a result of adding one more unit of that input declines.
Marginal cost (MC)
Change in total cost resulting from a one-unit change in output
Variable costs (VC)
costs of the variable inputs, like labor.
Fixed costs (FC)
costs of the fixed inputs, like rent.
Total cost (TC)
the sum of fixed and variable costs of production
Total Cost Formula
TC = FC + VC
Marginal Cost Formula
MC = ∆TC/∆q
Increasing marginal returns
MC falls
Diminishing marginal returns
MC increases
Total product curve
general case of total product curve.
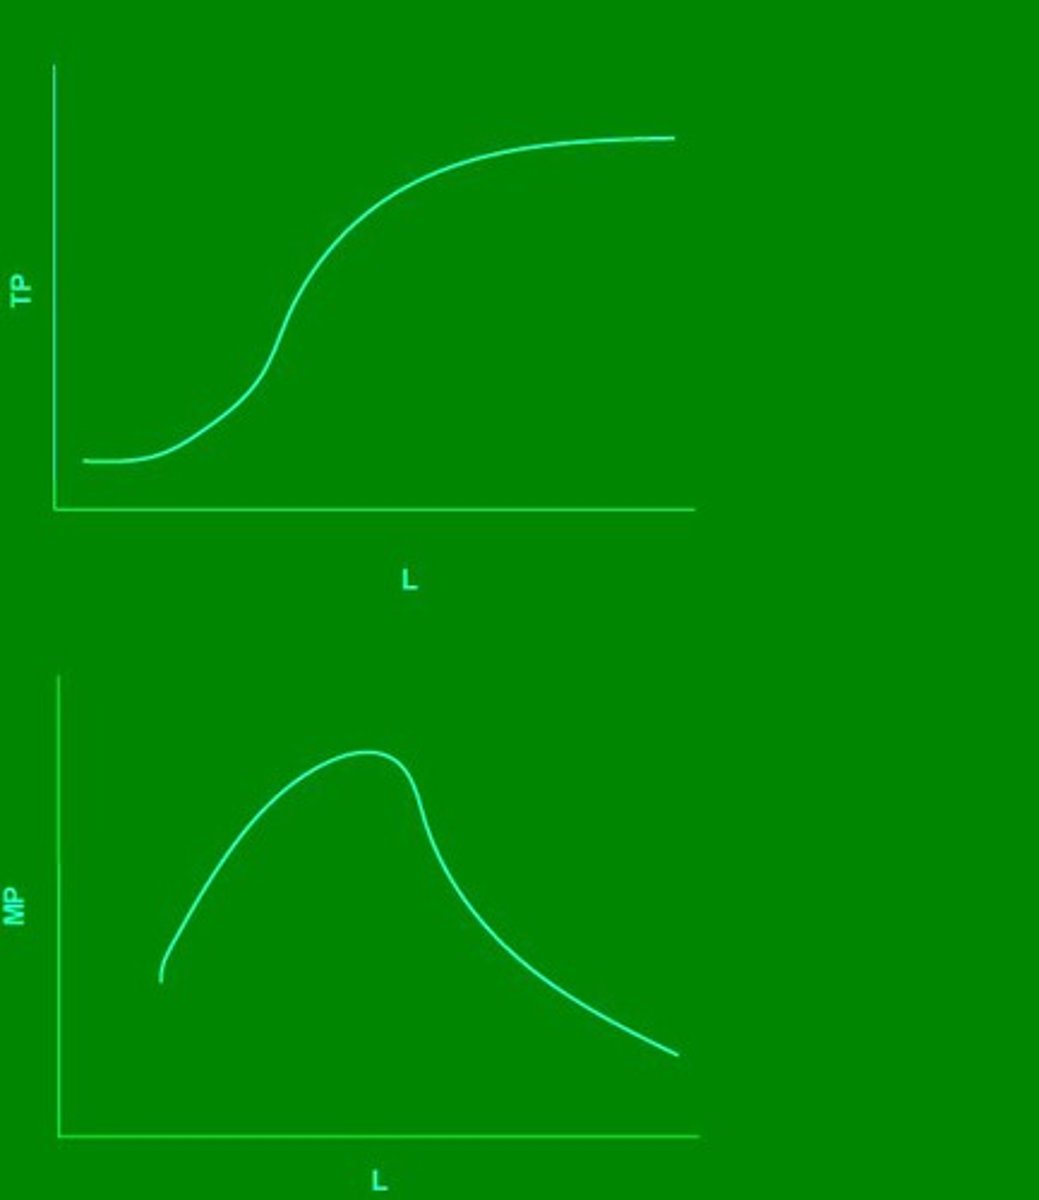
Marginal product curve
general case of marginal product curve.
Average Variable Cost (AVC)
Variable cost divided by quantity produced.
Average Fixed Cost (AFC)
Fixed cost divided by quantity produced.
Average Total Cost (ATC)
Total cost divided by output or sum of AVC and AFC.
Marginal Cost (MC)
Additional cost of producing one more unit.
U-shaped Cost Curves
Average costs decline, reach minimum, then rise.
Law of Diminishing Marginal Returns
Adding input yields progressively smaller increases in output.
Average Profit
Price minus average cost; indicates profitability.
Sunk Cost
Costs that cannot be recovered once incurred.
Long Run
Period when all costs are variable.
Economies of Scale
Lower average costs as production scale increases.
Diseconomies of Scale
Higher average costs as production scale increases.
Long-Run Average Cost Curve
Lowest average cost at each output level.
Constant Returns to Scale
Average cost remains unchanged with proportional input changes.
Minimum Efficient Scale
Lowest output level for full economies of scale.
Short-Run Average Total Cost Curves
Curves representing average costs for different plant sizes.
Planning Curve
Long-run average cost curve; U-shaped.
Traffic Congestion
Increased costs due to overcrowding in operations.
Fixed Costs
Costs that do not change with output level.
Variable Costs
Costs that vary directly with output level.
Average Cost Intersection
Where MC intersects AVC or ATC indicates minimum point.
Output Level R
Point where low-cost firms operate efficiently.
Output Level A
Minimum efficient scale; lowest average cost achieved.
Output Level B
Point beyond which diseconomies of scale occur.
Short-Run Costs
Costs when at least one input is fixed.
Long-Run Planning
Firms adjust all inputs for optimal production.
Cost of Hiring Barbers
Variable cost incurred per barber employed.
Overhead
Common term for fixed costs in business.
Cost Curves Graph
Visual representation of MC, AVC, and ATC.
Barbershop Fixed Costs
Costs like space and equipment for operation.