Research in clinical psychology
1/64
There's no tags or description
Looks like no tags are added yet.
Name | Mastery | Learn | Test | Matching | Spaced | Call with Kai |
|---|
No study sessions yet.
65 Terms
Types of research questions
Descriptive
Casual
Correlational
Types of research
Experiment
Quasi-experiment
Correlational (Case-control studies)
Comparative (ex post facto)- אין מניפולציה על משתנים, הקבוצות מוכנות.
Developmental (cross sectional, longitudinal)
Survey
Basic approaches in research
Hypothesis testing vs. exploratory research
Deductive (test of theory) vs. inductive approach (developing a theory)
Idiographic (individual) vs. nomothetic (generalized) research
Quantitative vs. qualitative approach
Internal validity
The degree to which observed differences on the dependent variable are directly related to the independent variable, not some of the (uncontrolled) variable
Threats of internal validity
• Selection bias
• Experimenter bias
• Maturation -natural changes within participants as a the function of the passage of time
• History effect - Effect of specific events between first and second measurement
• Testing effect- Effect of passing one test on the result in the next test
• Instrumentation changes- Changes in the measuring instrument or measurement procedures (also differences in clinicians)
• Statistical regression -occurs when participants are selected based on extreme scores on a particular measure
• Experimental mortality - loss of participants
External validity
The extent to which the (internally valid) results of a study can be generalized beyond the conditions of the experiment to other populations, settings, and circumstances
Threats of External Validity
• Sample characteristics - representativeness
• Stimulus characteristics and settings - Setting, experimenter, interviewer,
• Reactivity to experimental arrangements -Awareness that subjects are participating in an investigation
• Multiple-Treatment interference- order of intervention,
• Test sensitization - pretest sensitization of the participant
• Novelty effects- changes in participants' behavior, performance, or responses that occur due to the introduction of new stimuli, tasks, or conditions in a research study.
• Timing of measurement
Instrument Validity - definition
Appropriateness, meaningfulness, usefulness of the specific inferences researchers make based on the data they collect
Categories of instrument validity
Content validity- It verifies whether the content of the items in the methodology for measuring a variable corresponds to its definition (e.g., items cover the full domain, are relevant, and appropriate). כמה התוכן של המבחן בודק את הדברים הנכונים
Criterion validity- how well a test or measurement correlates with an external criterion that is known to be a good indicator of the same construct.
Two types of criterion validity:
a) Concurrent validity- the methodology is compared with another method for measuring the given variable, administered concurrently (האם למבחן החדש יש קורלציה למבחן קיים שבודק את אותו דבר, שנתנו באותו זמן)
b) Predictive validity - he methodology's predictive potential is verified by comparison with an external criterion (כמו שציוני פסיכומטרי אמורים לנבא הצלחה באוניברסיטה)Construct validity- whether the method measures what it is supposed to measure based on the variable's definition by examining its relationships with other variables
Two types of construct validity:
a) Convergent validity -A self-esteem scale correlates positively with another validated self-esteem measure.
b) Discriminant validity - A depression scale correlates weakly with a measure of physical fitness (unrelated construct).
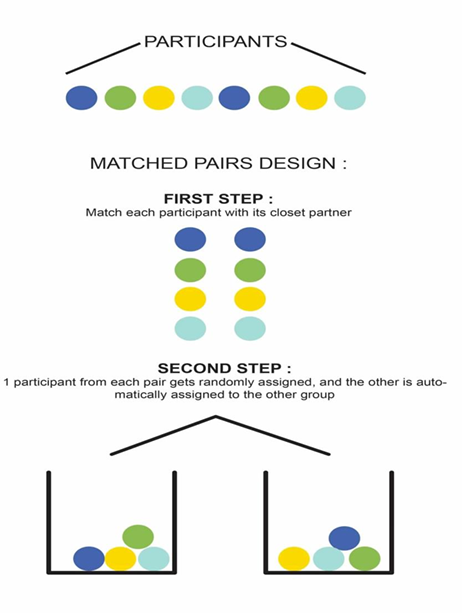
MATCHED PAIRS DESIGN
matching by: identical pretest scores, age, sex, IQ
You match each participant with its closest partner. 1 participant from each pair gets randomly assigned and the other is automatically assigned to the other group
Between-Subject Experiments (Group designs)
each of the different treatments under investigation is presented to only one group of subjects
Within-Subject Experiments (Multiple Treatment designs)
each of the different treatments under investigation is presented to each subject
Types of Between-Subject Experiments
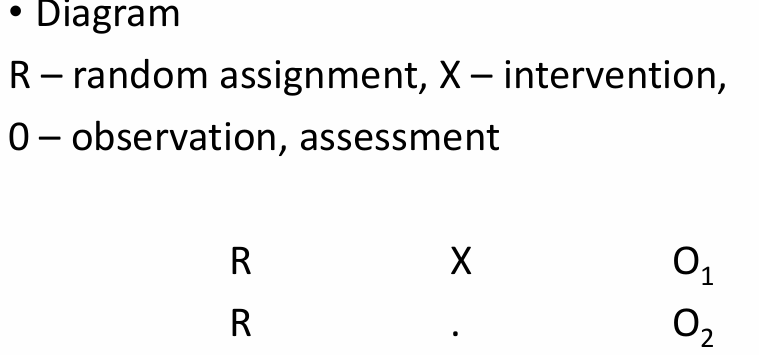
• Posttest-Only Control Group Design
• Pretest-Posttest Control Group Design
• Solomon Four-Group Design
• Factorial Designs
Posttest-Only Control Group Design
Minimum two groups, no pretest is given.
experimental (intervention) and control group.
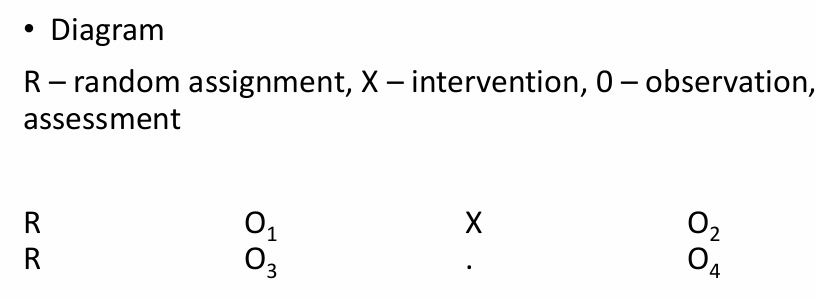
Pretest-Posttest Control Group Design
Minimum two groups. Experimental (intervention) and control group.
The effect of intervention is reflected in the amount of change from pretest to posttest
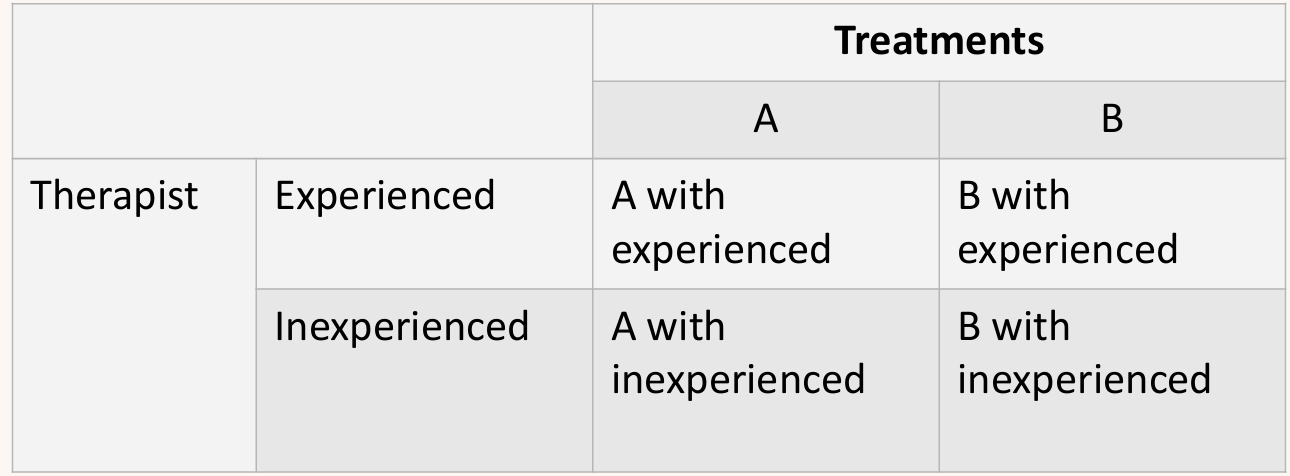
Solomon Four-Group Design
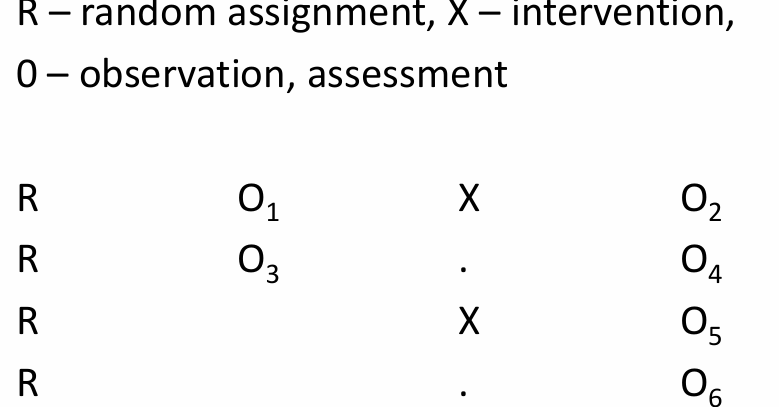
factorial design
multiple independent variables are tested simultaneously. Each level of one independent variable is combined with each level of every other independent variable to create different conditions.
For example, you could study the effects of both music (classical vs. no music) and study environment (library vs. café) on memory retention.
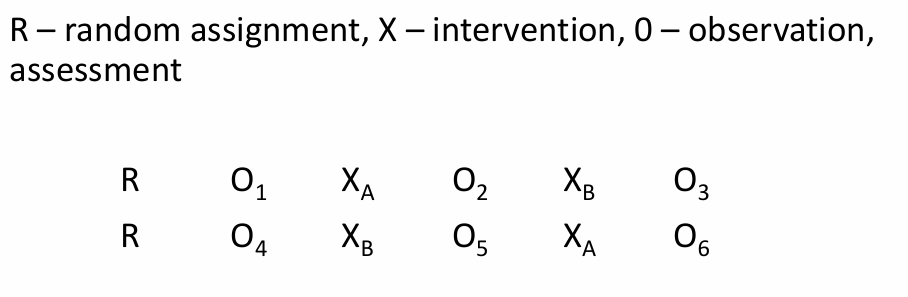
Crossover Design
It’s a within subject design
Quasi Experimental Design- definition and why do we use it
non-random allocation of participants.
same designs like in true experiments
Control group is not demonstrably equivalent to the experimental group.
Two reasons for quasi-experimental research:
1. Sometimes is not possible to use random allocation to experimental groups
2. Aim of planned experiment can be observation of effect of some intervention on defined groups
Same diagrams- with “nonR” instead of “R”
Multiple Treatment Counterbalanced Design
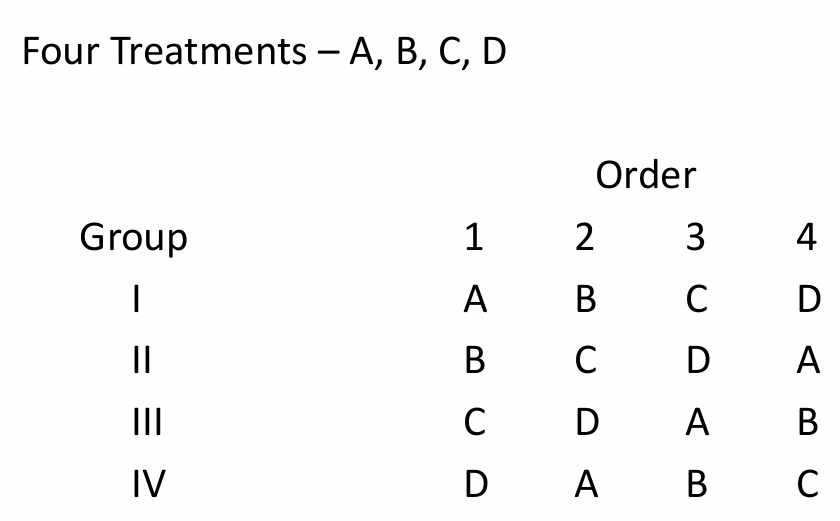
Types of Experimental manipulation
Variations of information – Participants receive different information (e.g., framing or content) to see how it influences responses.
Manipulation check: self-report questions assessing whether participants noticed, understood, and believed the information.Variations in subject behavior or experience – Participants engage in specific tasks or experiences (e.g., homework, physical contact levels).
Manipulation check: observation, reports by others, or self-reports to confirm the intended experience occurred.Variations of intervention conditions – Different treatments or interventions are compared (e.g., therapy vs. no treatment, or different therapy types).
Manipulation check: treatment integrity/fidelity—ensuring the intervention was delivered as intended, often via audio/video recordings.Simulation of real situations – Controlled but realistic scenarios (e.g., VR simulations) are used to study behavior and emotional responses.
Key challenges: ecological validity (how well the experimental situation reflects real-life conditions.) and participant immersion(how deeply participants feel involved in or “inside” the experimental situation).
Criteria for observation
-It corresponds to the formulated research objective (directly serves the purpose of your research)
- It relates to existing literature or theories
- It is systematically planned
- It is systematically recorded-
- It allows general conclusions or hypotheses to be formulated
- Is subject to verification of validity and reliability
When to use observation
- the research questions relate to people's behaviour in certain situations
- there is a need to investigate phenomena in specific situations
- there is a need to know details
- there is a need to know the process and causes
- there are differences between self-describing data and actual behaviour
- there is a need to complement the findings of quantitative research
Advantages of observation
direct measure of behavior
observation enables you to assess the behavior within its context and examine sequences of behavior over time.
good for studying behavior that people may not be aware of (e.g., nonverbal behavior) or behavior that is inaccessible using self‐report methods
good for research involving individuals with limited language ability, such as young children or people with cognitive impairments
Disadvantages of observation
it can only be used to answer certain research questions, principally where you are interested in overt behaviors
problems with reactivity of measurement: people may behave differently if they know they are being observed
Types of observation
Based on the observer’s participation
A. No participation observation -The observer does not take part in the action.
Hidden observation- The observer is not identified; participants do not know they are being observed.
Open observation-The observer is identified but remains passive and does not interfere.
B. Participant observation - The observer actively takes part in the situation.
Participant as observer- The observer is known as an observer but participates in the activity.
Full participant- The observer participates fully but is not identified as an observer.Based on the environment
A. Naturalistic observation- Conducted in a natural, real-life setting (e.g., classroom, playground).
B. Controlled (laboratory) observation- Conducted in a structured or artificially created environment where variables can be controlled.Based on the method of recording
A. Direct observation- The observer watches the behavior in real time (in person or live video)
B. Indirect observation- Observation is based on recordings, documents, photos, or other traces of behavior.
Structured observation
Focusing on predetermined units (forms) of behaviour. Choosing the units of behavior involves selecting the variables to monitor, which leads to the creation of a system of monitored behavior categories. A pre-prepared observation sheet lists the selected variables (behavioural categories). The frequency of the chosen behavioral units is tracked. Preparation includes the selection of participants, type, location, and time intervals of observation
Procedures for Conducting Observations - and types for second stage
Operational Definitions- Procedures for Conducting Observations- developing a version of the observation sheet list and codes
Choose an observational method
1) narrative recordings - equivalent to a qualitative unstructured observation, often a preliminary step to developing more structured methods of observation or hypothesis generation
2) Event recording - the observer counts every occurrence of the behavior within the entire observation period
3) Interval recording - divides the observation period into equal intervals (e.g., a 50‐minute therapy session might be divided into 10 five‐minute intervals) and the number of behaviors is recorded during each one)
4) Time sampling - Observations are made only at specific moments of time, for example, every five minutes or every half‐hour.
5) Sequential act coding - records events in the order in which they occur, - requires a comprehensive coding system to cover all possible events.
Example: researchers may classify events in a therapeutic interaction into client speech (C), therapist speech (T), and silence (S). Then a sequential act coding record might look like this: C,T,S,C,S,C.
6) Duration recording – to measure both duration, the interval between the start and the end of each behavior, and latency, the interval between behaviors
7) Global rating scales - based on a long period of observation, the observer makes an overall judgment about behaviour
8) Environmental measures – focuses on the psychological environment as a whole rather than specific individuals within it
Mechanics- Choose what tools to use: coding sheets, stopwatches, counters, - observations may be conducted in real-time, or the interactions may be audio or video recorded for subsequent observation and analysis
Evaluation and analysis of observations
Frequency analysis - finding out how many times a certain behaviour has been observed, expressed as a number (nominal) or as a relative value (%)
Duration - the total time taken to perform a given behaviour, or the average time per occurrence
Sequential analysis - identification of the sequence of occurrence of different forms of behaviour
Frequency-sequence analysis
Unstructured Observation (Qualitative Observation
Does not use a prepared list of phenomena to be observed .Aims to capture the context of an ongoing event over a set time interval.
During and after the observation, the researcher records his observations and impressions. Field notes are to be transformed by the researcher into a detailed coherent description of what was observed. The analysis of records should occur in the field. This is important not only to promote self reflection necessary for understanding the context but also because initial analysis may uncover emerging themes. While the researcher is still in the field, will allow him/her to shift attention to new aspects.
The aim is to understand the meaning units of the behaviour based on registering the observable manifestation. It involves moving from observable facts to conclusions. An important part of this is naming the observed units of meaning - labelling phenomena, conceptualising
Preparation of an unstructured observation
Choice of situation and person
Choice of time and place
Preparation of the observer- requirements regarding the ability to observe the situation and the action- recording requirement
Evaluation of unstructured observation
Content analysis – categorizing the data into themes or quantifying occurrences
Thematic analysis – identifying patterns, meanings, and themes in the data.
in qualitative observation, we usually do thematic analysis.
Strengths of Unstructured Observation
Rich, Contextual Data -collection of comprehensive and nuanced data, captures the natural flow of events and interactions
Flexibility- The observer can adapt to unexpected occurrences or behaviors
Generative Insights- can generate hypotheses and insights for future studies
Real-World Application- Observations are made in natural settings, making the findings more ecologically valid and reflective of real-life behaviors
Challenges of Unstructured Observation
• Subjectivity and Bias
• Lack of Standardization
• Data Overload - Unstructured observation produces a large amount of detailed, open-ended data (notes, descriptions, behaviors, conversations).
• Influence on Participants
• Ethical Concerns - Unstructured observation often involves real-world, natural settings, which creates ethical issues: Lack of informed consent , Privacy concerns.
Single-Case Experimental Designs
the term “case” refers to an individual (individual person, a classroom, a school, a business, an entire city, or state.
In single-case research are usually inferences made about different conditions presented to the same subject over time
Compared are observations with and without treatment
Single-case experiments permit to draw inferences about the effects of intervention
Key Requirements of Single-Case Experimental Designs
1. Ongoing Assessment- repeated observations made both before and during the intervention period
2. Baseline Assessment- assessment for a period of time prior to the implementation of the intervention
3. Stability of Performance - Absence of a trend in the data (flatline) or a trend in the opposite direction gives a godd baseline basis for evaluating performance. There should also be minimal variability in performance.
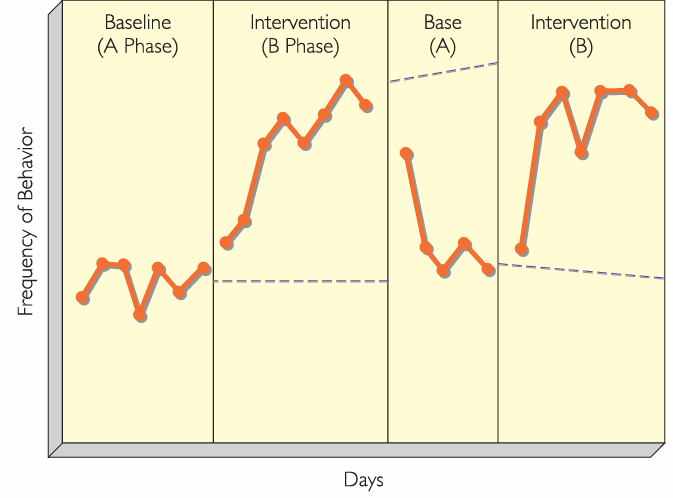
ABAB Design
A single case design.
In the graph, the solid lines in every phase represent the actual data, while the dashed lines are the trends from previous stage- which we can compare to the performance in this stage.
Variation of ABAB design
ABAB
BAB (intervention, baseline, intervention)
AB1B2AB2 (baseline, intervention1, intervention2, baseline, intervention 2)
multiple-baseline design
A multiple-baseline design is a type of single-case experimental design where the same intervention is introduced at different times (different starting points) across:
Different behaviors, or
Different individuals, or
Different settings/situations
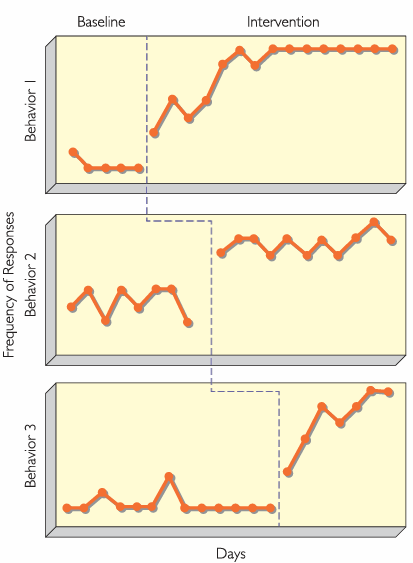
Benefits of Multiple-Baseline Designs
To assess the effectiveness of an intervention while controlling for potential confounding variables and threats to internal validity (if we start the intervention at different times for different people- we cancel out the confounding variable of environmental events, for example)
by staggering the introduction of the intervention across different baselines, researchers can observe whether changes in the dependent variable only occur after the intervention is applied. (Again, if each participant’s intervention started at a different time, we can say that improvement follows the intervention, not random fluctuation.)
help rule out threats such as maturation, history, and testing effects
Versatility Across Variables: flexible for a wide range of research areas (Can be applied to behaviors, individuals, situations)
Different data evaluation measures in single-case research
Changes in means- The mean rate of the behavior changes from phase to phase in the expected direction.
Change in Trend Line - The direction of the trend line changes from phase to phase, as for example showing no trend or slope (horizontal line) in baseline and an accelerating trend during the intervention phase.
Shift in Level - When one phase changes to another, a level refers to the change in behavior from the last day of one phase (e.g., baseline) and the first day of the next phase (e.g., intervention). An abrupt shift facilitates data interpretation.
Latency of Change - The speed with which change occurs once the conditions (phases) are changed (e.g., baseline to intervention, intervention back to baseline)
Methods of Data Evaluation of Single-Case Research
A. Nonoverlap Indices (simple, visual → statistical measures)
These methods compare baseline data with intervention data to see how much improvement occurred, without needing large sample sizes.
PND – Percentage of Nonoverlapping Data- Measures the percentage of intervention (treatment) data points that are better than ALL baseline points.
How it works:
Find the “best” point in baseline (e.g., lowest level of problem behavior).
Count how many treatment points exceed (or improve beyond) that value.
Convert to a percentage.
NAP – Nonoverlap of All Pairs- NAP compares every baseline point with every treatment point, forming all possible pairs. It checks how often the treatment point is better than the baseline point.
Tau-U -
Tau-U combines nonoverlap with trend correction.
If the baseline is already improving before the intervention, part of the change is not due to treatment.
Tau-U adjusts for this.
B. Statistical Time-Series Methods (for large numbers of observations)- These are used when the single-case study has 30+ data points, allowing more advanced statistical modeling.
Autocorrelation Analysis- Whether data points depend on each other over time.
If today’s behavior strongly predicts tomorrow’s behavior, the data is autocorrelated.
Interrupted Time-Series Analysis (ITSA)- ITSA statistically compares:
trend before the intervention (baseline slope)
trend after the intervention (treatment slope)
ARIMA Models (Auto-Regressive Integrated Moving Average)- A very powerful method for analyzing time-dependent data.
What ARIMA does:
Models data patterns over time
Removes predictable variation
Identifies whether the intervention caused a unique shift beyond normal patterns
The research process
Identification of research area and research problem
Study of relevant literature
Formulation of research questions and hypothesis
Preparation of the research design and selection of data collection methods (research methodology)
Data collection
Data analysis
Drawing conclusions and report writing
Probability sampling types
Simple random sampling – every member of the population has an equal chance of being selected, needed
Systematic sampling – as simple random sampling, individuals are chosen at regular intervals
Stratified sampling – involves dividing the population into subpopulations based on relevant characteristics (gender, age ...) so that total sample will have the same distribution of chatacteristics as basic population
Nonprobability sampling types
Quota sampling – population is divided to subpopulations based on relevant characteristics so that total sample will have the same distribution of characteristics as basic population, selection of participants is non-random
Convenience sampling – includes individuals who are most accessible to the researcher
Purposive (judgement) sampling – researcher uses their expertise to select a sample that is most useful for the purposes of the research
Snowball sampling – collection of participants via other participants
Levels of measurment
Nominal - The data consists of names, labels, or categories without any order or rank\
. Ordinal – Data can be ordered or ranked, but the intervals between the values are not consistent.
Interval – Equal intervals between values can be measured, but zero does not mean the absence of the property
Ratio – Like the interval level, but with the addition of an absolute zero
Operationalization, concept, indicators and variable
the process of turning abstract concepts into measurable variables through indicators
Concept –> indicators –> variable
Indicator=Observable signs of the concept.
Variable= A measurable version of the concept, created when indicators are turned into numbers or categories
Example:
Concept: Depression
Indicator: sadness
Variable: Self-reported frequency of feeling sad
Operationalisation: To what extent do you agree with the following statement: I do not feel sad. Agree 1 2 3 4 5 6 Disagre
when to use qualitative research
New field of research
New frame of reference is needed
More details are needed
Main differences between qualitative and quantitative analysis
Qualitative analysis relies on interpretation and logic whereas quantitative analysis relies on statistics
Qualitative analysis has no set rules but rather guidelines; quantitative analysis follows agreed upon standardized procedures and rules
Qualitative analysis occurs simultaneously with data collection, quantitative annalysis occurs only after data collection is finished
Qualitative analysis may vary methods depending on the situation, methods of quantitative analysis are determined in advance as part of the study
Types of Qualitative Research
Case studies- Study of contemporary phenomena within its real-life context
Interpretative phenomenological analysis (IPA)-looks at how things appear to a person in their lived experience or unique context.
Grounded Theory
Ethnographic research
criticism of Case study of Anna O
Subjectivity and Lack of Rigor- contain too much “narrative smoothing”. too selective and have often been altered (either deliberately or unconsciously) to tell a better story.
Lack of Generalizability -The case study focused on a single individual, limiting its applicability to broader populations.
Retrospective Interpretations - interpretations of the case (e.g., linking it to his theory of repressed sexual trauma) were speculative and not grounded in direct observation. Freud’s interpretations were shaped by his theoretical bias.
Case study of Anna O
Done by Freud. Anna o. hysteria, a condition with no organic cause but linked to psychological distress. There was deep, qualitative exploration of her psychological and emotional state.
Description of the Curious Case Of Patient H.M.
H.M. suffered from epileptic seizures
The seizures increased in severity and H.M. became ultimately too disabled to work
Medicament treatments were unsuccessful
At age 27, H. M. underwent brain surgery to remove his hippocampus—the region believed to be the source of his epileptic seizures
As a result of his surgery, H.M.’s seizures decreased, but he could no longer form new memories or recall the previous 11 years of his life life.
He lost his ability to form many types of new memories (anterograde amnesia), such as new facts or faces, and the surgery also caused retrograde amnesia as he was able to recall childhood events but lost the ability to recall experiences a few years before his surgery.
Findings from Case Of Patient H.M.
The Role of the Medial Temporal Lobe in Memory
• Anterograde Amnesia
• Intact Implicit Memory, Retained Working Memory
• Retrograde Amnesia and Memory Consolidation and Storage
• Dissociation of Memory Systems
• Emotion and Behaviour
Types of case study
Intrinsic case study – study undertaken to learn about a unique phenomenon . deeply understand a specific, unique case for its own sake — not to generalize
Instrumental case study – examines a specific case to understand a broader issue or phenomenon better.
Collective case study – involves studying multiple cases simultaneously or sequentially to gain a broader understanding of a phenomenon or issue
types of data in case studies
Secondary data – documents, archival records, physical artifacts, other useful informations
Primary data – interview, direct observation, participant observation, questionnares
Different types of data collection approaches and perspective in case study research
Snapshot – collecting data in single point in time
Diachronic – shows change over time, reveals differences
Nested – how are the subunits connected with each other (If your case is one school: Nested data may include: Students (level 1), Teachers (level 2), Classroom observations (level 3))
Retrospective – collecting data about past phenomenon
when to use IPA
When exploring complex, personal, and subjective experiences.
For research questions focusing on how people make sense of significant life events, such as illness, trauma, or career transitions.
Suitable for psychology, health sciences, education, and other fields interested in subjective experience
Steps in Conducting IPA
1. Formulate Research Question- Aim – analysis of rich and detailed description of how individuals are experiencing phenomena under investigation
2. Recruit Participants: Sample is usually small, purposive. Number of participants depends on things like The depth of analysis of a single case , the richness of the individual cases, If the researchers wants to compare or contrast single cases. 6-8 is recommended; less is common. • Usually is prefered homogeneous sample
3. Data Collection -Prefered is semi-structured in-depth interview, usually planed in advance
4. Analysis of material - Repeated reading and listening to the audio record while taking notes. Analysis of notes and transformation of notes into emerging themes. Seeking relationships and clustering themes
Types of Quantitative and Qualitative (Mixed) Research
Explanatory Sequential Design- starts with quantitative research phase, which is followed by interviews or observation (qualitative analysis) to help explain quantitative findings
Exploratory Sequential Design- Starts with qualitative research and then uses insights gained by first phase to frame the design of quantitative research and data analysis. Can be used in development of new questionnaire.
Convergent Parallel Design- Qualitative and quantitative data are collected and analysed simultaneously and independently. Results are compared and contrasted.
questions of ethics committee
Will the participants be subjected to any risk, including providing information that the investigator might misuse?
Are there any deceptive practices in the study?
Is the potential knowledge yield of the study worth the potential risk that any participants might experience?
Ethical aspects related to human participation
• Confidentiality- Data must be stored and disposed of securly. The means by which confidentiality is established and maintained should be described to participants at the start of the study.
• Voluntary participation- Participation of people with disabilities :They must agree to it and the researcher needs to obtain consent from authorised representatives as well.
• Right of withdrawal - The can leave the study or withdraw their data at any point. This must be explained to participants before the study begins
• Misleading and deception in research- deception needs to be justified by its scientific, educational, and application value and you need to make sure that an alternative approach cannot be used
• Debriefing- Any misconceptions about the study are corrected, especially if it was a fraud. Participants are informed of the availability of counselling and how to obtain it if they need it.
• Informed consent - • Participants should be informed: About the nature of the research, that they are free to decline to participate or to withdraw, factors such as risks, discomfort, adverse effects, or limitations on confidentiality
Fraud in science- definition and consequences
Fraud in science refers to explicit efforts to deceive and misrepresent.
Consequences:
undermines the foundations of the entire enterprise of scientific research.
hurts science and the public in multiple ways, such as undermining public trust and support for research,
Ethical Principles of Psychologists and Code of Conduct
Reporting Research Results- accurate reporting of methods, data, and results without fabrication, falsification, or omission. If psychologists discover significant errors in their published data, they take reasonable steps to correct such errors in a correction, retraction, erratum, or other appropriate publication means.
Plagiarism- psychologists do not present portions of another’s work or data as their own, even if the other work or data source is cited occasionally
Scientific Integrity
Authorship or publication credit- Psychologists take responsibility and credit, including authorship credit, only for work they have performed or to which they have substantially contributed.
Conflict of interest (COI)- COI occurs when external interests could influence a researcher’s decisions(financial, professional or personal COI)
Sharing Data- After research results are published, we should not withhold the data on which our conclusions are based
Duplicate publication of data – psychologists do not publish, as original data, data that has been previously published