FSA prelim 2
1/59
There's no tags or description
Looks like no tags are added yet.
Name | Mastery | Learn | Test | Matching | Spaced | Call with Kai |
|---|
No analytics yet
Send a link to your students to track their progress
60 Terms
should you forecast all of the financial statements even if you only care about earnings? why
yes This avoids internal inconsistencies • E.g., sales growth increases the need for working capital/PP&E/financing, which affect asset turnover, leverage etc. Need to make sure the forecast of all these items is reasonable.
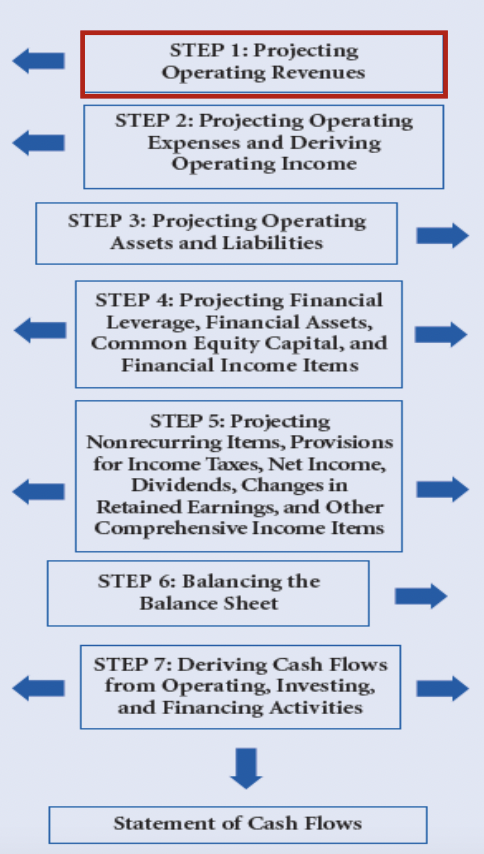
financial statements forecasting steps (7 steps)
what’s the key to forecasting revenue?
understanding the key drivers that determine price and quantity of sales.
proxies include using historical growth rates and adjusting the growth rate to current conditions
what is economic gravity in revenue growth
Revenue growth rate mean reverts to 4-7% range over relatively short time (mean reversion)
regression analysis to determine cogs, sga, randd
regression between historical cogs for example and sales to get an intercept and project cogs based on forecasted revenue
how do you forecast operating assets and liabilities
turnover technique:
get turnover by taking sales / ending AR for example to give you turnover
take turnover and go forecasted sales / turnover for AR to get forecasted AR
don’t use average AR because then you get the sawtooth problem
what is the sawtooth problem
A pattern in financial forecasts where projected figures fluctuate irregularly over time, often due to reliance on average measures rather than actual turnover rates.
why do you need a plug and what should it be in the balance sheet forecast
need the plug so that any issues balance in the balance sheet. usually use cash
how should you forecast cash flow statement
don’t go directly from historical cash flow statement
Derive forecasts of CFS using forecasts of balance sheet and income statement
Increases in assets imply uses of cash; decreases in assets imply cash being conserved/generated
• Increases in liabilities and stockholders’ equity imply sources of cash or cash being conserved; decreases in liabilities and stockholders’ equity imply uses of cash
• Classify increases/decreases into operating, investing, and financing
what is relative valuation
Valuing a firm by appealing to the valuation of other (comparable) firms • E.g., PE, PEG, TEV/Revenue, TEV/EBITDA
Firm i is valued by using price multiples of the comparable firms formula
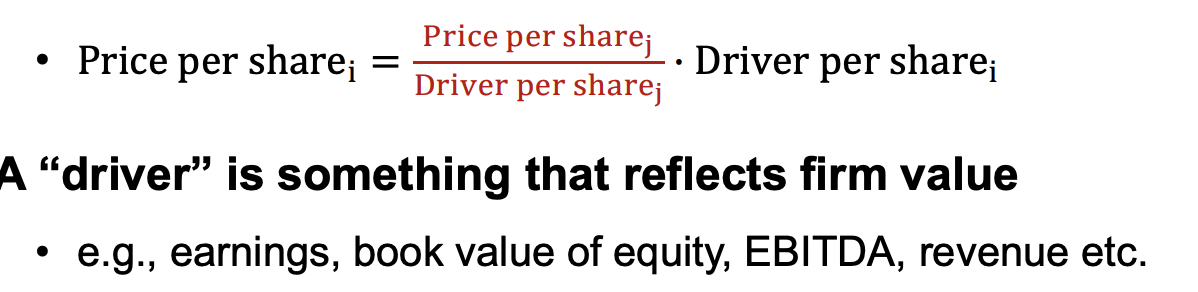
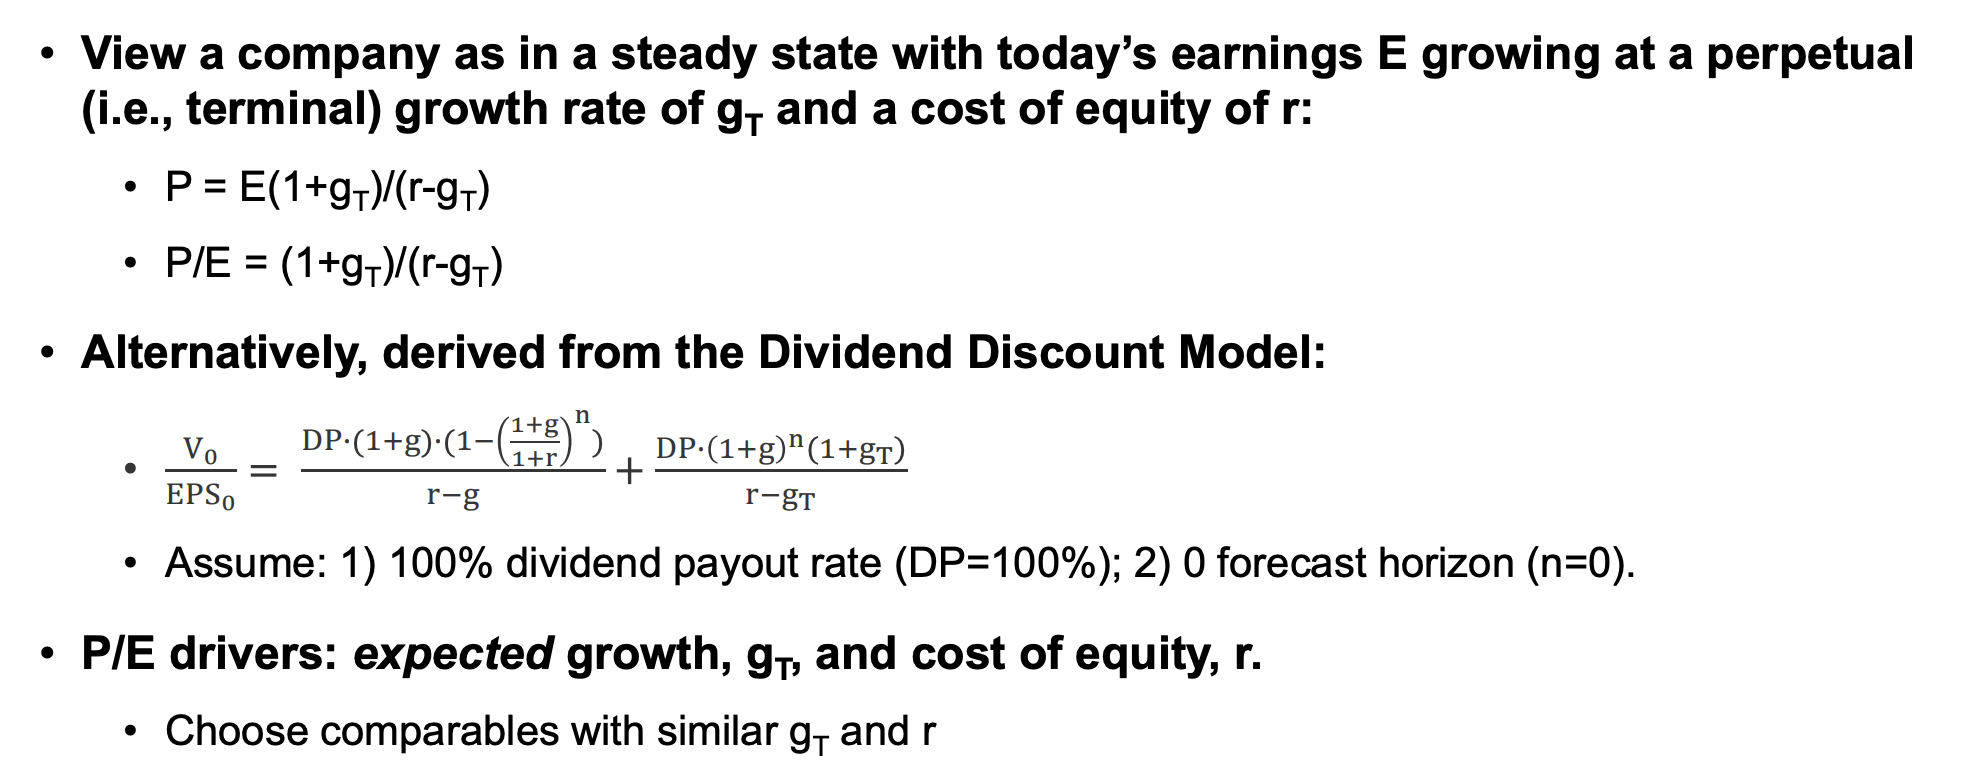
basic idea of P/E relative valuation
3 key considerations when using multiples
choosing good comparisons
make adjustments to assure apples to apples comparison
choose appropriate multiples
how do you select comparables?
risk and growth are good drivers
match risk on industry and strategy
match growth rates with historical growth rates and future projections of growth (similar age and size)
what adjustments are important for relative valuation with comparables
accounting choices (straight line vs accelerated depreciation)
special items like acquisitions, law suits, restructuring, etc
what is equity value
What is the market value of equity (i.e., stock price)? • Information is easily available.
what is enterprise value
Market Value of Equity + Market Value of Debt - Cash
How much money is needed to buy the entire company today? • More precisely: EV = Market value of common stock + Market value of preferred equity + Market value of debt + Minority interest – Cash. • Makes firms with different capital structures more comparable.
what is price to earnings growth (PEG)
PE / G = (1+g)/ (g*(r-g))
g* is in % terms in the denominator: g=26% g* = 26 not 0.26 • Example: PEG = 15 / (12 * 100) = 1.25 for company with PE of 15 and forecasted earnings growth of 12%
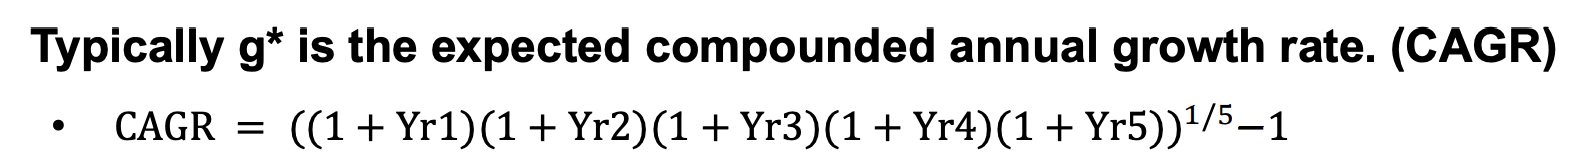
Typically g* is the expected compounded annual growth rate. (CAGR) what is CAGR
why ebitda, concerns of ebitda
popular because it focuses on a company’s core profitability by removing the effects of financing decisions, tax environments, and non-cash expenses.
EBITDA ignores important cash outflows like capital expenditures (CapEx) and changes in working capital.
It can make companies look healthier than they are because it hides debt payments and necessary reinvestments.
what method yields the highest and lowest valuations error usually
lowest - PEG
highest - Enterprise value / sales
key features of direct valuation
• Emphasizes fundamentals of the firm
• Ignores the current mood of the market
• Need lots of forecasts
• Explicit assumptions
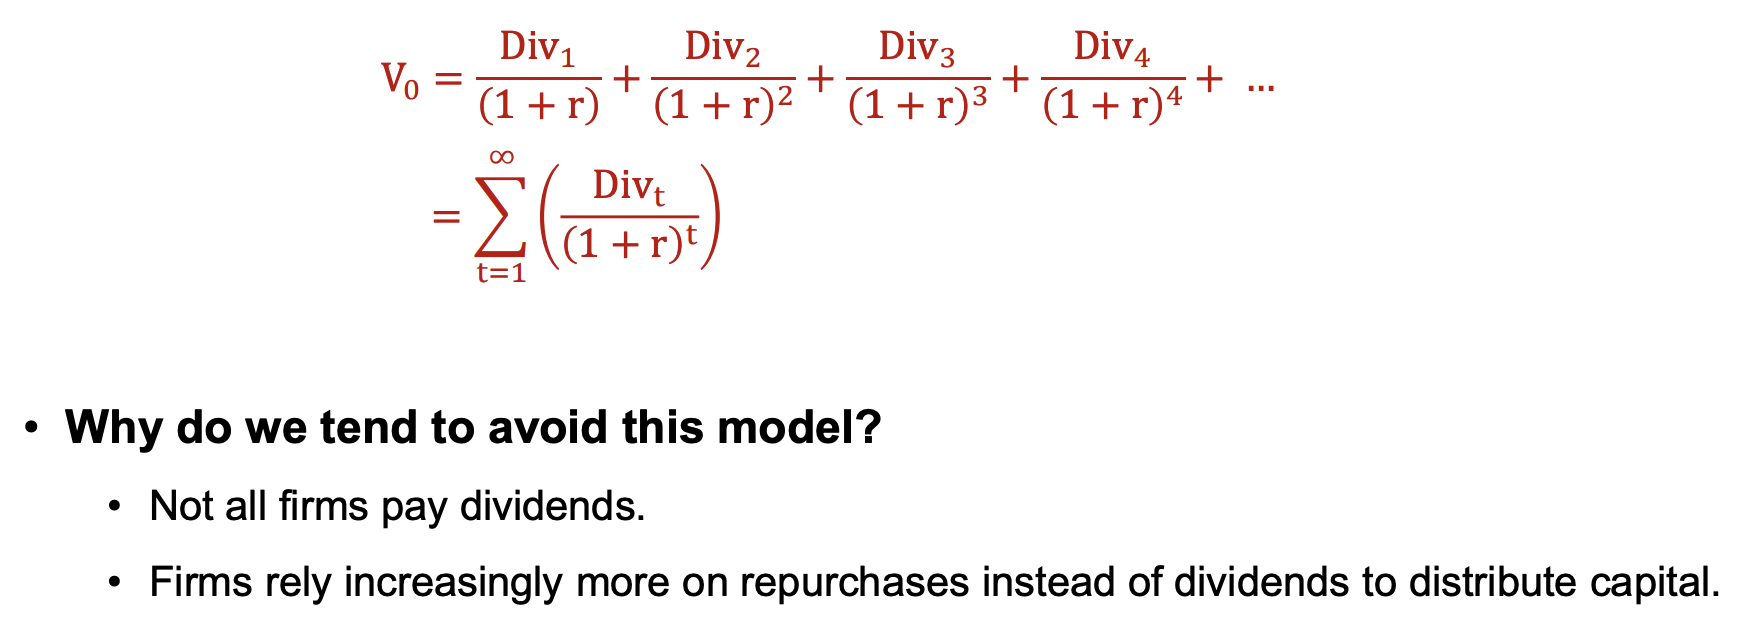
ddm formula and why it’s problematic
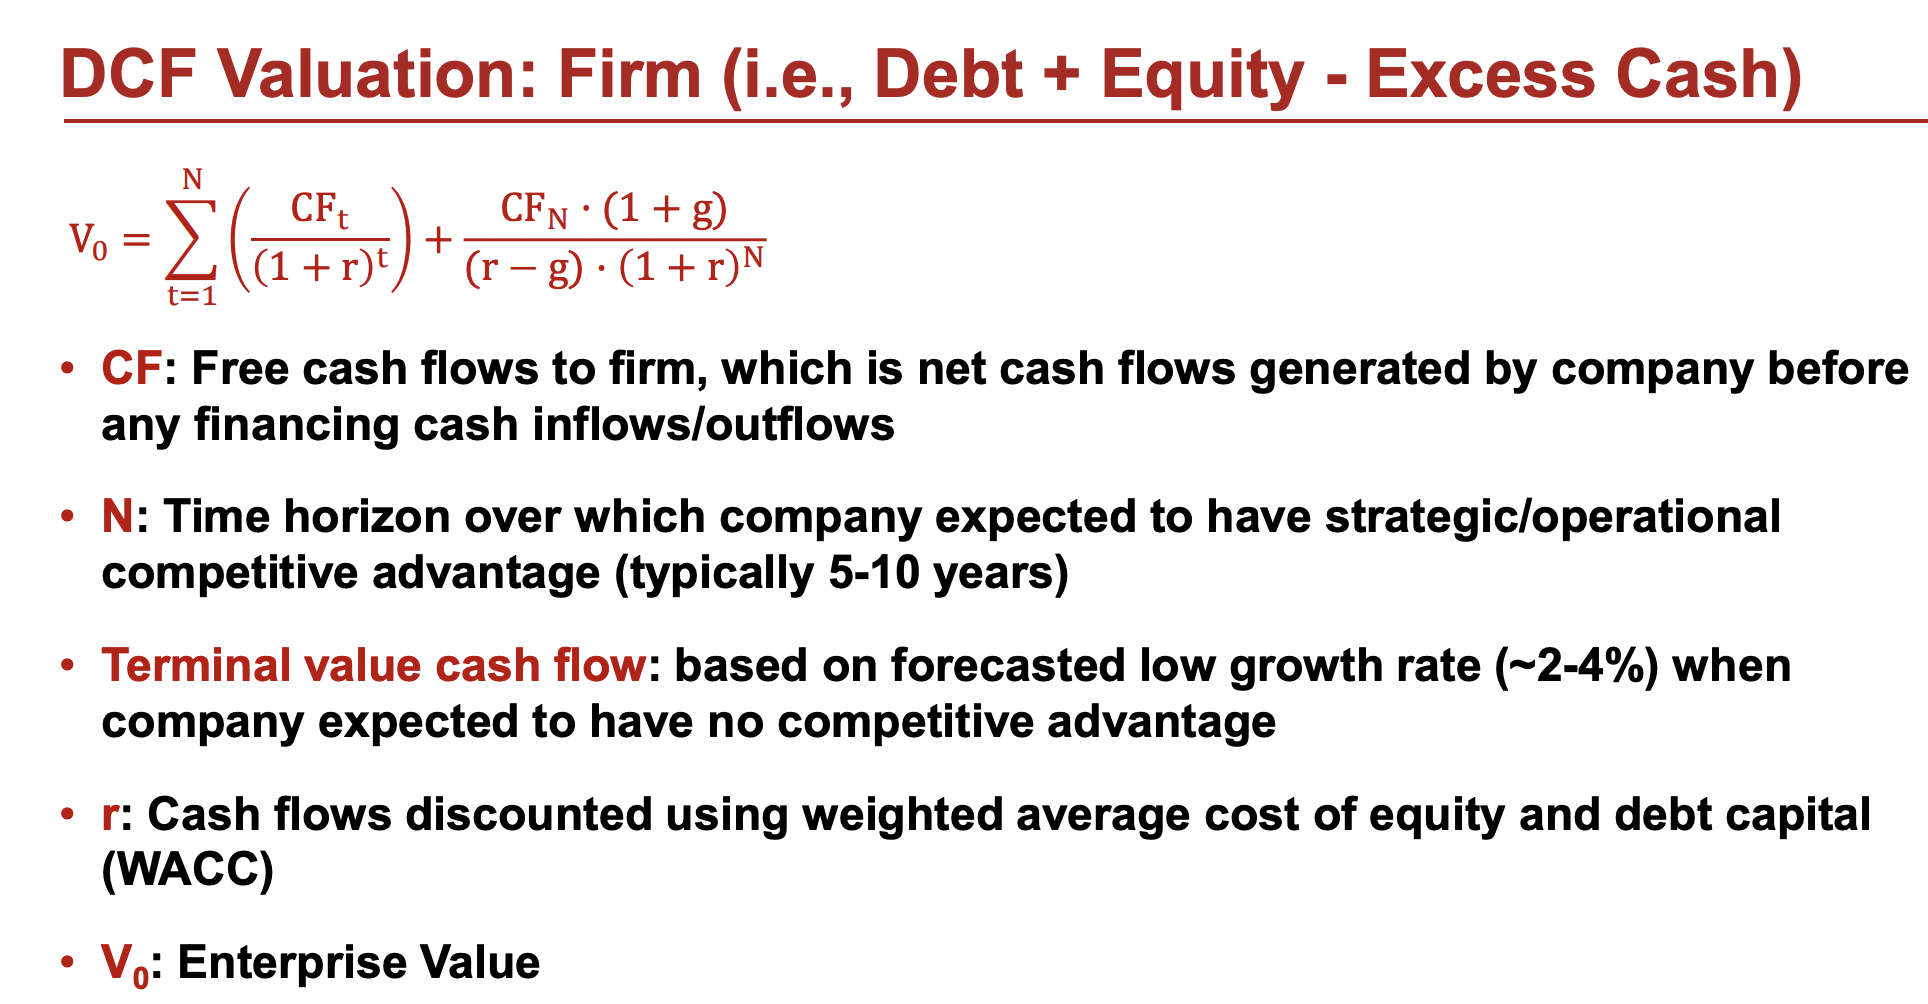
dcf model formula
free cash flow formula and what it means
Cash Flow from Operations + Cash Flow from Investing
free cash flow to firm formula
many different formulas
free cash flow + Interest Expense * (1-tax rate) is one
Free cash flows to firm = EBIT * (1 – tax rate) + depreciation and amortization – capex for PP&E – Δworking capital
employee stock options
The right to purchase shares at a pre-determined price (often lower than current price)
should stock based compensation be added back to future fcf?
No don’t do this
MV of Equity = EV – Debt – Other capital claims + Non-operating net assets in this formula what does SBC belong to?
belongs to other capital claims
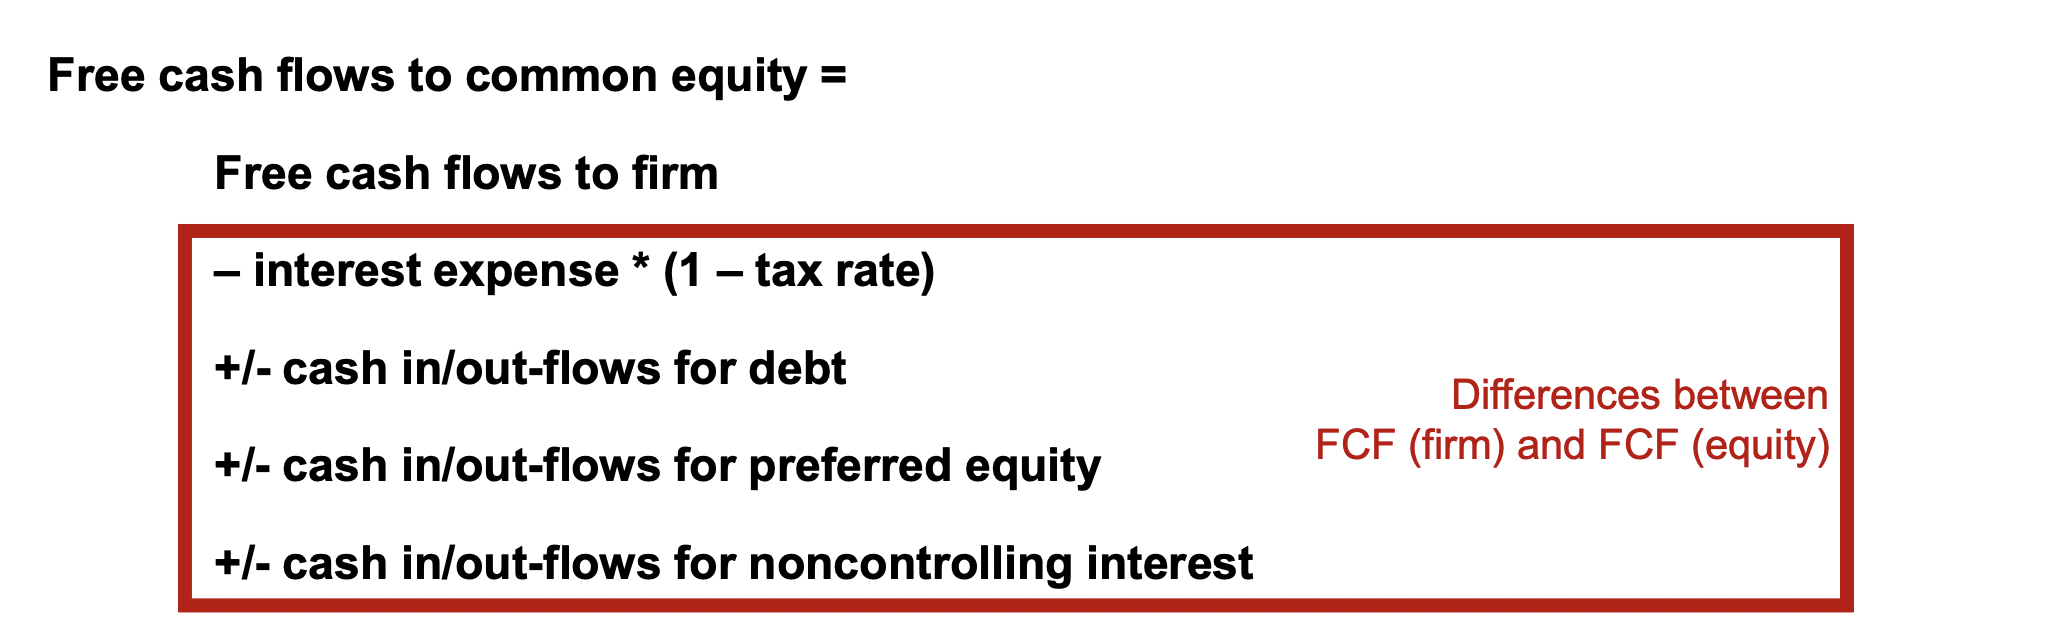
free cash flows to common equity
residual income model
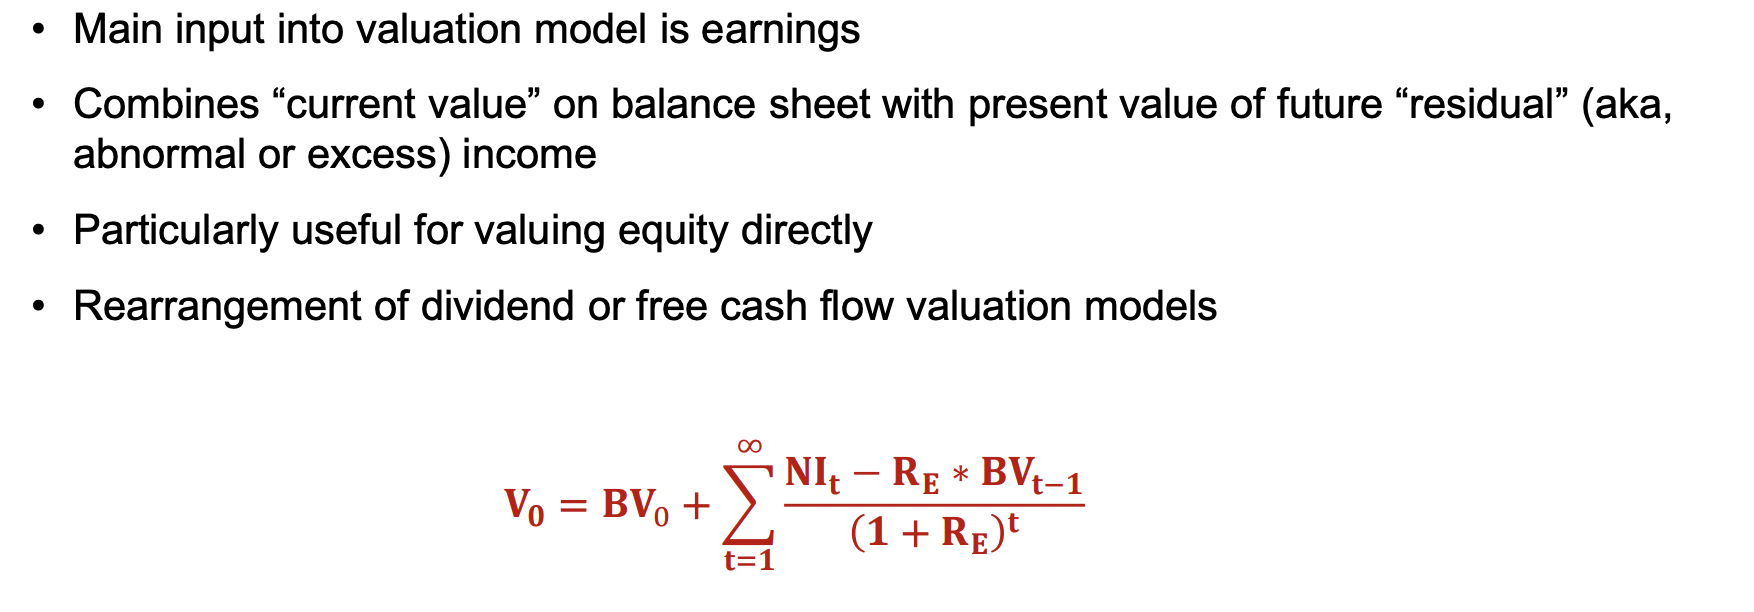
residual income big idea equation
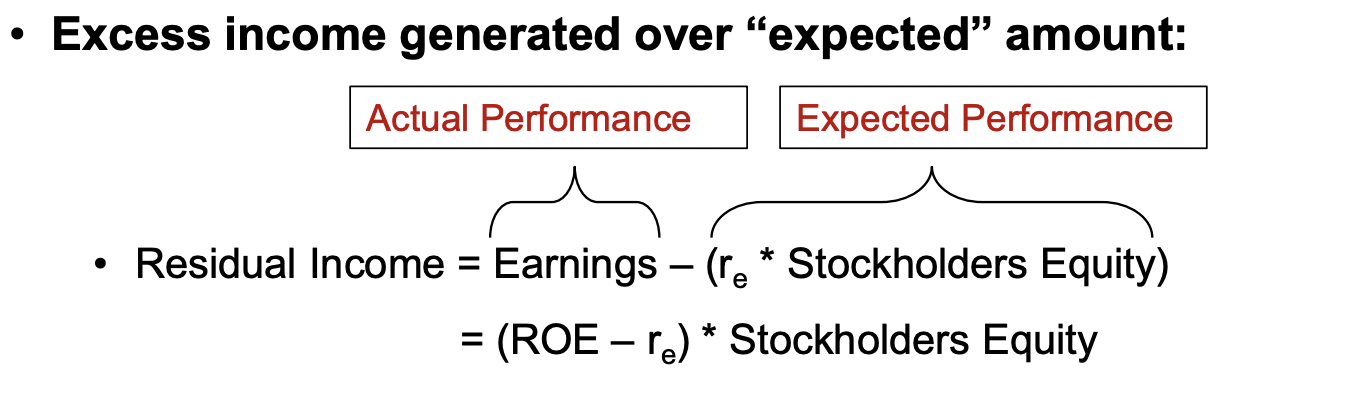
do different accounting methods affect the residual income valuation, if so how?
they do not change the valuation
which is more reliant on terminal value, residual income or dcf?
The discounted cash flow (DCF) model is generally more reliant on terminal value than the residual income model, as it often represents a larger portion of the overall valuation in DCF analyses.
what does the residual income model assume with its income
assumes that it’s clean surplus, meaning that all income goes through net income. GAAP allows for dirty surplus, like AOCI
advantages of residual income valuation vs dcf
easy to implement
earnings forecasts are more readily available than cash forecasts
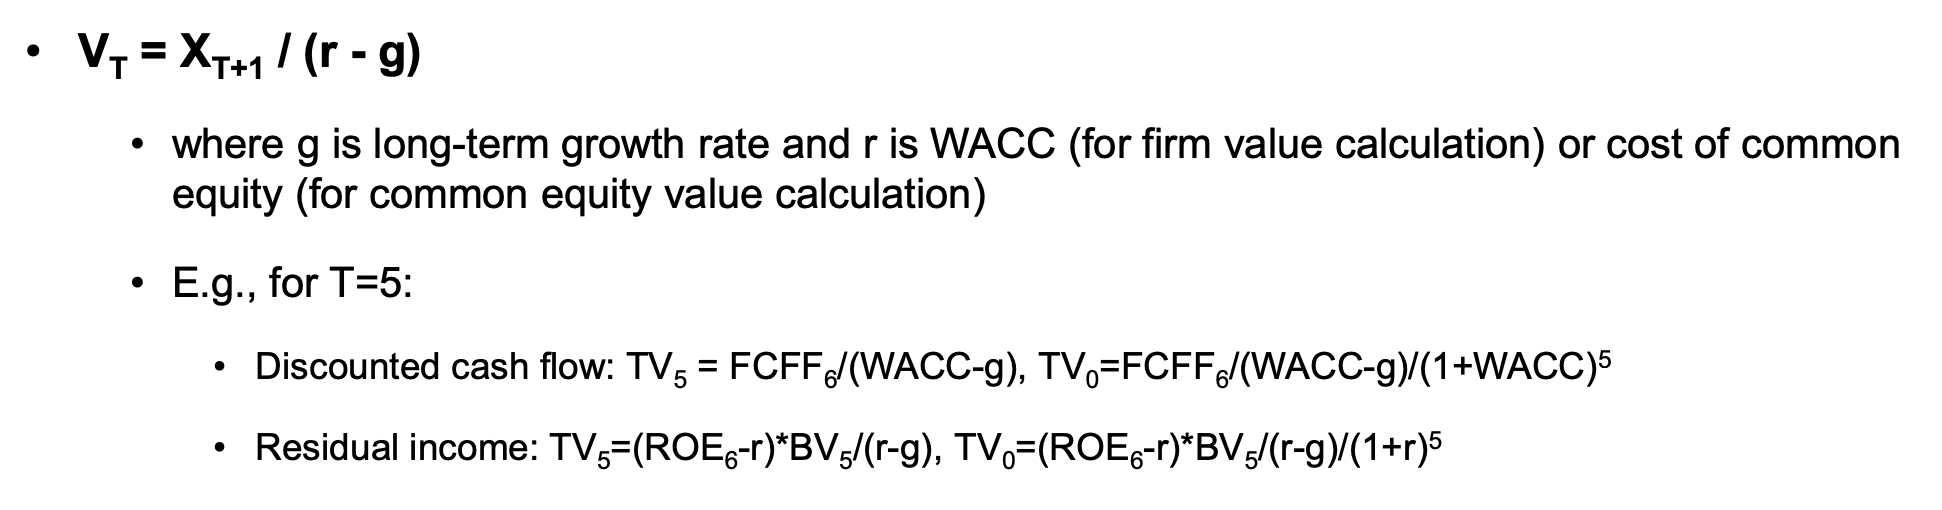
terminal value is less important
terminal value equation
coupon rate formula
annual coupon payment / bond face value
debt yield formula
annual coupon payment / bond price
what’s the interest expense in the 10k
The total of all coupon payments during the period.
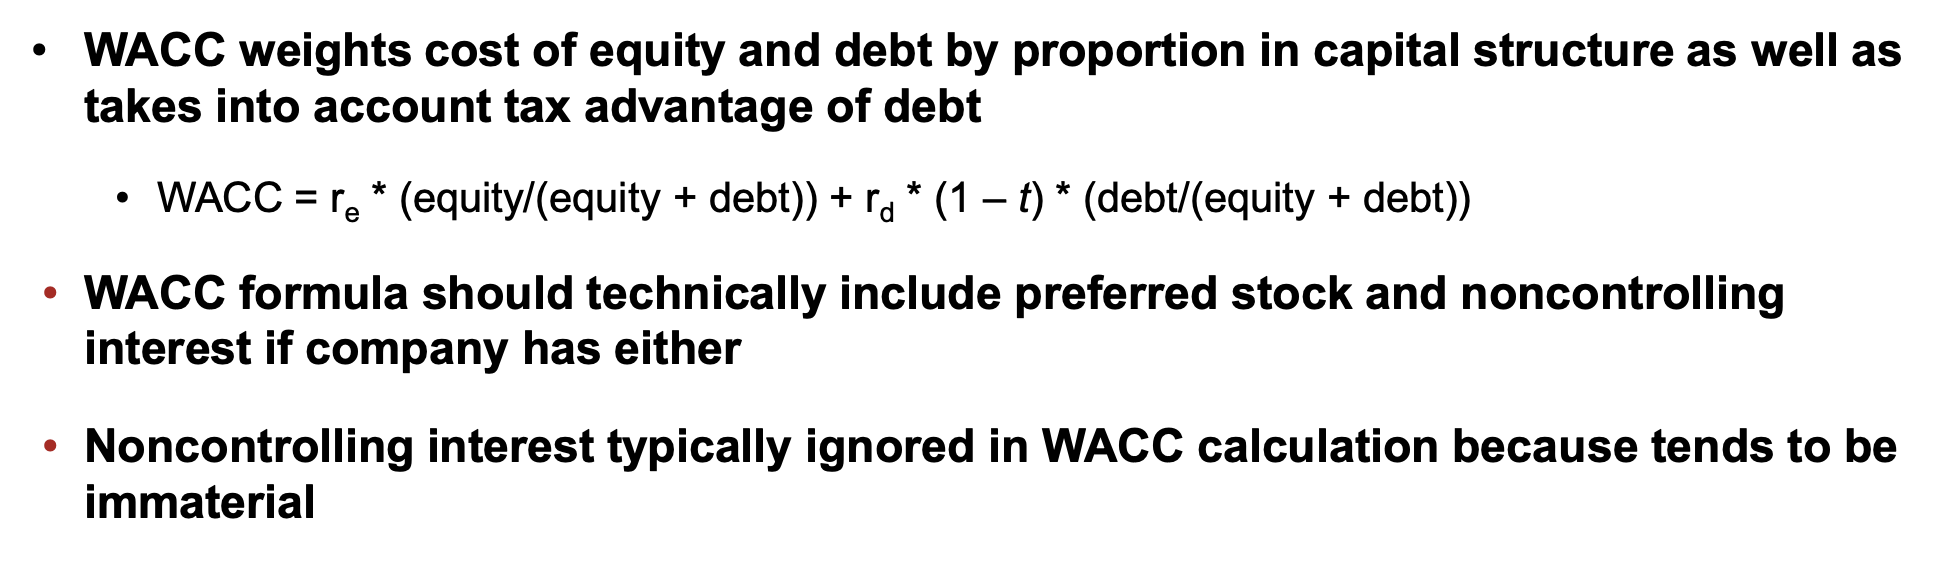
what does wacc do and equation
which times of firms does the cost of equity matter less
Firms with front-loaded cash flows. If value is found in the terminal value (e.g., start-up with later cash flows), then Cost of Equity matters more
two types of credit risk
short term liquidity risk: : the near-term ability to generate cash to service working capital needs and debt service requirements
long term solvency risk: the longer-term ability to generate cash internally or from external sources to satisfy debt repayment needs
examples of short term liquidity measures
Current ratio and quick ratio.
examples of long term solvency measures
Debt to equity ratio and interest coverage ratio (EBIT / Interest exp)
inventory turnover ratio
cogs / avg inventory
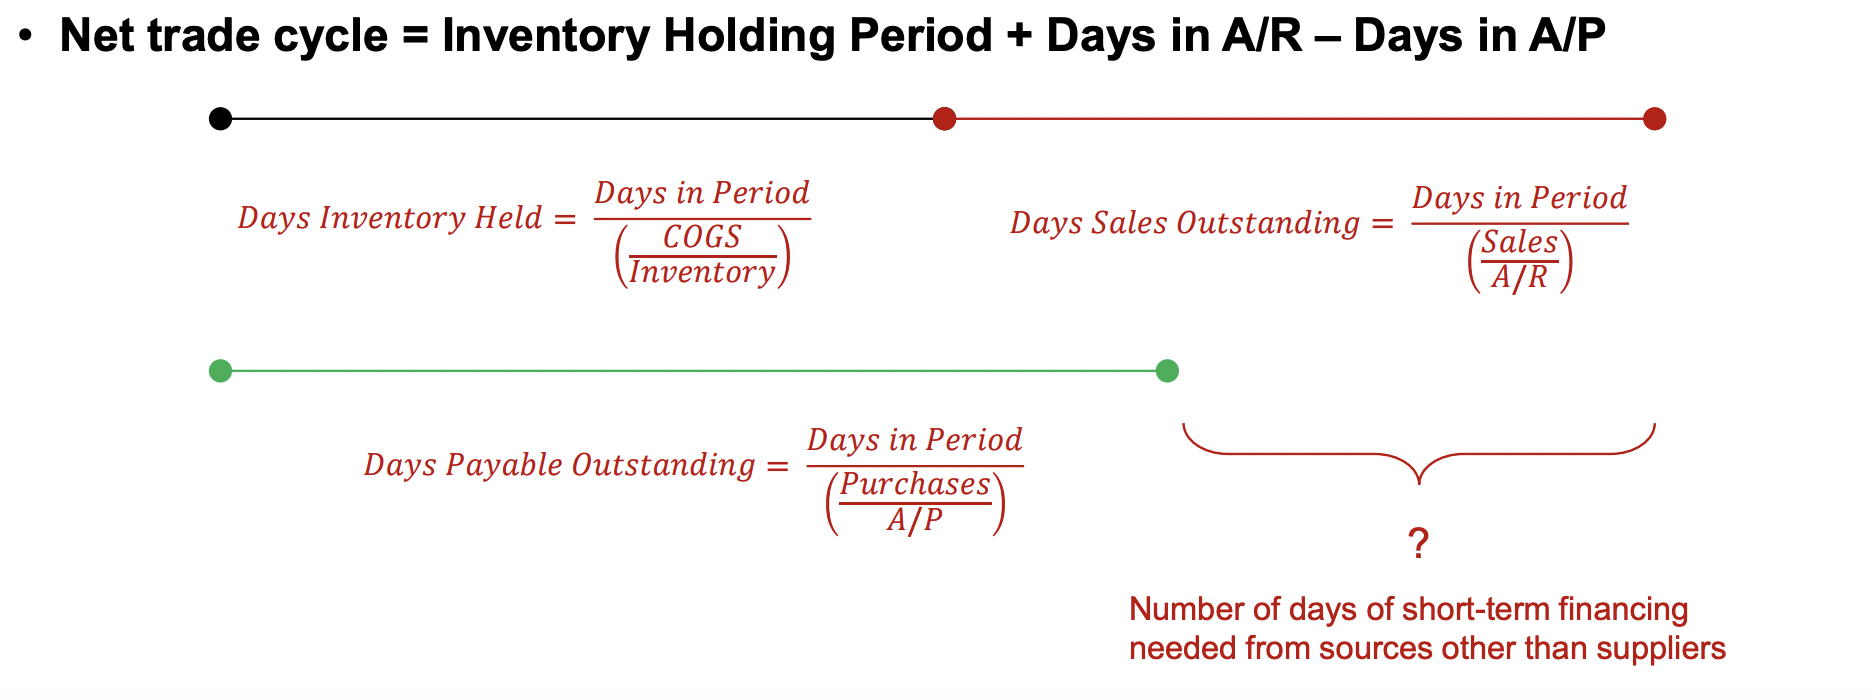
days sales in inventory
365 / inventory turnover
Tells us how many days it takes to sell inventory
what does purchases in accounts payable tell you
Tells us how many days it takes to pay trade creditors (e.g., suppliers)
365 / (purchases / avg accounts payable)
net trade cycle =
what does Z-score > 2.675 mean
not bankrupt
what makes a good lbo candidate
Stable, predictable cash flows.
• Large tangible asset base
• Low CAPEX requirements
• Growth opportunities
• Strong management
• Barriers to entry in the industry
• Viable exit strategy