Intro to Economics
1/125
There's no tags or description
Looks like no tags are added yet.
Name | Mastery | Learn | Test | Matching | Spaced | Call with Kai |
|---|
No analytics yet
Send a link to your students to track their progress
126 Terms
Define Economics
The study of decisions made by individuals and firms to achieve their unlimited wants given scares resources.
Define Production Possibility Frontier
A curve showing the maximum attainable combinations of two products that may be produced with available resources and current technology.
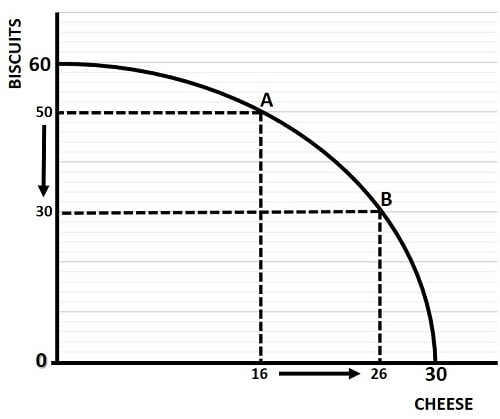
Define Opportunity Cost
The highest-valued alternative that must be given up to engage in an activity.
Calculate Opportunity Cost
The difference between the return on a forgone activity and the return on the chosen activity.
Economic Growth
The ability to produce increasing amounts of goods or services.
Absolute Advantage
The ability of an individual or firm to produce more of a good or service than another producer.
Comparative Advantage
The ability of an individual or firm to produce a product or service at a lower opportunity cost than another producer.
Quantity Demand (QD)
The amount of a good or service that a consumer is willing and able to buy at a given price.
Quantity Supplied (QS)
The amount of a good or service that a firm is willing and able to supply at a given price.
Determinants that cause shift in demand (D)
Income
Price of related goods (complements or substitutes)
Taste/preference
Population/demographic
Expected future prices
Determinates that change quantity demand
A change in price (demand)
Market Equilibrium (ME)
A situation in which quantity demanded equals quantity supplied.
Ceteris paribus
“all else being equal”
The assumption that when analysing the relationship between two variables, such as price and quantity demanded, other variables must be held constant.
Demand Curve
A curve that shows the relationship between the price of a product and the quantity of the product demanded.
Law of Demand
An increase in the price of a product causes the quantity demanded to decrease.
A decrease in the price of a product causes the quantity demanded to increase.
Change in quantity demanded (QD)
Movement up or down the demand curve from a change in price of a good.
Change in demand (D)
Movement of the demand curve left (decrease) or right (increase).
Law of supply
An increase in the price of a product causes an increase in the quantity supplied
A decrease in the price of a product causes a decrease in the quantity supplied.
Change in quantity supplied (QS)
Movement up or down the supply curve from a change in the price of producing a good.
Change in supply (S)
Shift in supply curve either left (decrease) or right (increase).
Determinants that change supply (S)
Price of inputs
Productivity (technological change)
Prices of substitutes in production
Number of firms in the market
Expected future prices
Determinants that change quantity supply
Change in price (supply)
Equilibrium Price (EP)
The price at which the quantity demanded equals the quantity supplied.
Equilibrium Quantity (EQ)
The quantity bought and sold at equilibrium price.
Surplus
A situation in which the quantity supplied is greater than the quantity demanded (price falls).
Shortage
A situation in which the quantity demanded is greater than the quantity supplied (price rises).
Elasticity
A measure of how much one economic variable (such as changes in quantity demanded) responds to changes in another economic variable (such as price).
Price elasticity of demand (PED)
The responsiveness of the quantity demanded of a good to a change in price.
Calculate price elasticity of demand
Dividing the percentage change in the quantity demanded by the percentage change in price

Elastic demand
Price elasticity of demand is greater than 1 (PED >1)
Unit elastic demand
Price elasticity of demand is equal to 1 (PED = 1)
Inelastic demand
Price elasticity of demand is less than 1 (PED <1)
Perfectly inelastic demand
Price elasticity of demand equals 0 (PED = 0)
A change in price results in no change in demand.
Perfectly elastic demand
Price elasticity of demand equals infinity (PED =∞)
A change in price results in an infinite change in quantity demanded.
Determinants of price elasticity of demand (PED)
Availability of close substitutes, luxuries versus necessities, definition of the market, the length of time involved, share of expenditure on the consumer’s budget.
Total revenue
The total amount of funds received by a seller of a good or service

Total revenue test
A method of estimating the price elasticity of demand by observing the change in total revenue from a price change.
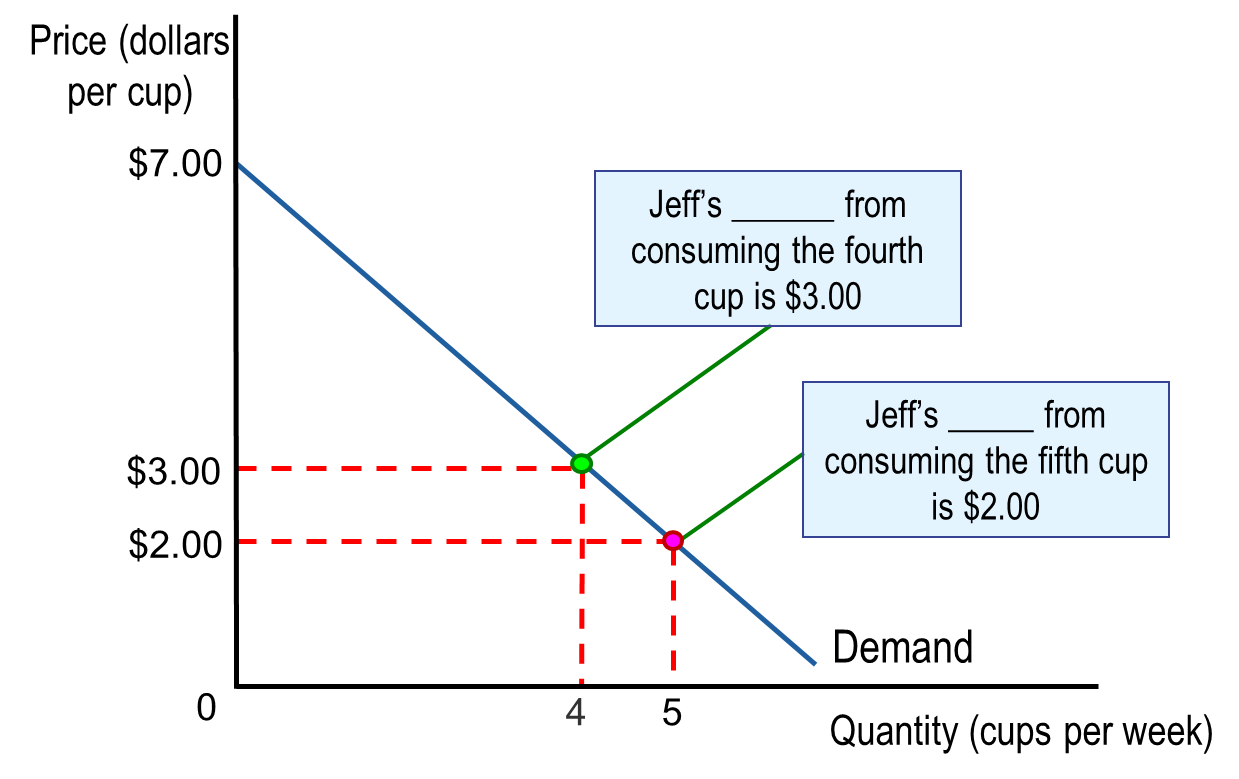
Marginal Benefit (MB)
The additional benefit to a consumer from consuming one more of a good or service (also the demand curve)
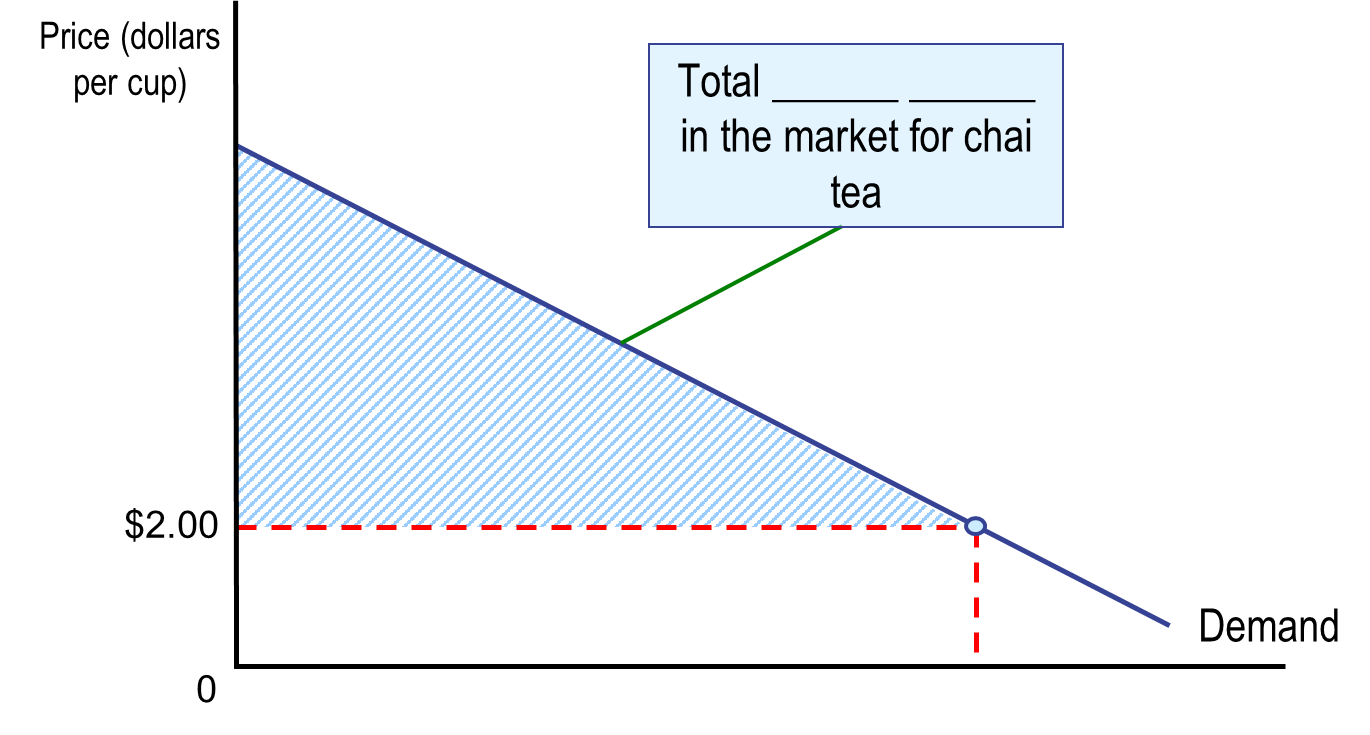
Consumer Surplus
The difference between the highest price a consumer is willing to pay and the price the consumer actually pays
Measures the net benefit (total benefit - total price paid) to consumers from participating in a market.
Marginal Cost (MC)
The additional cost to a firm from producing one more unit (also the supply curve).
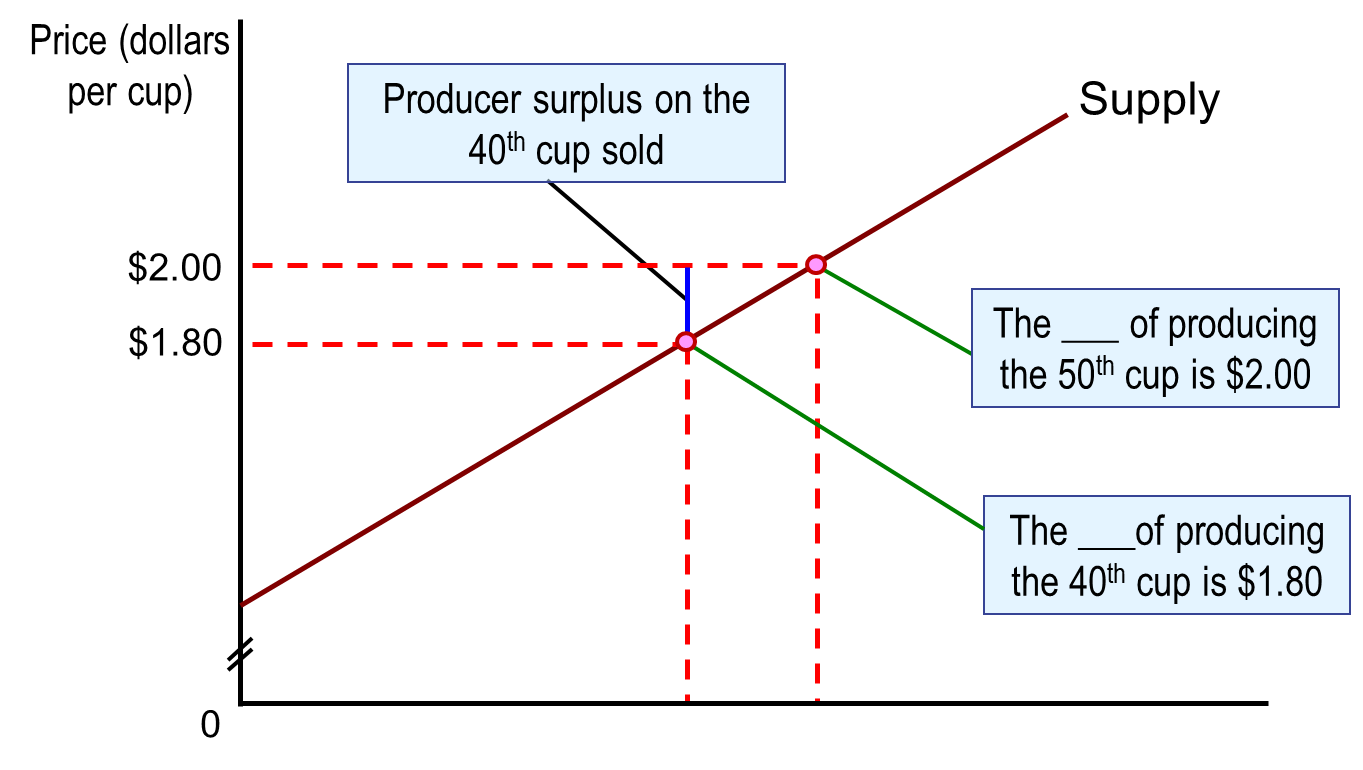
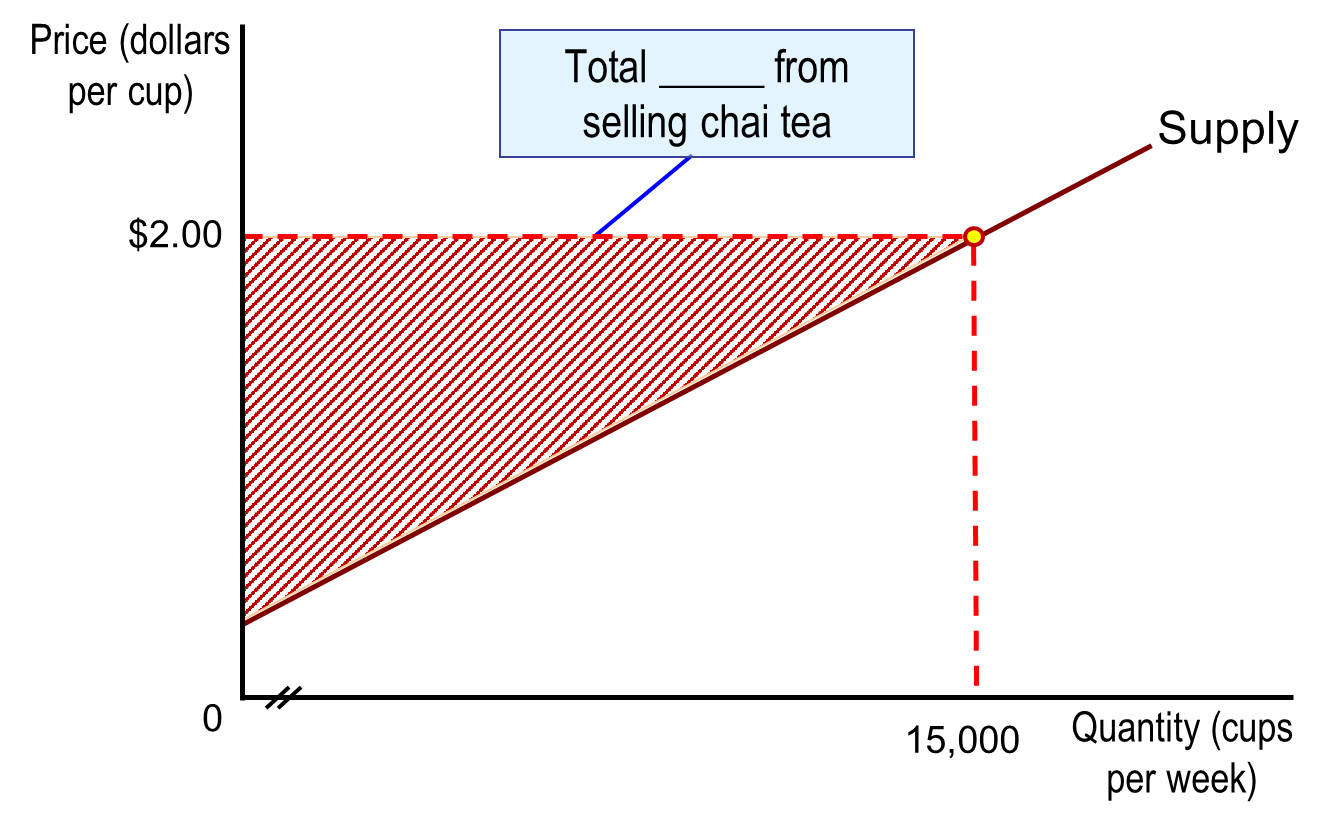
Producer Surplus
The difference between the lowest price a firm would have been willing to accept and the price it actually receives.
Measures the net benefit (total benefit - total cost of production) to producers from participating in a market.
Economic Surplus
Producer Surplus + Consumer Surplus
Effect of taxes on economic efficinecy
Finance government activities
Affect market equilibrium (and results in a decline in economic efficiency in a competitive market)
Reduce consumer surplus
Reduce producer surplus
Results in deadweight loss
Reduces production
Profit Maximisation
Why firms produce
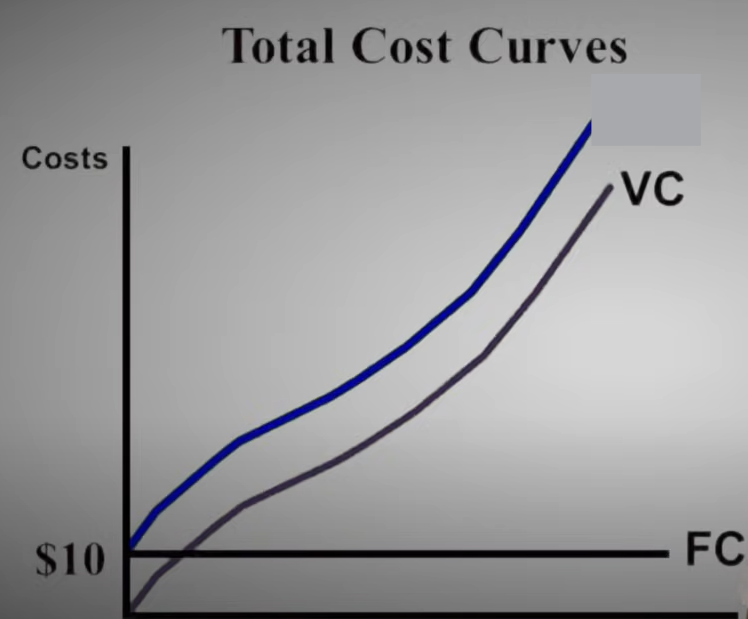
Variable Costs
The costs that change as the output of production changes
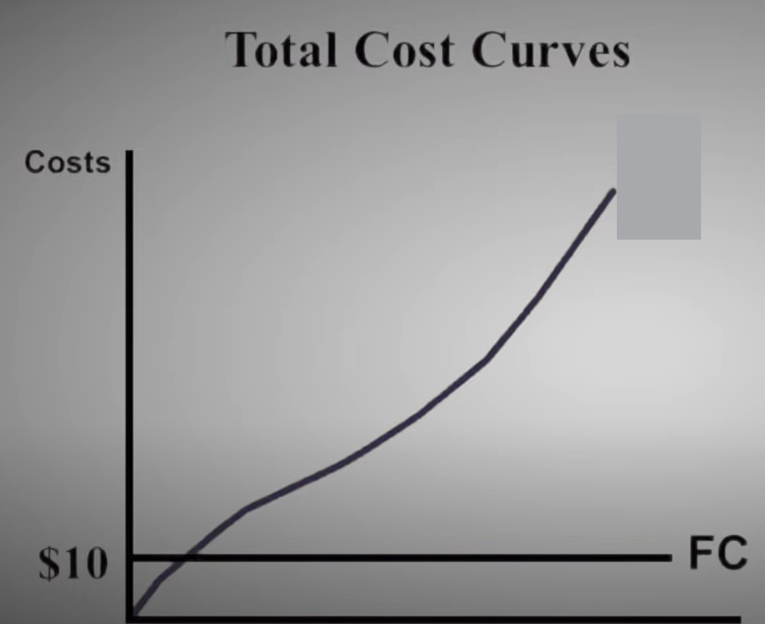
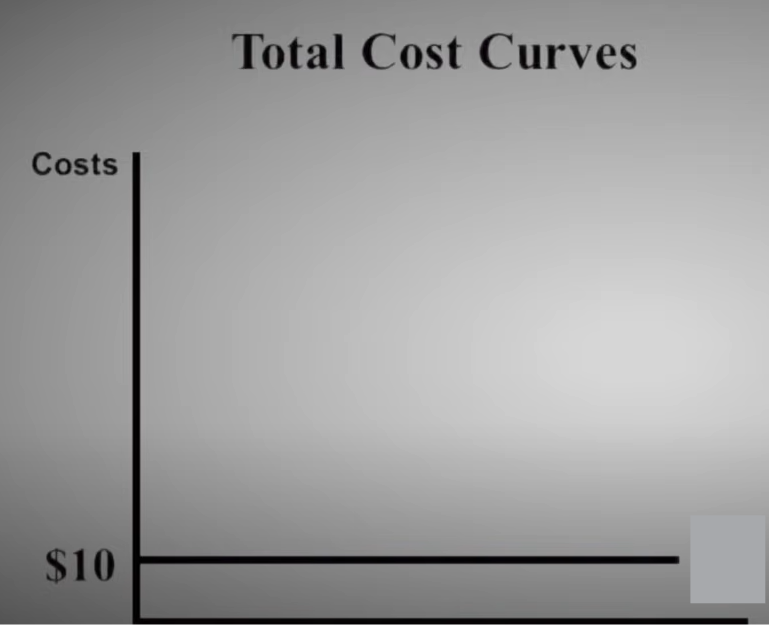
Fixed Costs
Costs that stay the same as the output of production changes
Explicit Cost
A cost that involves spending money
Implicit Cost
Non-monetary opportunity cost (eg. forgone income that could be earned)
Total Product
The quantity of a good produced over a certain time. Increases as input of labour increases.
Marginal Product of Labour (MP)
The additional output a firm produces as a result of hiring one more worker (increasing labour)

Law of Diminishing Returns
As a firm uses more of a variable input (eg. labour), with a given quantity of fixed input (eg. capital), the marginal product of the variable input (labour) eventually decreases.
Average Total Product (ATP)
The total product per worker employed.

Total Cost (TC)
The cost of all factors of production that a firm uses.
The sum of Total Fixed Cost and Total Variable Cost

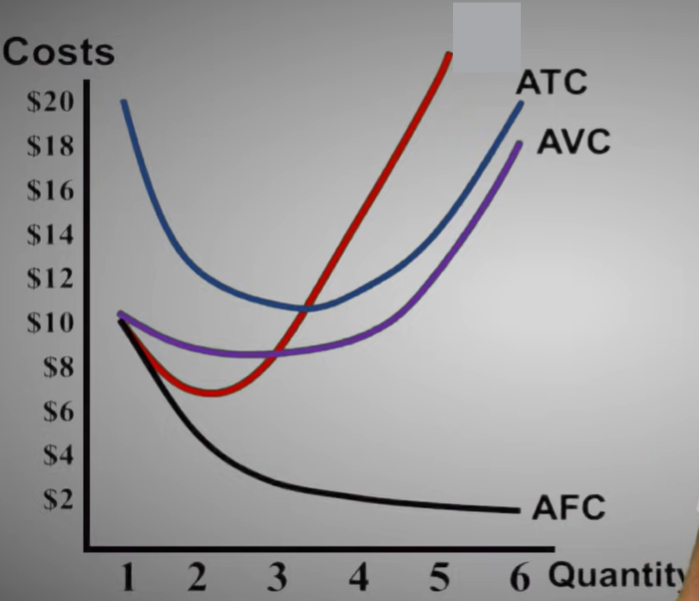
Average Fixed Cost (AFC)
The total fixed cost per unit produced

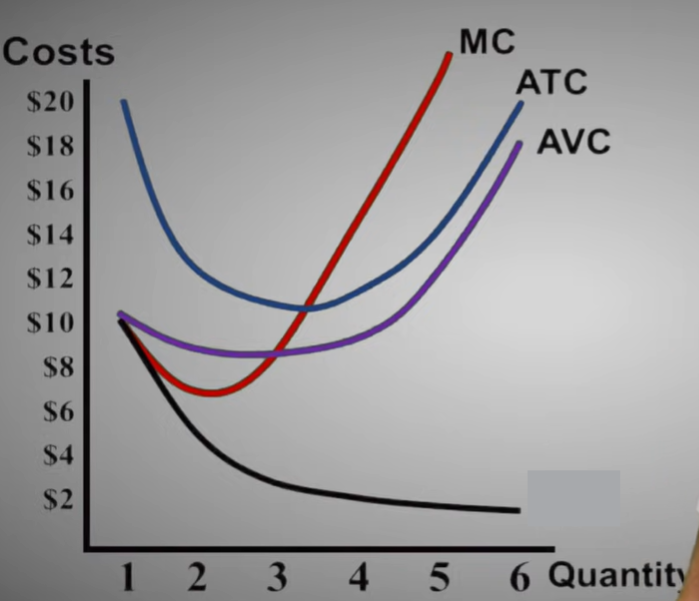
Average Variable Cost (AVC)
The total variable cost per unit produced
TVC/Q
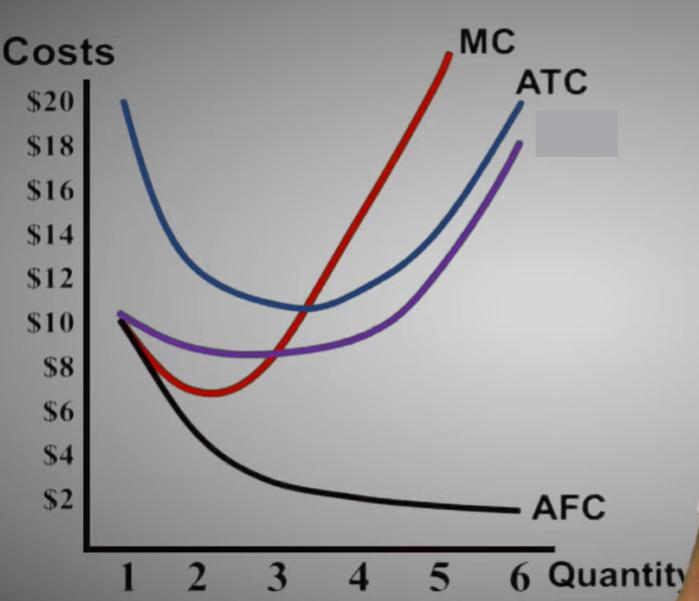
Average Total Cost (ATC)
The total cost per unit produced

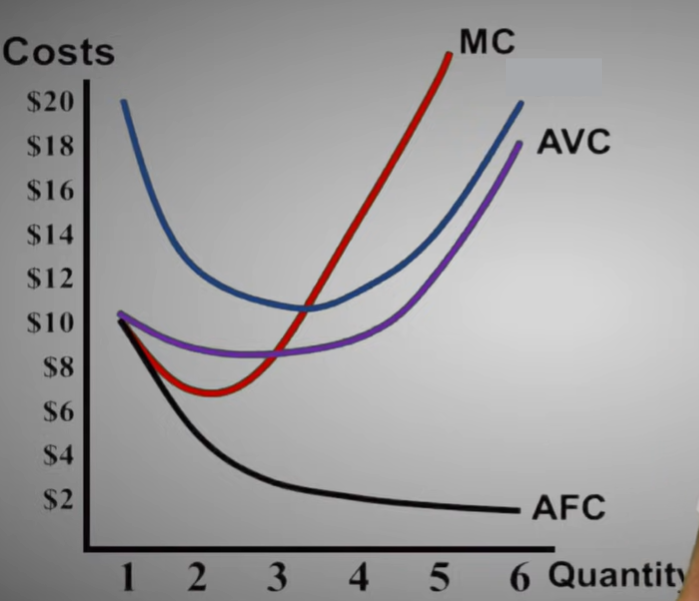
Marginal Cost (MC)
The change in a firm’s total cost from producing one more unit of a good or service.

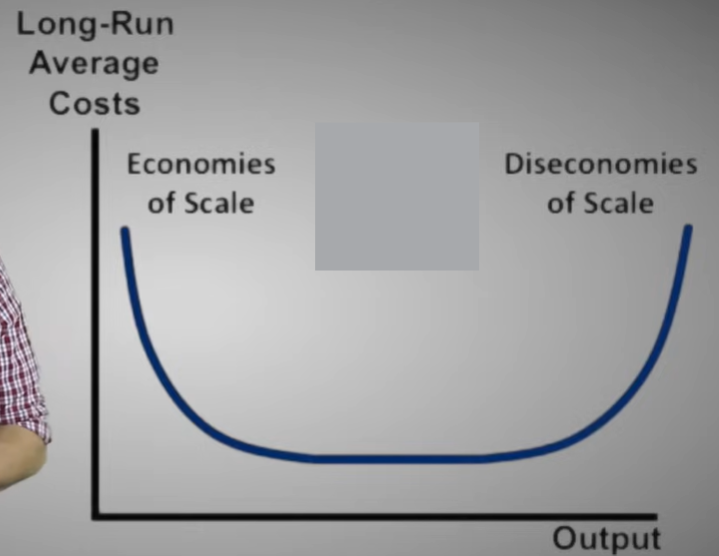
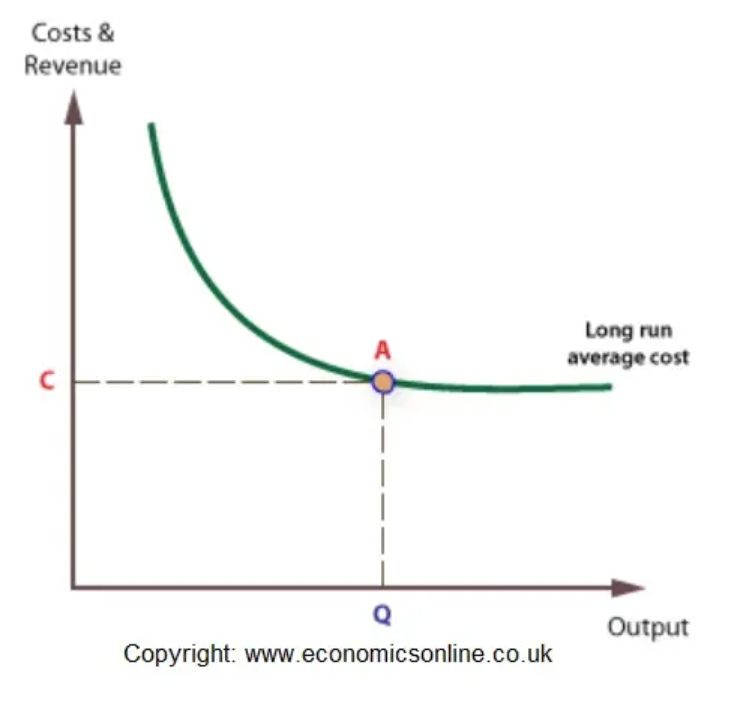
Long-run average cost curve
A curve showing the lowest cost at which a firm is able to produce a given quantity of output in the long run, when no inputs are fixed.
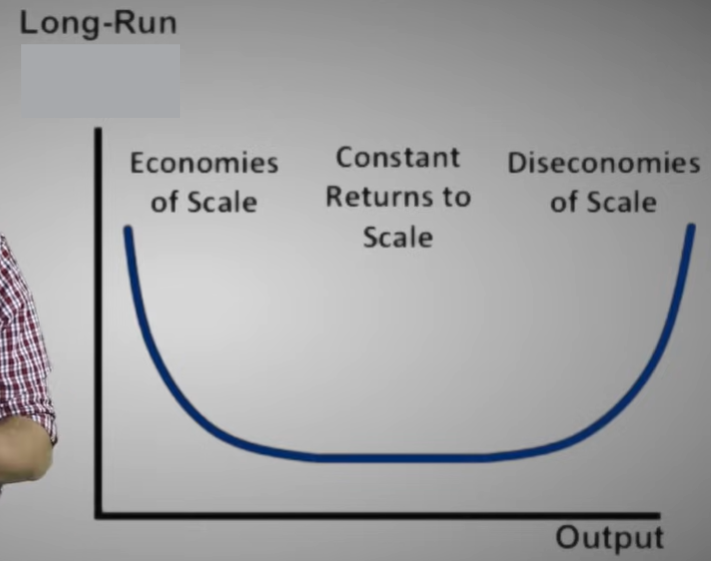
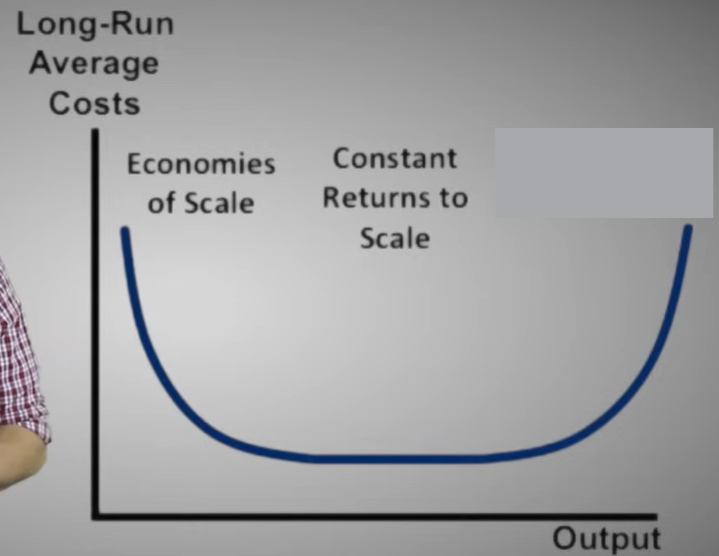
Economies of scale
Exist when a firm’s long-run average costs fall as it increases its scale of production and the quantity of output it produces
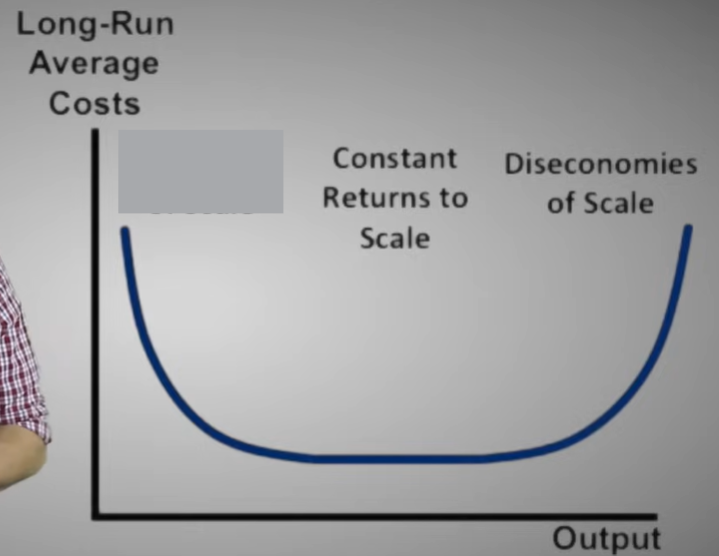
Constant returns to scale
Exist when a firm’s long-run average costs remain unchanged as it increases its scale of production and the quantity of output it produces.
Minimum efficient scale
The level of output at which all economies of scale have been exhausted. It is the minimum point on the long-run average cost curve.
Diseconomies of scale
Exist when a firm’s long-run average costs rise as it increases its scale of production and the quantity of output it produces.
Perfectly competitive market
There are many buyers and sellers
All firms sell identical products
No barriers to entry
Perfectly competitive firm
A firm that:
Can not affect the market price.
Is a Price taker: A buyer or seller that is unable to affect the market price. Takes the price from the market.
The demand curve for a price taker (firm) is horizontal, or perfectly elastic as every unit must be sold at the same given price.
P=MR=AR
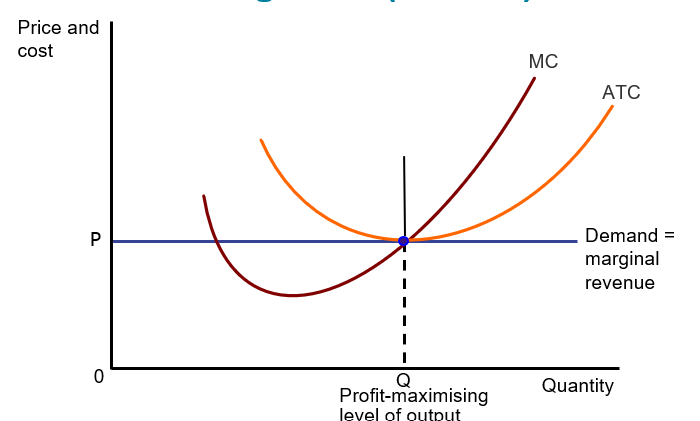
Break even in the long run
Average Revenue (AR)
Total revenue divided by units sold

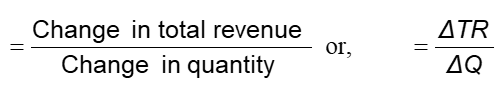
Marginal Revenue (MR)
Extra revenue from selling one additional unit
Also the demand curve
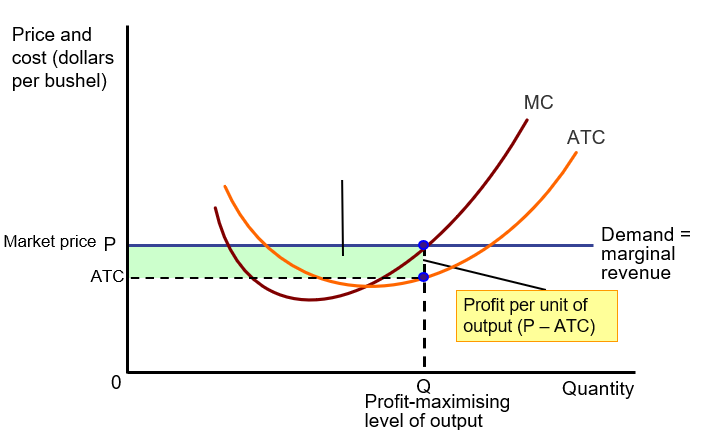
Profit-maximising level of output
The total level of output where the difference between total revenue and total cost is the greatest

Also where marginal revenue (MR) = marginal cost (MC)
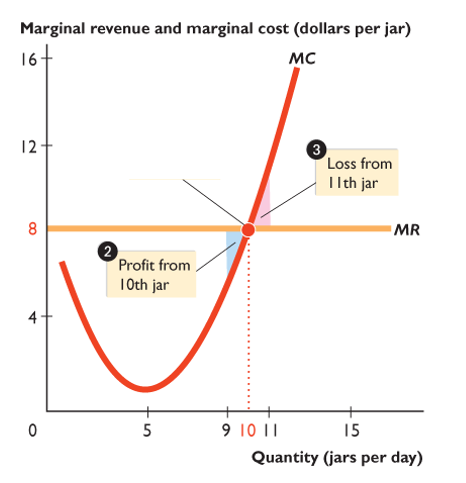
Marginal Analysis
Comparison of marginal revenue (MR) with marginal cost (MC)
Profit/Cost
Total Revenue (TR) - Total Cost (TC)
Economic Profit
Price (P) > Actual Total Cost (ATC)
Break-even
Price (P) = Actual Total Cost (ATC)
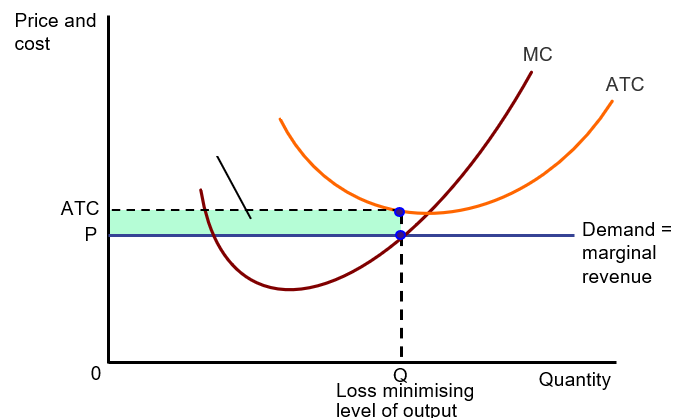
Economic Loss
Price (P) < Actual Total Cost (ATC)
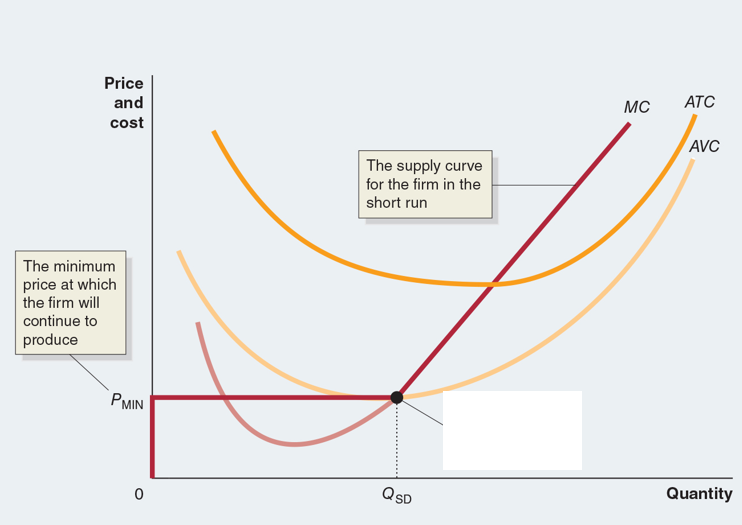
Shutdown Point
The minimum point on a firm’s average variable cost curve
Economic Profit leads to
New entry of firms
Economic Loss leads to
Exit of firms
Monopoly
A market where there is:
No competition
Unique product (no close substitutes)
Very high barriers to entry
Motivated by profit maximisation
Other firms in the market are not close enough substitutes to compete away economic profits in the long run.
Causes of barriers to entry
Government blocks the entry of more than one firm into a market.
One firm has control of a key raw material necessary to produce a good.
There are important network externalities in supplying the good or service.
Economies of scale are so large that one firm has a natural monopoly.
Monopolistic Competition
A market structure where:
Many firms compete.
Each firm produces a differentiated product.
A differentiated product has close substitutes, but it does not have perfect substitutes.
Firms are free to enter and exit.
Firms have some control over the price (price maker)
When the price of one firm’s product rises, the quantity demanded of that firm’s product decreases.
Allocative Efficiency
Where firms are producing at P=MC (or MB=MC).
No mark-up
Productive efficency
Where firms are producing at the lowest possible cost (P = min ATC)
No excess capacity
Excess Capacity
Firm produces at a quantity less than the average total cost is at minimum.
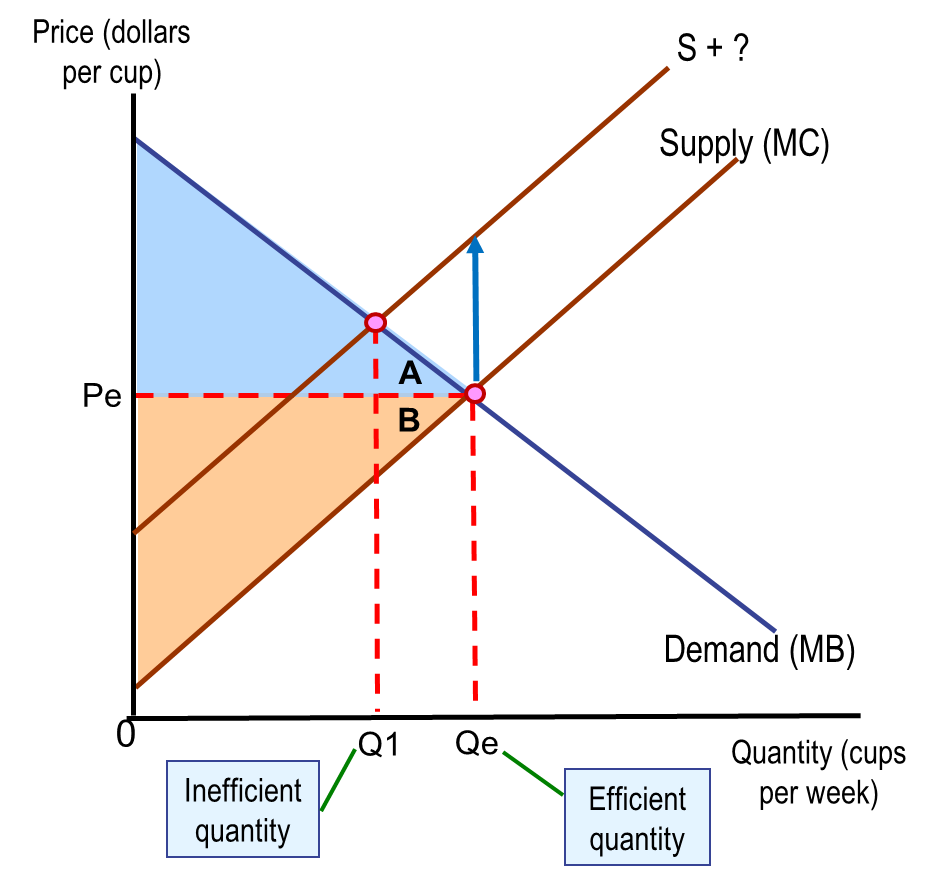
Positive externality
Occurs when a production or consumption activity benefits others who are not directly involved in that activity or do not pay for it.
Negative externality
Occurs when a production or consumption activity costs others who are not directly involved in that activity or do not pay for it.
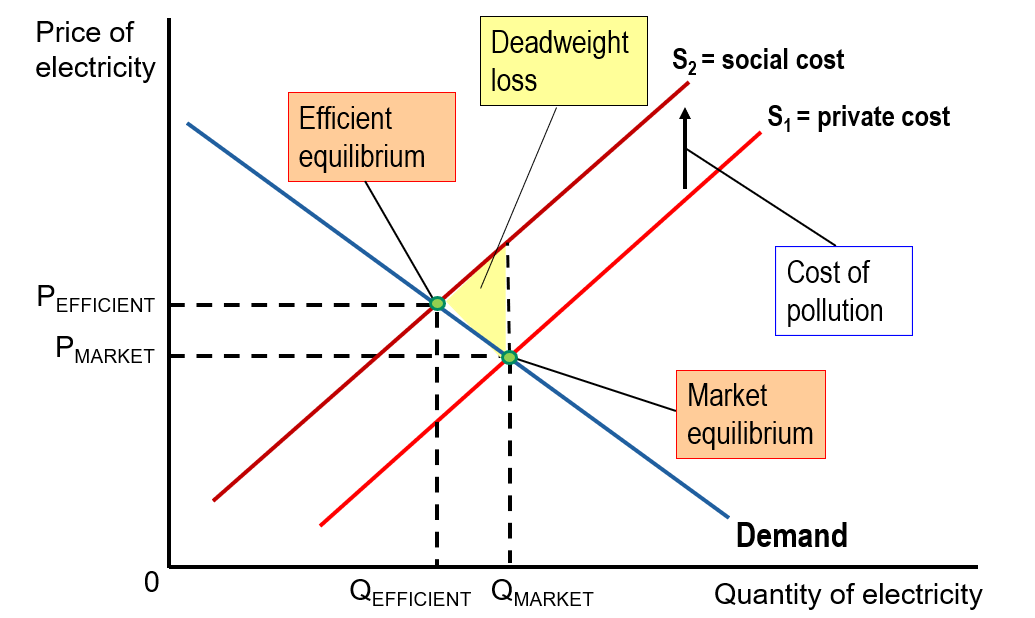
Private cost
The cost borne by the producer of a good or service
Social cost
The total cost of producing a good or service, including both the private cost and any external cost. (private cost + external cost)
Private benefit
The benefit received by the consumer of a good or service.
Social benefit
The total benefit from consuming a good or service, including both the private benefit and any external benefit. (private benefit + external benefit)
Macroeconomics
The study of the economy as a whole, including topics such as inflation, unemployment and economic growth.
Inflation rate
The percentage increase in the general price level in the economy from one year to the next.
Unemployment rate
The percentage of people in the labour force who are unemployed
Economic growth
The expansion of society’s productive potential, usually measured by the rate of growth in real GDP.
Business cycle
Alternating periods of economic expansion and economic contraction relative to the trend rate of economic growth.
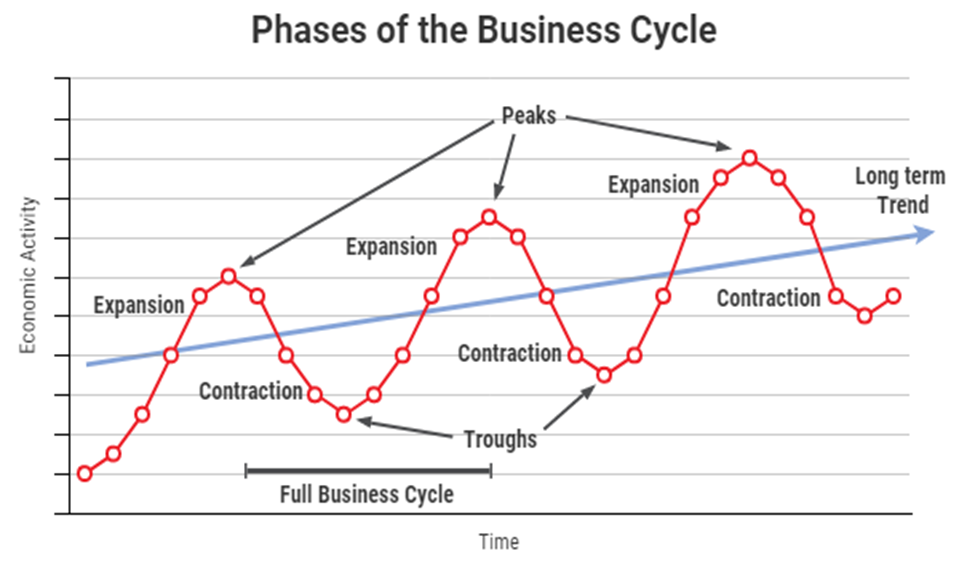
Expansion
The period of a business cycle during which total production and total employment are increasing above the trend growth.
Contraction
The period of a business cycle during which total production and total employment are falling below the trend growth.
Recession
The period of a business cycle during which total production and total employment are decreasing
Gross domestic product (GDP)
The market value of all final goods and services produced in a country during a period of time.
Measured using market values, not quantities.
Net domestic product (NDP)
Calculated by measuring GDP and subtracting the value of depreciation on capital equipment.
= GDP – depreciation
Gross National Income (GNI)
GDP plus income generated overseas by residents and firms minus the income generated in Australia by non-residents and foreign firms.
The total amount of money earned by a nation's people and businesses
The production method
Method of measuring GDP
The sum of the value of all goods and services produced by industries in the economy in a year minus the cost of goods and services used in the production process, leaving the value added by the industries.
The expenditure method
Method of measuring GDP
The sum of the total expenditure on goods and services by households, investors, government and net exports (the value of exports minus the value of imports).