BIO 192 Exam III
1/203
There's no tags or description
Looks like no tags are added yet.
Name | Mastery | Learn | Test | Matching | Spaced | Call with Kai |
|---|
No analytics yet
Send a link to your students to track their progress
204 Terms
Inclusive fitness
producing your own offspring and helping close relatives with offspring
What is population ecology
the study of factors affecting the size of a population and how it changes over time
What is a population?
Group of individuals of a single species living in the same general area
Population size is impacted by… (4 things)
Birth
Death
Immigration
Emigration
Often, we model immigration and emigration as very _______ in a population
low
Population size can vary depending on _________
taxa
where they…
reach a stable zie
fluctuate irregularly
rise and fall in regular cycles
What is taxa?
groups of organisms classified based on shared characteristics
Species example of population graph that reaches a stable size over time (stable)
Bacteria
rapid population growth
persist at high numbers
around carrying capacity
Species example of population graph that fluctuates irregularly (irregular)
Algae
Boom-busted based on external factors
Influx of phosphorous
Species example of population graph that rises and falls in regular cycles (cyclic)
Hare
Cyclical with predator
predator-prey
boom and bust
What are the four population size graphs
Stable, Irruptive, Cyclic, Irregular
Species example of population graph that exhibits very little change in population size over time punctuated with a boom-bust (irruptive)
Deer
When birth rates = death rates, there is ______ population growth
stable
This population graph is difficult to predict and depends on abiotic and biotic factors
irregular
This population graph shows a predictable boom-bust and exhibits a predator-prey cycle of rise and fall
cyclic
What is population density
Number of individuals per unit area or volume
EX) number of oak trees per square kilometer in Illinois
What are density-dependent factors?
Change in birth rate or death rate that does fluctuate with population density
Implies certain limiting factors cause growth rate to change as density increases
EX) Competition for limited food among members of a population
What are density-independent factors?
Change in birth rate or death rate that does not fluctuate with population density
Cannot regulate population size
EX) Natural disasters like forest fires – impacts small or large pops equally
Population density is __________
variable
Kelp-Perch population density
Density dependent
Kelp abundance is the limiting factor
Low density in Kelp-Perch population density means…
More hiding spots
Low death rate
Lower predation
High density in Kelp-Perch population density means…
Fewer hiding spots
High death rate
Greater predation
Population density is impacted by…
Competition for resources
Territoriality
Toxic wastes
Disease
Intrinsic factors
Mechanisms that cause density-dependent regulation:
Predation
Disease
Competition for resources
Intrinsic physiological factors
Territoriality
Toxic wastes
Impact on population density from competition for resources
High population density
Intense competition for resources
Reduction in birth rates
EX) Agriculture
Farmers reduce competition by applying fertilizers to reduce nutrient limitations on crop yield
Impact on population density from disease
High population density
Transmission rate increases as the population becomes more crowded
Increase in death rates
EX) Virus/bacterial infection like influenza, COVID, and tuberculosis affect a greater percentage of people in densely populated cities than in rural areas
Impact on population density from territoriality
High population density
Spaces become the resource for which individuals compete
Decrease in birth rates
Increase in death birth
EX) Marking. Cheetahs use chemical markers in urine to warn other cheetahs of their territorial boundaries
Impact on population density from intrinsic factors
High population density
Physiological factors regulate populate size
Birth rates change based on effect
Death rates change based on effect
EX) Hormones. Hormonal changes in white-footed mice delay sexual maturation and depress the immune system at high density. Birth rates drop even when food and shelter are abundant
Impact on population density from toxic wastes
High population density
Accumulation of toxic wastes at high population
Birth rates change based on toxic concentration
Death rates change based on toxic concentration
EX) Ethanol. Concentration of ethanol produced by brewer’s yeast becomes toxic at high population density
Are large mammal population stable?
Long-term studies show that they can fluctuate substantially
EX) Isle Royale mammals, which inhabit Isle Royale, a 200 sq mile island in Lake Superior
Two major population increases and collapses in the moose population in the last 50 years
The first collapse coincided with a peak in the wolf population (density dependent), the second with harsh winter conditions (density independent)
Predictable cycles in population size (Snowshoe hare and Lynx example)
Some populations undergo regular boom-and-bust cycles
EX) snowshoe hares and lynx both follow roughly 10-year population cycles in the forests of northern Canada and Alaska
Expect Lynx to increase and decrease in response to the availability of prey. Unclear why the hare population cycles.
Two hypotheses proposed to explain the
hare’s population cycle.
1. It follows a cycle of winter food supply (less food in winter for hares)
Hypothesis 1 – Winter food supply
Cycles should stop if the food supply is increased. Those populations provided with additional food increased in size.
But continued to cycleFood supplies alone do not cause the
population cycle in snowshoe hares
2. It is caused by predator-prey
interactions (lynx numbers directly impact hare numbers)Hypothesis 2 – Predator-prey
Predation by several species killed 95% of the hares in these studies
-None died of starvationWhen predators were excluded from
certain areas, the collapse in hare
survival was nearly eliminated.Overexploitation by predators is an
essential factor affecting snowshoe hare
cycles
Population size can vary depending on taxa (Rabbits from Australia example)
Invasive species biology may provide clues
No natural predators, population explodes in local area
Food resources (i.e., grass) then become scarce and population density drops
Human-induced population controls
- Still results in cyclical patterns
What is dispersion?
Pattern of spacing among individuals within the boundaries of the population
Name the three types of dispersion patterns
Clumped, Uniform, and Random
How are dispersion patterns determined?
Determined by the spacing among individuals within the boundaries of a population
Differences in spacing can provide insight into the biotic and abiotic factors affecting individuals
Describe the Clumped Dispersion Pattern
Most common pattern of dispersion
Individuals aggregate in patches
Individuals may aggregate in areas of
high resource availability or favorable
physical conditions
-Resources are patchyMating behavior and group predation
or defense against predators can also
influence clumped dispersions
Why might individuals aggregate in certain areas in patches? (clumped dispersion pattern)
To be in areas of high resource availability or favorable physical conditions
Since ____________ are patchy, so will be population dispersion (clumped pattern)
resources
Beyond resource dispersion and physical conditions, why might indiviudals clump in one area?
Mating behavior and group predation or defense against predators
Describe the Uniform Dispersion Pattern
Individuals are evenly spaced
Why might individuals exhibit a uniform dispersion pattern?
Direct interactions between individuals
Some plants secrete chemicals that inhibit germination and growth of competing individuals
Animals often exhibit territoriality, the defense of a bounded physical space against other individuals
What do some plants do that trigger a uniform dispersion pattern?
Some plants secrete chemicals that inhibit germination and growth of competing individuals
_________ often causes a uniform dispersion pattern
Territoriality
Describe the Random Dispersion Pattern
Unpredictable spacing among individuals
Position of each individual is independent of other individuals
Typically impacted by abiotic factors
Random dispersion patterns are often impacted by _______ factors
Abiotic (soil, pH, precipitation, salinity)
In random dispersion patterns, there is ______ variation in spacing among organisms
high
Random dispersion patterns commonly occur within _________ environment
uniform
Wind dispersed plants is an example of _______ dispersion
random
What is a survivorship curve?
Plot of the proportion or numbers in a cohort still alive at each age.
Illustrates pattern of survivorship in a population
Humans usually exhibit type ___ survivorship curves
type 1.
Survivorship drops steeply at old age
Describe type 1 survivorship curves
Low death rates in early/middle life
Survivorship drops steeply at old age
Few offspring
High parental investment
Which survivorship curve often shows high parental investment?
Type 1
Which survivorship curve often shows few offspring?
Type 1
Many large mammals, including humans and elephants, exhibit what type of survivorship curve
type 1
Describe a type II survivorship curve
Constant mortality throughout life
What types of animals exhibit a type II survivorship curve?
Rodents
Lizards
Invertebrates
Annual plants
Which survivorship curve type is linear?
Type 2
Describe a type III survivorship curve
High death rate early in life
Low survivorship
Low death rate in late life
High number of offspring
Low parental investment
Opposite to type I survivorship curves, type _____ curves exhibit low death rate in late life and low parental investment
type III
What are some organisms that have a type III survivorship curve?
Oysters
Octopus
Population size is impacted by…
Birth
Death
Immigration
Emigration
Often, we model _______ and _______ as very low in a population
immigration and emigration
Maximizing reproductive success
Understanding life history involved learning about how organisms survive to reach reproductive age and then characterizes differences in their reproductive strategies
An organism’s life history entails three key components:
The age at first reproduction (reproductive maturity)
How often the organism reproduces (frequency)
How many offspring are produced per reproductive episode
Understanding life history involved learning about how organisms ________________ and then characterizes differences in their __________
survive to reach reproductive age; reproductive strategies
Two different species and their different age of first reproduction
Loggerhead turtles typically
begin reproducing when
they are about 30 years oldCoho salmon first
reproduce when they are
only three or four years old
Organisms vary in how often they ________
reproduce
What is semelparity?
Organisms undergo a “one-shot” pattern of reproduction
One very large reproductive event
(octopus, salmon, small marsupials)
Name the two types of reproductive frequencies
Iteroparity and Semelparity
Which reproductive pattern only happens once
semelparity (semel = once)
What is iteroparity?
Organisms undergo repeated reproductive events throughout their lifetime
Fewer offspring
Increased investment per offspring
(Cichlids, elephants, albatross)
Which reproductive pattern exhibits increased investment per offspring and fewer offspring?
Iteroparity (intero = again)
There is variation in the _________ of offspring produced per reproductive event
number
EX) White rhinoceros produce only one calf per reproduction
Insects and many plants produce large numbers
Name the two factors that impact the number of reproductive events
Probability adult will survive between reproductive events
Survival rate of offspring
Low survival (Semelparity)
High survival of adult and offspring (Iteroparity)
Which survivorship curves exhibit iteroparity strategy
Type I and some Type II
Reproduce many time over a single life span
High survival until late in life
Which survivorship curves exhibit a semelparity strategy?
Type III and some Type II
Reproduce single times over a life span, minimal parental investment
Low survival until later in life
Why do trade-offs occur?
Because organisms do not have access to unlimited resources
Because fundamental difference between what is good for the parent and what is good for the offspring
Use of resources for one function can _________ the resources available for another function
reduce
Cannot simultaneously put resources into reproduction and survival
Selective pressures influence trade-offs between the number and size of offspring
Caring for young can impact ___________
survivorship
Caring for a larger number of young reduced survival rates of parents in Eurasian kestrels.
Require help from both parents to keep
young alive – many resources needed.
________ pressures influence trade-offs between the number and size of offspring
Selective
What are selective pressures?
evolutionary force that causes a particular phenotype to be more favorable in certain environmental conditions. Selective pressures are considered forces that drive evolution via natural selection
Young have a low chance of survival —> will produce ________ small offspring
many
Plants that colonize distributed environments (dandelions), usually produce many small seeds
Parents produce relatively few offspring —> Invest _______ energy into each offspring and _________ the probability of survival for each
more; increases
Brazil nut trees produce large seeds packed with nutrients that help seedlings become established
What is K-selection
Life history traits that are advantageous when
Population size sits around K (carrying capacity)
Density is high
Constant conditions
Resources are low
Competition is strong
Large size — low reproductive rates
While K-selected organisms stay near ___________, r-selected species population sizes tend to oscillate (or boom-best)
carrying-capacity
What are r-selection
Life history traits that are advantageous when:
Population size oscillates around K (boom-bust)
Density is low
Little competition for resources
High reproductive rates
Fast maturation (small)
Rapid colonizing ability
Name some K-selected species
Elephants, sharks, humans, whales, parrots, eagles
Name some r-selected species
Crabs, mussels, fish, mice, rats
Logistic growth appears in the shape of an
S
Exponential growth appears in the shape of a
J
When does exponential growth occur
When there are no limitations (unlimited space and resources)
Equation for population growth
dN/dt = B — D
where…
dN is the change in population size
dt is the time interval
B is the birth rate
D is the death rate
EX) Births = 120 cichlids in one year, Deaths = 20 cichlids in one year
So, 120 cichlids/year — 20 cichlids/year = Growth by 100 cichlids/year
To get per capita growth rate or r value, you need to…
population growth rate / population (N)
EX) 100/1000 = 0.1/year
With exponential growth, per capita growth rate ( r) does not change even if population gets too _______
large
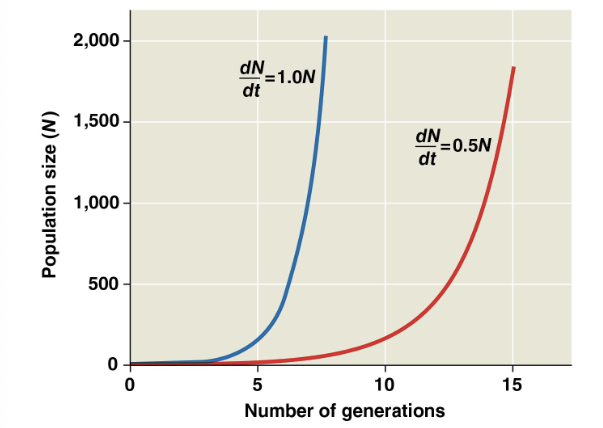
Equation for exponential growth
dN/dt = rN
per capita growth rate ® does not change even if population gets large
Equation for ligistic growth
dN/dt = rN (K —N/K)
What is logistic growth
occurs when there are limitations
(limited space, resources etc.)
Carrying capacity = ____
K
Number of individuals of a species that can be supported by the resources with a given area
per capita growth rate = _________
r
Example of an S-shaped curve graph
Paramecium
• Growth of laboratory populations of some small animals and microorganisms fit an S-shaped curve if resources are limited
• These populations are grown in a constant environment lacking predators and competitors