Macroeconomics Flashcards
1/268
There's no tags or description
Looks like no tags are added yet.
Name | Mastery | Learn | Test | Matching | Spaced | Call with Kai |
|---|
No analytics yet
Send a link to your students to track their progress
269 Terms
What are the shifters of demand?
TONIE
Tastes
Other Goods (Substitutes/Complements)
Number of Buyers
Income
Expectations
What are the shifters of supply curve?
Expectation of future Prices
# Producers
Technology
Price of other things
Price of inputs (How much it costs to make smth vs another)
Why does the demand curve shift down?
SLIM
Substitution effect,
law of diminishing
Income effect,
marginal utility
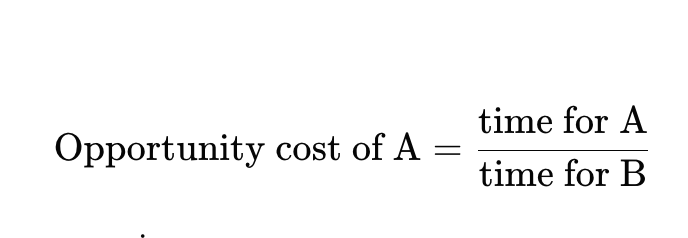
Opportunity cost formula for input
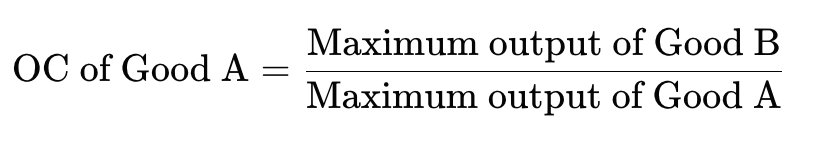
Opportunity cost formula for output
GDP
All of the final goods and services produced in a country
GNI
All of the final goods or services produced by a countries citizens/businesses
Unemployment
Anyone who is willing and able to work that is not employed
Unemployment rate
Unemployed / labor force
Labor Force
Total of everyone willing and able to work
Natural Rate of Unemployment
When an economy is at full employment (ppl can get job at a normal amount of time)
Calculate Cyclical Unemployment
Cyclical Unemployment = Actual Unemployment - Natural Rate of Unemployment
What is Cyclical Unemployment
Ups and Downs in the Business cycle.
Recessions (Downturns): Unemployment increases as businesses reduce production and lay off workers due to lower consumer spending and demand.
Expansions (Upturns): Unemployment decreases as demand grows, prompting businesses to hire more.
Calculate Natural Rate of Unemployment
Structural + Frictional
Structural unemployment
When skills dont match with jobs available
Frictional Unemployment
Natural Period it takes to get a job
Labor force participation rate
LF/ (LF + not in LF)
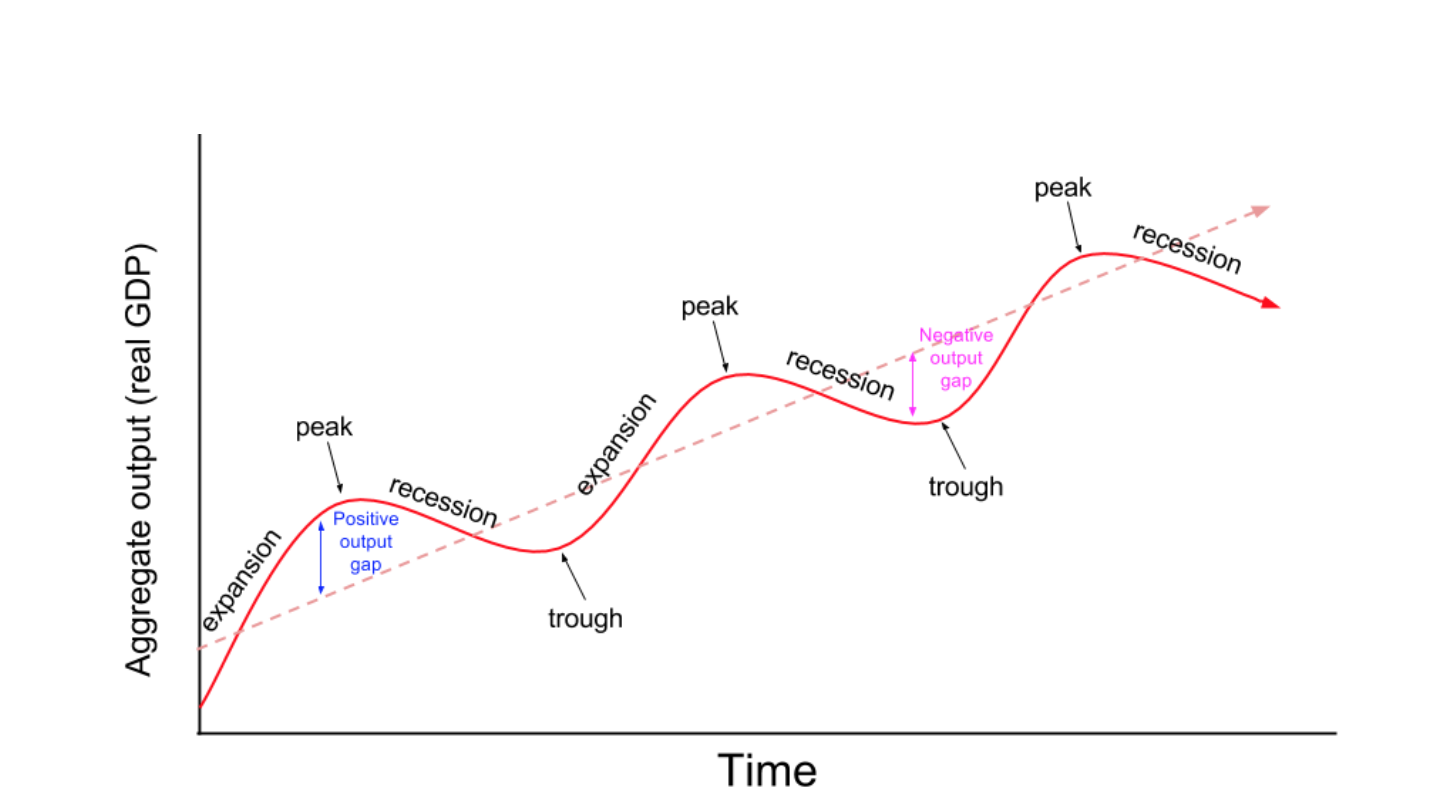
Draw The business cycle
Investment Definition
Something you do for future gain
Investment Examples (Firms)
Capital Goods, Inventory, NEW Building/Equipment
Investment Examples (Households)
HOUSES ONLY
Examples of things that are not investments that count towards GDP
Stocks, Education, Cars (For households), etc.
Consumption Goods
Anything you buy with no future benefit.
Capital Goods
Goods that produce a future economic benefit
Four Factors of Production
Land
Labor
Capital
Entrepreneurship
Land
Any Natural Resource
Labor
Human work that is put in to make a good or service
Capital
Any good that is used to produce another/has a future value
Entrepeneurship
AKA Technology - Creating a good or service by using the Four Factors of Production
Capital Good Example
Clothing Machines
Consumption Good Example
Movie Ticket
Positive Statement
A statement that can be proven/disproven
Normative Statement
An opinion
Ceteris Paribus
All things Equal (No external factors)
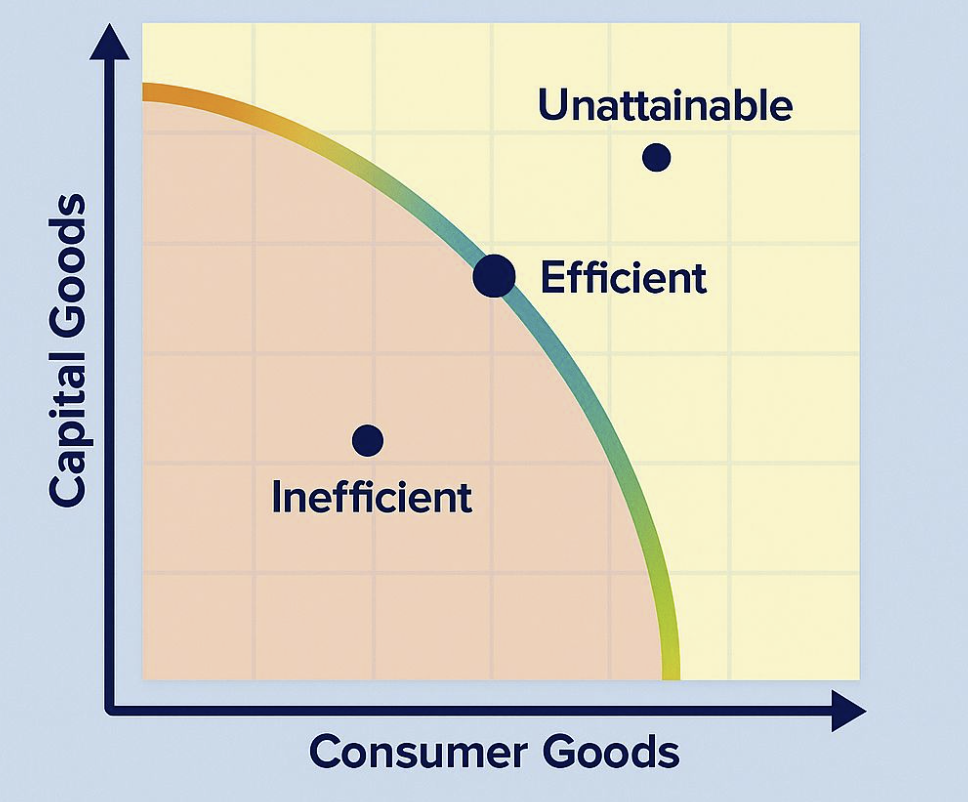
Production Possibilities Curve
Opportunity Cost
AKA Marginal Cost - The next best thing you lose
Comparative Advantage
When your opportunity Cost is lower than anothers
Absolute Advantage
Whoever can make more given the same amount of resources
OR Make same amount in less time
Trade
Beneficial
Curved PPC
Increasing Opportunity Cost
Linear PPC
Constant Opportunity Cost
How Does Trading Occur
Through Specialization
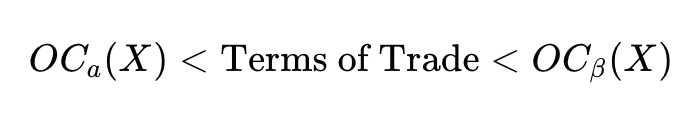
Determine Terms of Trade
Law of Demand
If Prices go up, Quantity Demanded goes down.
Demand
Entire Curve
Quantity Demanded
Point along demand curve
Substitutes
Goods that can replace each other
Complement Goods
Goods that are consumed together
Normal Good
A good that’s demand goes up when incomes go up
Inferior Good
A good that’s demand goes down when income goes up.
Expectations (Demand)
If people expect prices to go up later, they buy now
If people expect prices to go down, they will buy Later
Expectations (Supply)
If producers expect higher future prices, they are more likely to reduce current supply to sell more later.
If producers expect lower future prices, they are more likely to increase current supply to sell before prices fall.
Law of Supply
If prices go up, quantity supplied goes up
Supply and Demand Graph
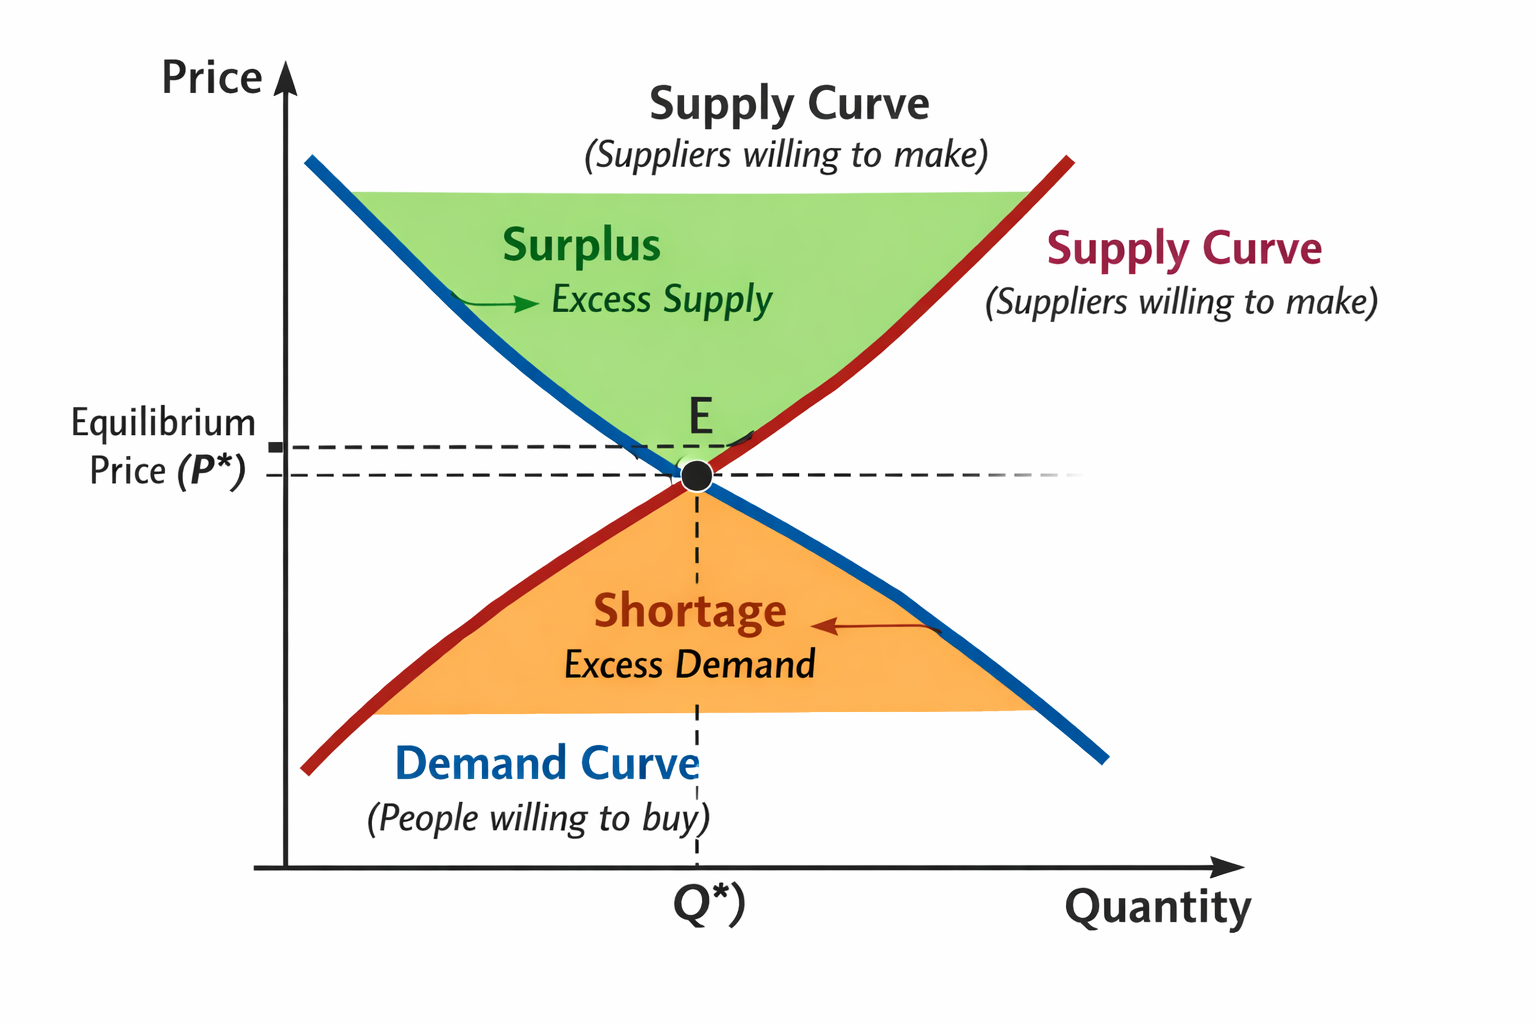
Shortage
Bellow Graph - Quantity Demanded is higher than the Quantity Supplied
Surplus
Above Graph - Quantity Supplies is higher than quantity demanded
Equilibrium
When quantity demanded is the same as quantity supplied (intersection)
expenditures approach
The expenditure approach adds up all the spending done in the economy by households, businesses, the government, and other countries.
income approach
The income approach adds up all the income earned in the economy, including wages, rent, interest, and profit.
value-added approach
The value-added approach calculates GDP by adding up the dollar value added at each stage of the production process.
Expenditure Approach Equation
GDP = C+I + G + (X−M)
Income Approach Equation
GDP=W+R+i+P+Indirect Taxes−Subsidies+ Depreciation
W (Wages): Income earned by labor.
R (Rent): Income earned from land and natural resources.
i (Interest): Income earned from capital.
P (Profit): Corporate profits and proprietors’ income.
Indirect Taxes - Subsidies: Taxes on production minus government subsidies.
Depreciation: Also called capital consumption allowance; accounts for wear and tear on capital.
Value-Added Approach Equation
(Value of Output−Value of Intermediate Goods)
Limitations of GDP
Under the table
Ilegal
Non Marketed Goods (unpaid household work, volunteer labor, wildlife, public goods, e.g., streetlights)
GDP per Capita
GDP / Population
Inflation
When the Price of a Good Rises
What is CPI
Consumer Price Index: Avg. Change over time that consumers pay for a basket of goods
CPI Equation
CPI = (Cost of Basket Current Year) / (Cost of Basket Base Year)
Deflation
Negative Inflation
Disinflation
Sustained decrease in price level
Price Index
Measure that calculates changing costs
“real ___ “
Adjusted for inflation
“Nominal ___ “
Not adjusted for inflation.
Purchasing Power
What can actually be bought with your money
Inflation Rate Equation

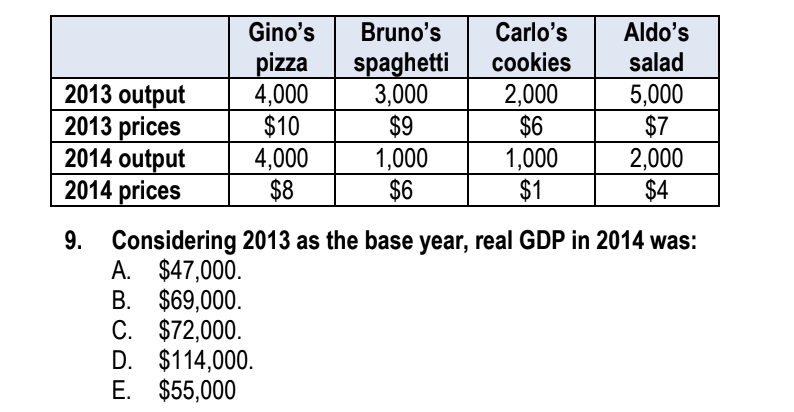
Real GDP Equation
Nominal GDP / GDP Deflator
Economic Growth
When the Potential of growth increases
depression
long recession
negative output
When an economy’s actual output is bellow potential output
Potential Output
the maximum sustainable level of goods and services an economy can produce using all its resources (labor, capital, technology) efficiently, without causing inflation to rise
Positive Output
When economy’s actual output is above potential output
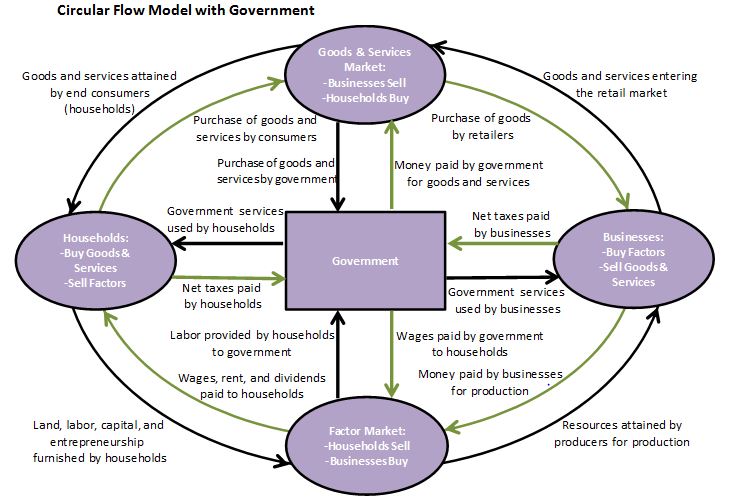
Full Circular Flow Model
Real Value Formula
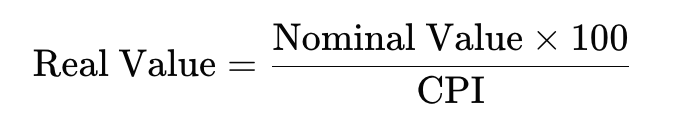
Assume the CPI is 140 and the value of a market basket adjusted for inflation is $200. What is the dollar value of the basket in current prices?
$280=(200x140)/100
What is the difference between the CPI and the GDP Deflator?
The CPI measures prices of a fixed basket of consumer goods. The deflator is an index number that measures all prices and is used to convert nominal GDP into real GDP.
What's Measured: All domestic production (GDP Deflator) vs. household consumption (CPI).
Imports/Exports: GDP Deflator includes exports but not imports; CPI includes imports but not exports.
Basket Type: Variable (GDP Deflator) vs. Fixed (CPI).
Identify the equation for the GDP deflator:
(Nominal GDP / Real GDP) × 100
How can CPI Overstate Inflation
if consumers substitute cheaper goods.
Identify who is hurt and who is helped by unexpected inflation.
Savers and lenders (that lend at fixed interest rates) are hurt, and borrowers are helped.
B.
Real Interest rates vs Inflation
Inverese
Nominal Interest rates vs Inflation
Directly related because banks raise Nom when Inf is high
Aggregate Demand
The total Demand in an economy
AD Curve
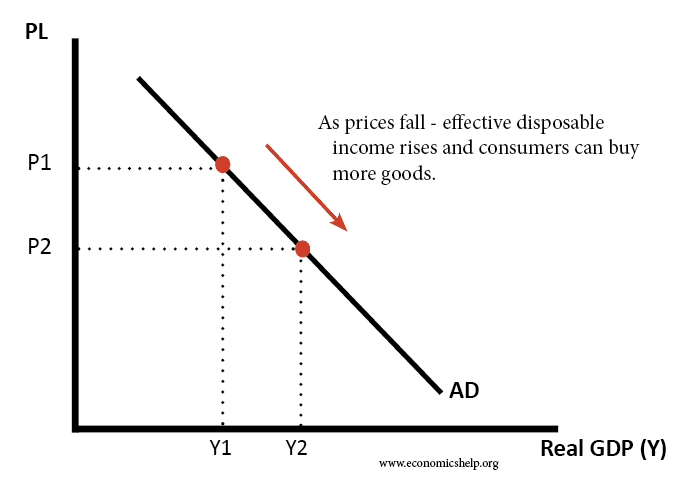
Reasons AD Curve is downward sloping
Wealth Effect. As Prices go down people will be able to buy more.
Interest Rate Effect. As Price levels go down interest rates go down so more investment can happen (loans)
Foreign Currency Effect. As Price levels go down foreigners will view it cheaper to buy products in our country so exports go up.
Things That Shift AD Curve
C + I + G + NX. If the cause is a change in the price level, it is a movement along the curve. If the cause is something besides a change in the price level, the entire AD curve will shift.
ALSO MONETARY POLICY
How does MPC Multiplier Work?
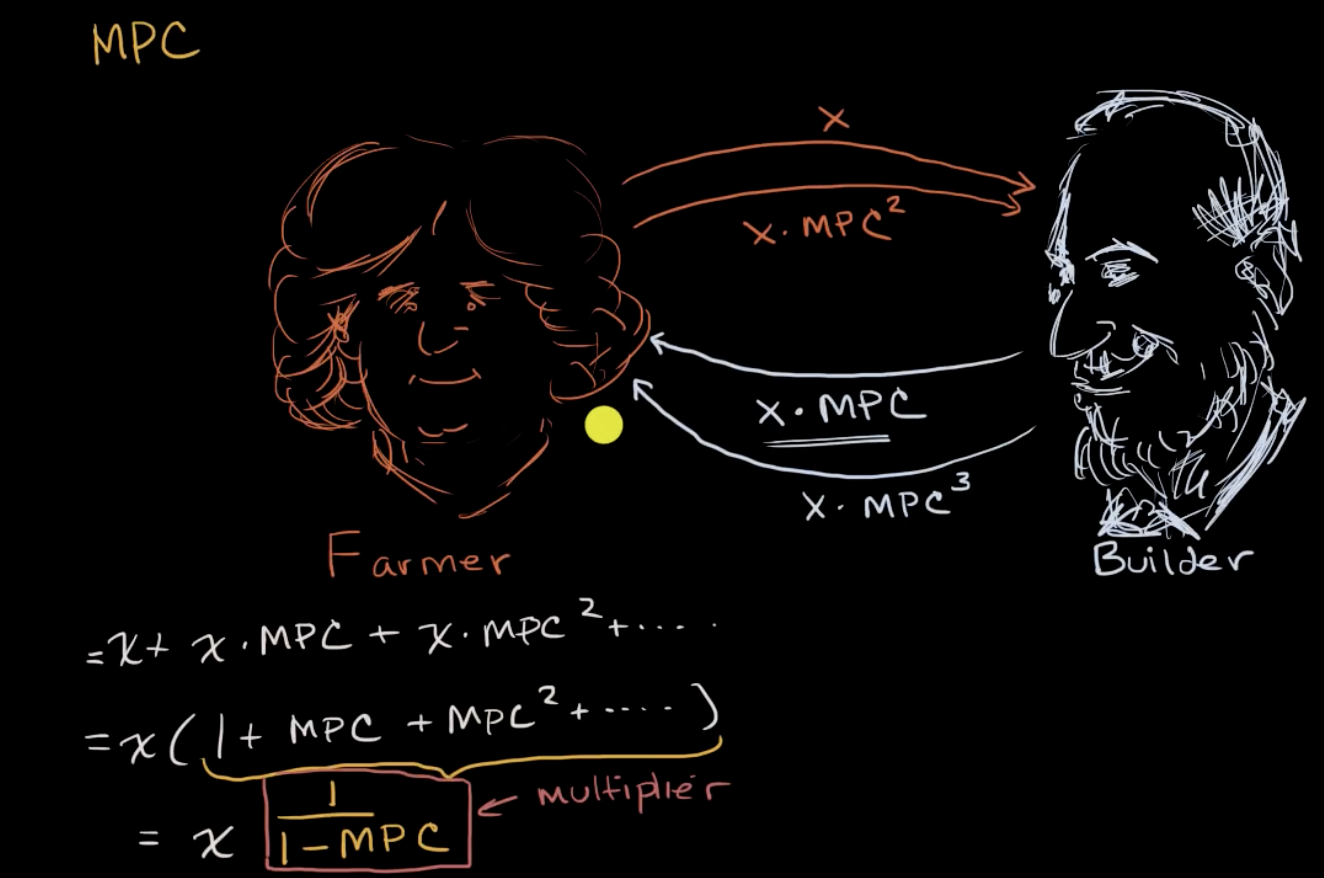
What is MPC
Marginal Propensity to Consume, the percentage of every dollar you choose to spend.
MPC Multiplier
Calculates the total amount of money that is added to an economy through its MPC
MPC Multiplier Formula
1 / 1 - MPC
Short-Run Aggregate Supply
The total output of goods and services an economy produces at different price levels in the short term