Week 1 - Principles of Ecology
1/91
Earn XP
Description and Tags
Intro to principles
Name | Mastery | Learn | Test | Matching | Spaced | Call with Kai |
|---|
No analytics yet
Send a link to your students to track their progress
92 Terms
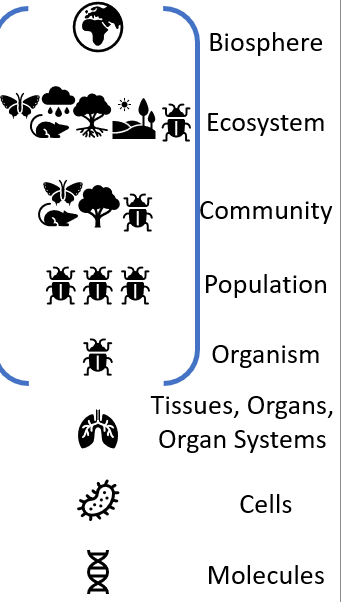
Biology is organized
Hierarchically based on complexity

Ecology largely covers
“Organism-and-up” biology (Hierarchy)
Ecology is the study of interactions between organisms and their?
Environments
Ecology is the study of the interactions that determine the
distribution and abundance of organisms
Individual
Response of individulas to environmet
Behavior and physiology
Populations
All individuals of a species in a given area
Abundance, change over time
Communities
Mixture of populations of different species
Processes determining structure, function
Who is present?
Ecosystems
Biotic community in conjunction with physical environment (abiotic)
Nutrient availability, food webs, energy flows
Methods: Observation
Life history
Behaviors
Patterns
Central to Darwin & Wallace’s theory of evolution by natural selection
Oldest techniques in ecology
Methods: Null Hypothesis Testing - TREATMENTS
Manipulated by experimenter
Ecology must avoid?
“Just-so” stories
Methods: Null Hypothesis Testing - CONTROLS
Unmanipulated
Or manipulated to be constant
Null hypothesis (H0):
Focal factors have no effect; no relationship exists
Alternative hypothesis (H1 or HA):
Focal factors do have some effect
Possibly specified in which direction
(Null Hypothesis Testing) This method does not:
PROVE hypotheses. We DISPROVE them
Methods: Multiple Hypothesis Testing — Often unable to perform experiments
Large systems, long timescales, etc.
Methods: Multiple Hypothesis Testing — Often many
Variables of interest
Methods: Multiple Hypothesis Testing — Compare real-world data to
Data predicted by different hypotheses
Ecological Modeling
All models are wrong, some models are useful!!
Conceptual models
Relationships between components
•Important for ANY research question
Methods: Ecological Modeling — Analytical models
•simple enough to solve the equations
(dN_1)/dt=r_1 N_1 ((K_1 -N_1-αN_2)/K_1 )
Methods: Ecological Modeling — Simulation models
Complex, require running multiple simulations and looking at range of outcomes
Methods: Ecological Modeling — Realism is a trade-off (REALISTIC)
More realistic models are complex, more system-specific
Require more field data to verify
Methods: Ecological Modeling — Realism is a trade-off (SIMPLER)
Simpler models may be more generalized
•But, may: miss important local context in some systems
Anthropocene
A geological epoch defined by human (anthropogenic) influence
Rapid acceleration of human impacts on environment
Starting from the 1800s industrial revolution (MID 20TH CENTURY)
Study of ecology cannot avoid?
Human impact
Quantitative thinking is?
Anything numerical (count or measure)
Quantitative thinking is important for ecologists:
All of the above
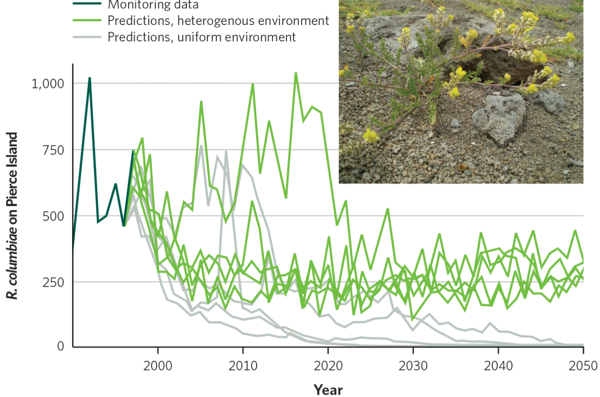
Building models EX: Signal Crayfish - what could be measured (quantitative thinking)
All of the above
Variables do what?
Change
Parameters are?
Fixed (or have specific range)
Parameters will not?
Change across iterations of the model
Parameters are represented how in a model?
Lowercase Greek or Roman (a,b,c,α, β, γ)
Variables will?
Change across iterations within a model
Variations are represented how?
Capital letters (X,Y,N, etc.)
Population size would be a?
Variable (N = abundance)
Average birth rate per individual would be a?
Parameter
Average death rate would be a?
Parameter
Measuring out change is?
A variable
Deterministic models
Always produce the same result if we begin with the same values
Same initial conditions, same outcome
Simulation approach
Run a model several different times with slightly different initial conditions representing possible real-world conditions
What do stochastic models do?
Explore range AND frequency of outcomes
What is a stochastic model (random)
The simulation approach
Deterministic model EX:
Average egg production is exactly 300/individual
Stochastic model EX:
Each run, vary average egg production from 200-400/individual
(Want a wider range)
Types of data: Categorical
Nominal and Ordinal
Types of data: Numerical
Continuous and Discrete
Nominal Categorical data has no?
Inherent numerical value
Nominal Categorical data common examples?
Qualitative data
Nominal Categorical data what to record?
Color
Behavior
Sex / mating type
Alive / Dead
Species / Taxon
Ordinal Categorical data is not?
Numerical, but does have an inherent order
Ordinal Categorical data common examples?
Age / life stage
Egg, juvenile, adult
Egg, larva, pupil, adult)
Size or count
Small, medium, large
None, few, many (counting)
You cannot average?
Ordinal variables (DON’T treat them like real numbers)
Continuous Numerical data can take any?
Value, including fractions and decimals
Continuous Numerical data examples?
All of the above
Discrete Numerical data (Integer data) only come in?
Whole numbers
Discrete Numerical data (Integer data) examples?
Age (measuring yrs)
Count data (can’t count 3.7 wolves)
What data type can be tricky?
Discrete Numerical data
Explanatory Variables
What we think is affecting, changing, or causing something about the response variable
What variable goes on the x-axis in figures?
Explanatory Variables
What variable goes on the y-axis in figures?
Response Variables
Response Variables
Usually the thing we are most interested in
Often trying to determine what drives change
What are the variables?
Response and Explanatory
Population (statistical definition)
The entire group of interest
Sample definition
What we measured
A good sample will be?
Unbiased
What are common sampling biases?
All of the above
When two variables (in data) are correlated, there are always?
Four possible explinations
What is variable A?
X causes Y
What is variable B?
Y causes X
What is variable C?
Z, affects both X and Y
What is variable D?
X and Y are completely unrelated
Small data samples produce?
Weird results
Mean definition
Sum the values and divide by the number of observations
Median definition
Order the values from smallest to greatest and find the middle
Mode definition
Find the value that occurs most often
Statistics and science are ultimately
Interpretative
The y-axis is always?
The frequency
Standard deviation
A measure of the average distance that points lie from the mean
What is a histogram?
Plot of frequency distribution
Distribution represents?
All possible values in the data and how often each value occurs
Scientific hypothesis
Proposed explanation for some observations
Statistical hypothesis
Tests the pattern we predicted / tests the prediction
We use statistics to?
Analyze patterns in data to then test the pattern’s likelihood of happening to be able to test the results of our scientific hypothesis
Null hypothesis
There is no pattern
Differences between groups are no greater than we would expect due to random variation
Alternative hypothesis
There is a pattern
What are the STATISTICAL hypothesis?
Alternative and Null hypothesis
P-value
The probability of observing a test statistic that is at least as extreme as your tests statistic, assuming the null hypothesis is true
Error rate is not an?
Error rate
Statistical significance is NOT equal to?
Biological significance
What affects a p-value?
All of the above