One Sample t Test
1/6
There's no tags or description
Looks like no tags are added yet.
Name | Mastery | Learn | Test | Matching | Spaced | Call with Kai |
|---|
No analytics yet
Send a link to your students to track their progress
7 Terms
Z Properties
X̄ is expected to approximate μ (X̄ ≈ μ)
σ_X̄ provides a measures of how well a sample means approximated a population mean
Can compute z-Score statistic to compare X̄ and μ
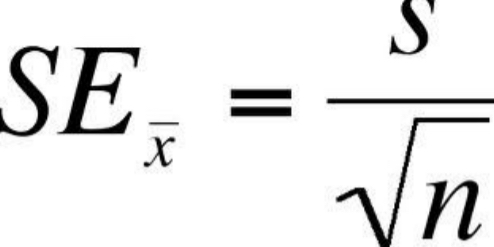
Estimated Standard Error (SE_X̄)
Standard Error → Estimated Standard Error
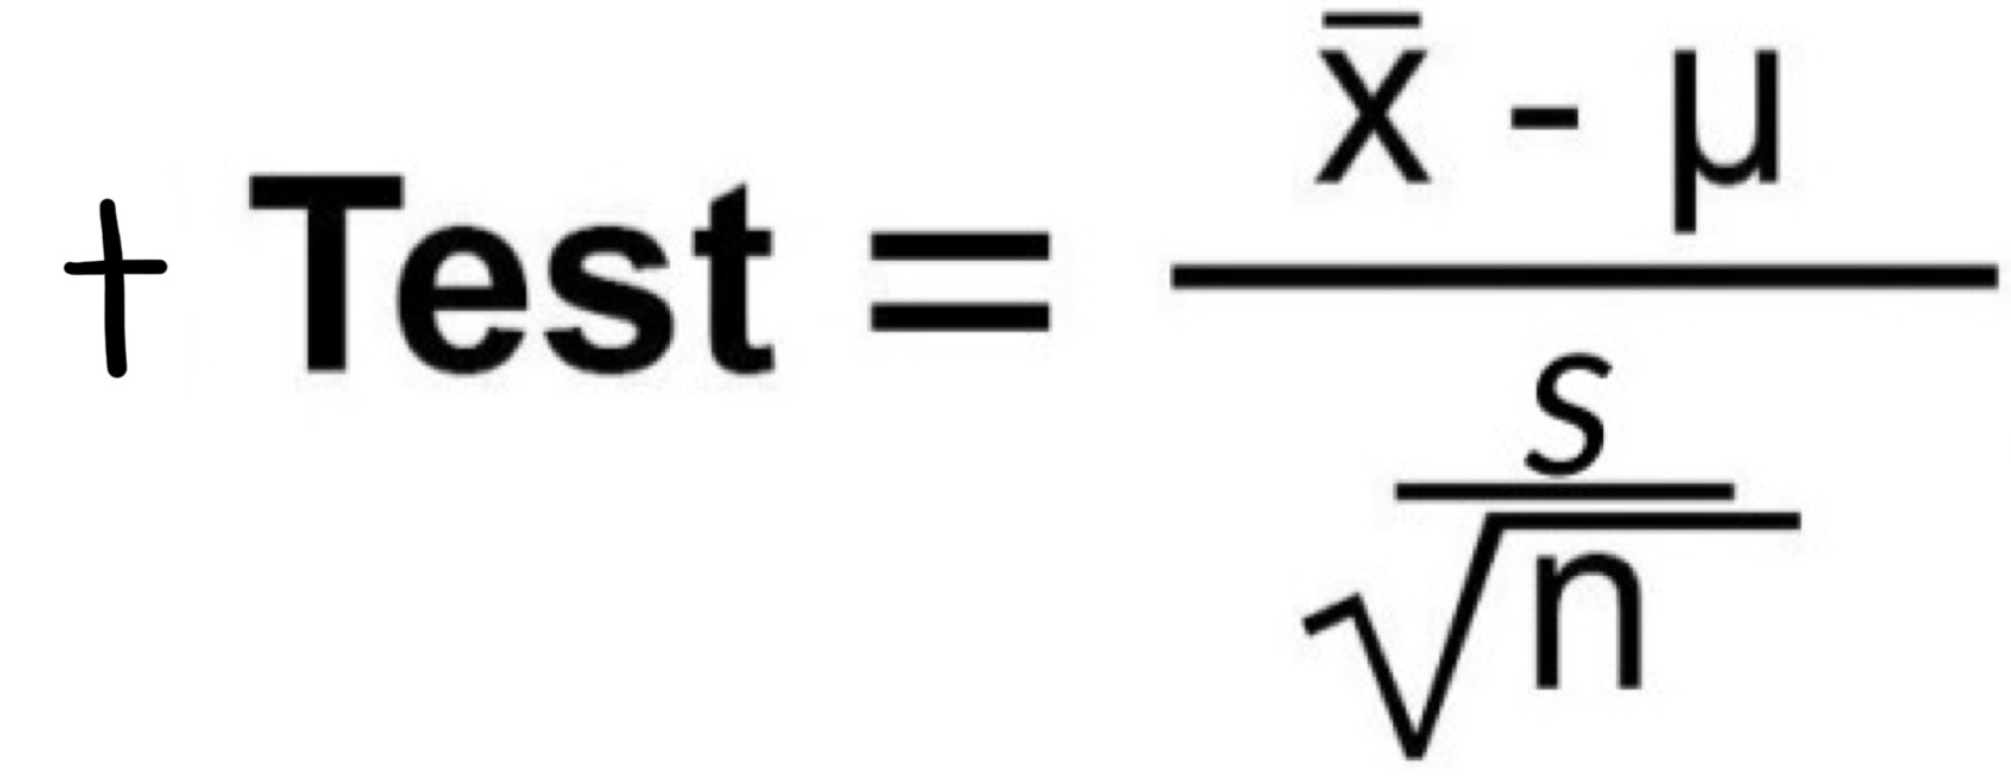
Don’t know σ → Turn every σ into s → Z-Test to t-Test
Replace σ with s in our Z-Test formula. This will form our t-Test Formula
z-Score → t
T is larger than z (because we don’t know σ)
t-test
test difference between a single group and a known population parameter
- μ known → compare to X̄ → is it significantly different?
test difference between two groups on quantitative variable (measure or count)
- compare men and women on personality traits
test differences between two collections of scores from a single group
- compare pre-test scores to post-test scores
FORMULA: t = X̄ -μ / s/√n
Setting up t-test
One variable = Quantitative (numbers)
- measure with interval or ratio scale (e.g., test scores, height)
- dependent variables (what you measure)
Other variable = Qualitative (categories)
- measure with nominal or ordinal scale (e.g., gender, major)
- independent variables (the grouping)
GOAL: Comparing number scores (quantitative) between category groups (qualitative)
Research Question
example of one) Do children engage in patient behaviors when offered a reward?
Sample information
Hypothesis
Critical Region
Calculate SD → SE_X̄ → t-Statistics
APA Style
always relate results back to research question
reject null or fail to reject the null
describe any variables with descriptive statistics in study
make into statistical sentence
example)
Since t = 2.5, and the p-value ≤ .05, we reject the null hypothesis. We conclude that, on average, there is a significant difference between an child who is asked to wait with no reward, and a child who is asked to wait to receive a reward. Specifically, the those who were promised a marshmallow waited longer to eat the marshmallow (M = 12.5, SD = 3) than children who were promised nothing (μ = 10), t(9) = 2.5, p ≤ .05
hey just a note:
t(9) is the df (degrees of freedom)… so μ = 10, so you have 9 digits that are free of choice before the 10th digit is forced to contain mean
μ = 10 … M = 12.5 → your sample mean is 2.5 away from your population mean → showing t = 2.5, which is pretty significant, showing to reject H_0, so p ≤ .05 matches up