psychology 2910 - lecture 11 (inferential statistics and z-test)
1/22
There's no tags or description
Looks like no tags are added yet.
Name | Mastery | Learn | Test | Matching | Spaced | Call with Kai |
|---|
No study sessions yet.
23 Terms
Inferential Statistics
Making appropriate conclusions about populations based on samples drawn from the population
- Cannot test population; too expensive and time-consuming
- Want to generalize to future populations
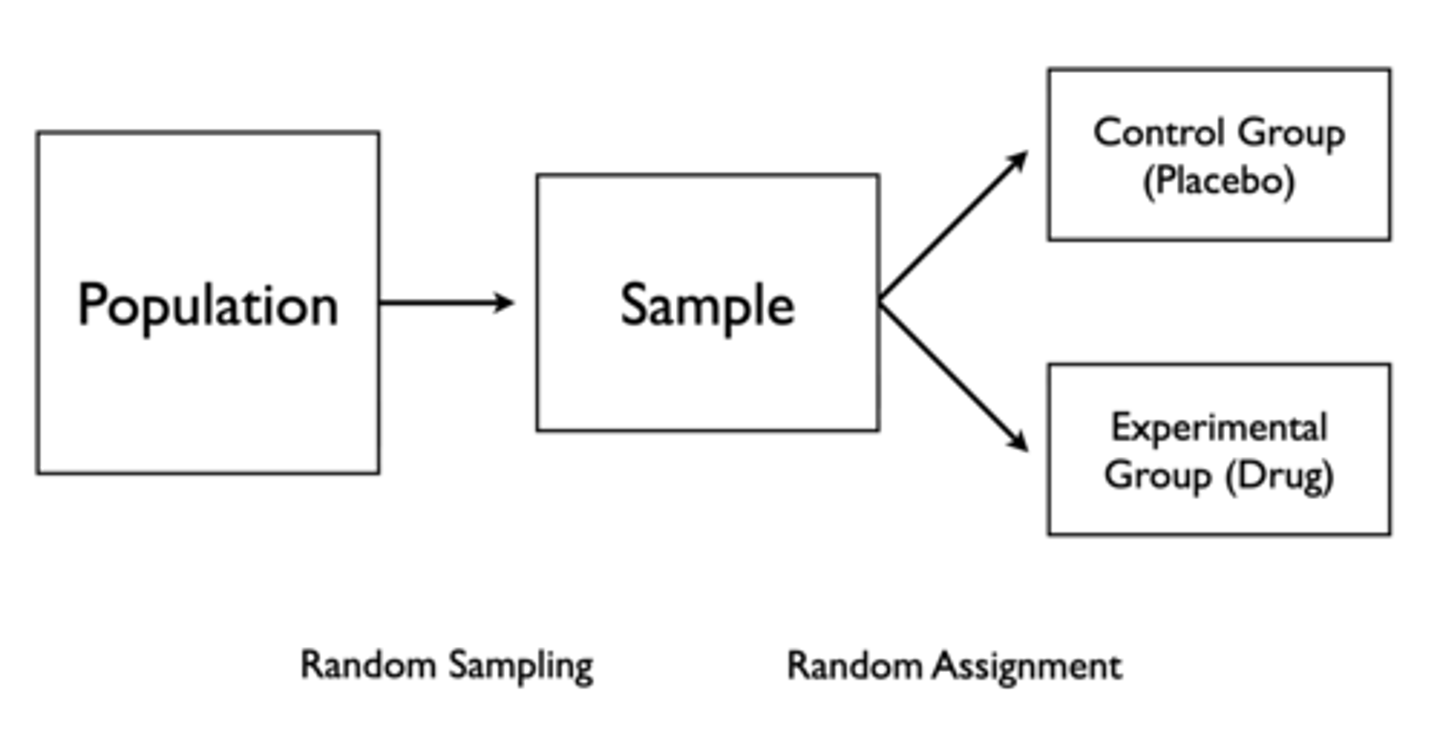
How can we perform a controlled experiment?
1. Take a random sample from the population
2. Randomly assign people to control group (placebo) and experimental group (drug)
In a controlled experiment with a control group (placebo) and an experimental group (drug), what will happen if the drug is effective? Ineffective?
- If drug is effective, mean scores on dependent variable for experimental group will differ from dependent variable for control group
- If drug is not effective, mean scores on dependent variable will be similar for experimental and control group:
- Due to random factors, measurement error, chance, it is unlikely that the control and experimental group will have exactly the same score on dependent variable
Hypothesis
A testable prediction about specific events
What is an example of a research hypothesis?
Administering Drug A will change systolic (maximum) blood pressure compared to administering a placebo
Null Hypothesis (H0)
There is no relationship between the independent variable (IV) and dependent variable (DV)
- There is no relationship between Drug A and blood pressure
Why do we use null hypotheses?
Assume the absence of something
- Easy to disprove negative assumptions (e.g. there are no black sheep; one instance disproves)
- Can be impossible to disprove positive assumptions (e.g. there are green sheep)
How can it be impossible to disprove positive null hypotheses?
- H0: all sheep are white
- I found a white sheep
- Therefore, H0 is correct
- Problem of induction: you haven't proven the null hypothesis; you've just found some evidence consistent with the null hypothesis
How are negative null hypotheses easier to disprove?
- H0: no sheep are black
- I found a black sheep
- Therefore, H0 is disproven
How is it easier to statistically model what a negative null hypothesis would look like compared to a positive null hypothesis?
We know what the world of no black sheep would look like, but we don't know exactly what the world of some black sheep looks like (i.e. if there are some black sheep, how many black sheep are there?)
How would we test a null hypothesis that there is no relationship between Drug A and blood pressure?
1. Conduct appropriate study, measure dependent variable, compare means:
- Experimental: 130
- Placebo: 140
2. Does 130 differ from 140?
If we have 10,000 ping pong balls, each has a z-score written on it reflecting the z-distribution (mean of scores is 0 and standard deviation is 1).
What is the probability of drawing a ball within the range of ± 1.00? ± 2.00? ± 3.00?
± 1.00: 6,826 have a number between ± 1, so 68.26%
± 2.00: 9,544 have a number between ± 2, so 95.44%
± 3.00: 9,974 have a number between ± 3, so 99.74%
If we have 10,000 ping pong balls, each has a z-score written on it reflecting the z-distribution (mean of scores is 0 and standard deviation is 1).
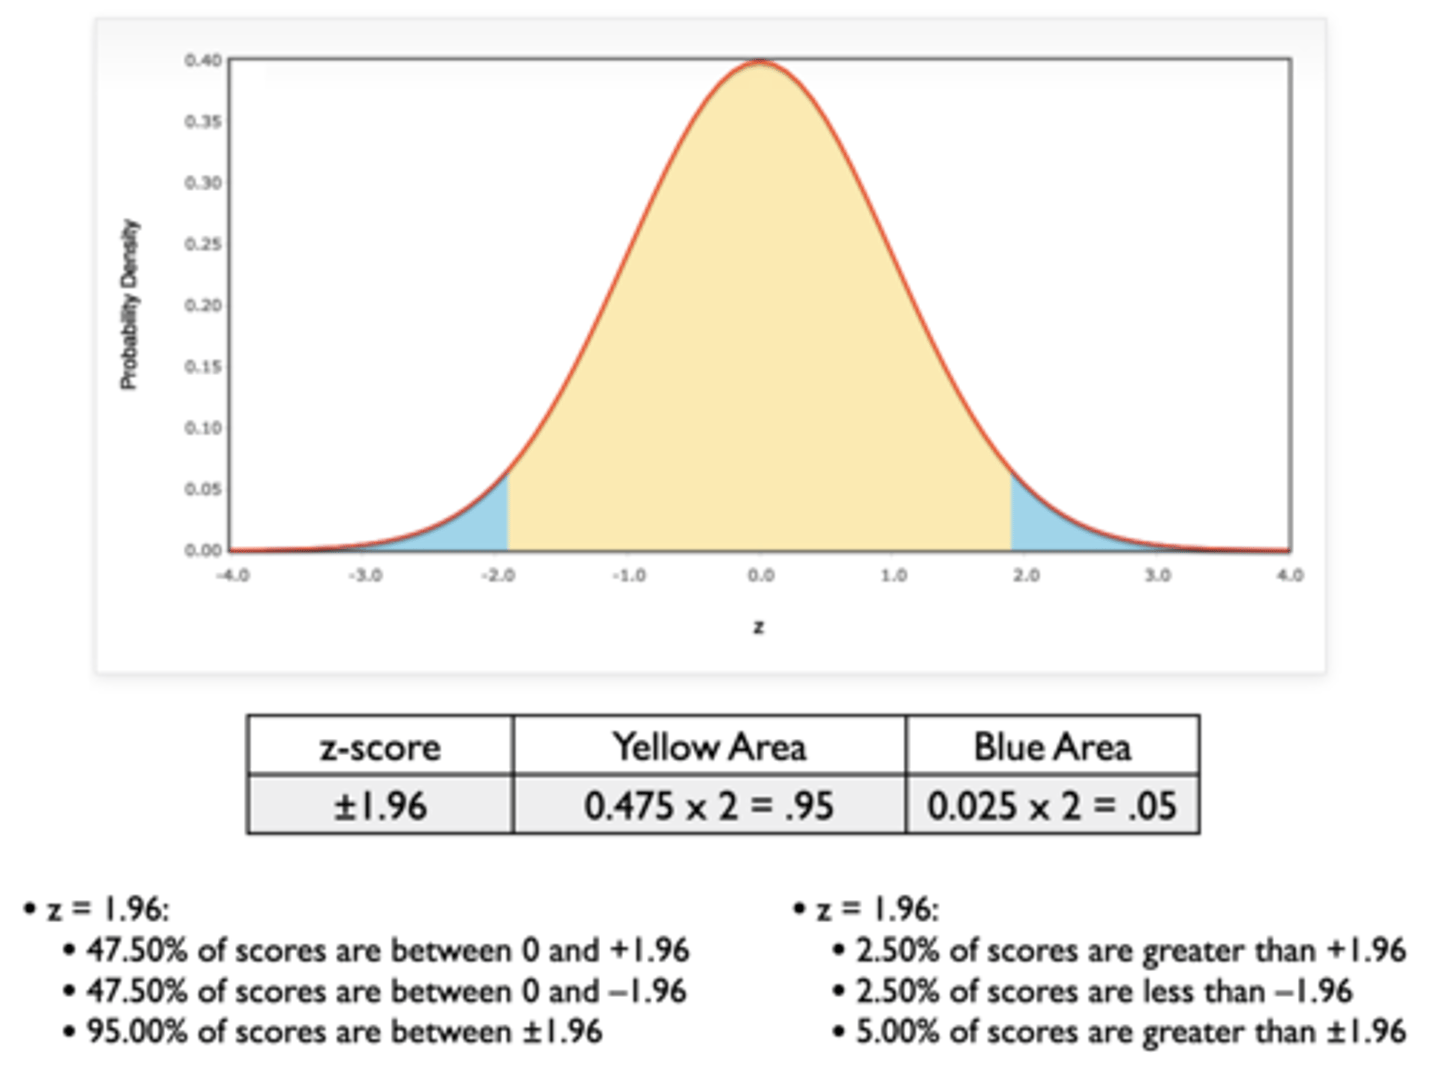
What is the probability of drawing a ball within the range of ± 1.96? Outside the range?
Probability of drawing ball with number between -1.96 and +1.96?
- 9,500 have a number between ± 1.96, so 95.00% or p = 0.95
Probability of drawing ball with number outside the range?
- 250 have a number greater than +1.96 and 250 have a number less than -1.96, so 5.00% or p = 0.05
- Unlikely to happen by chance (i.e. we reject the null)
How can we test if hypothesis results (experimental mean of 130 and control/placebo mean of 140) are different?
- H0: Drug A will not change systolic blood pressure
- Ha: Drug A will change systolic blood pressure (nondirectional)
Does 130 differ from 140?
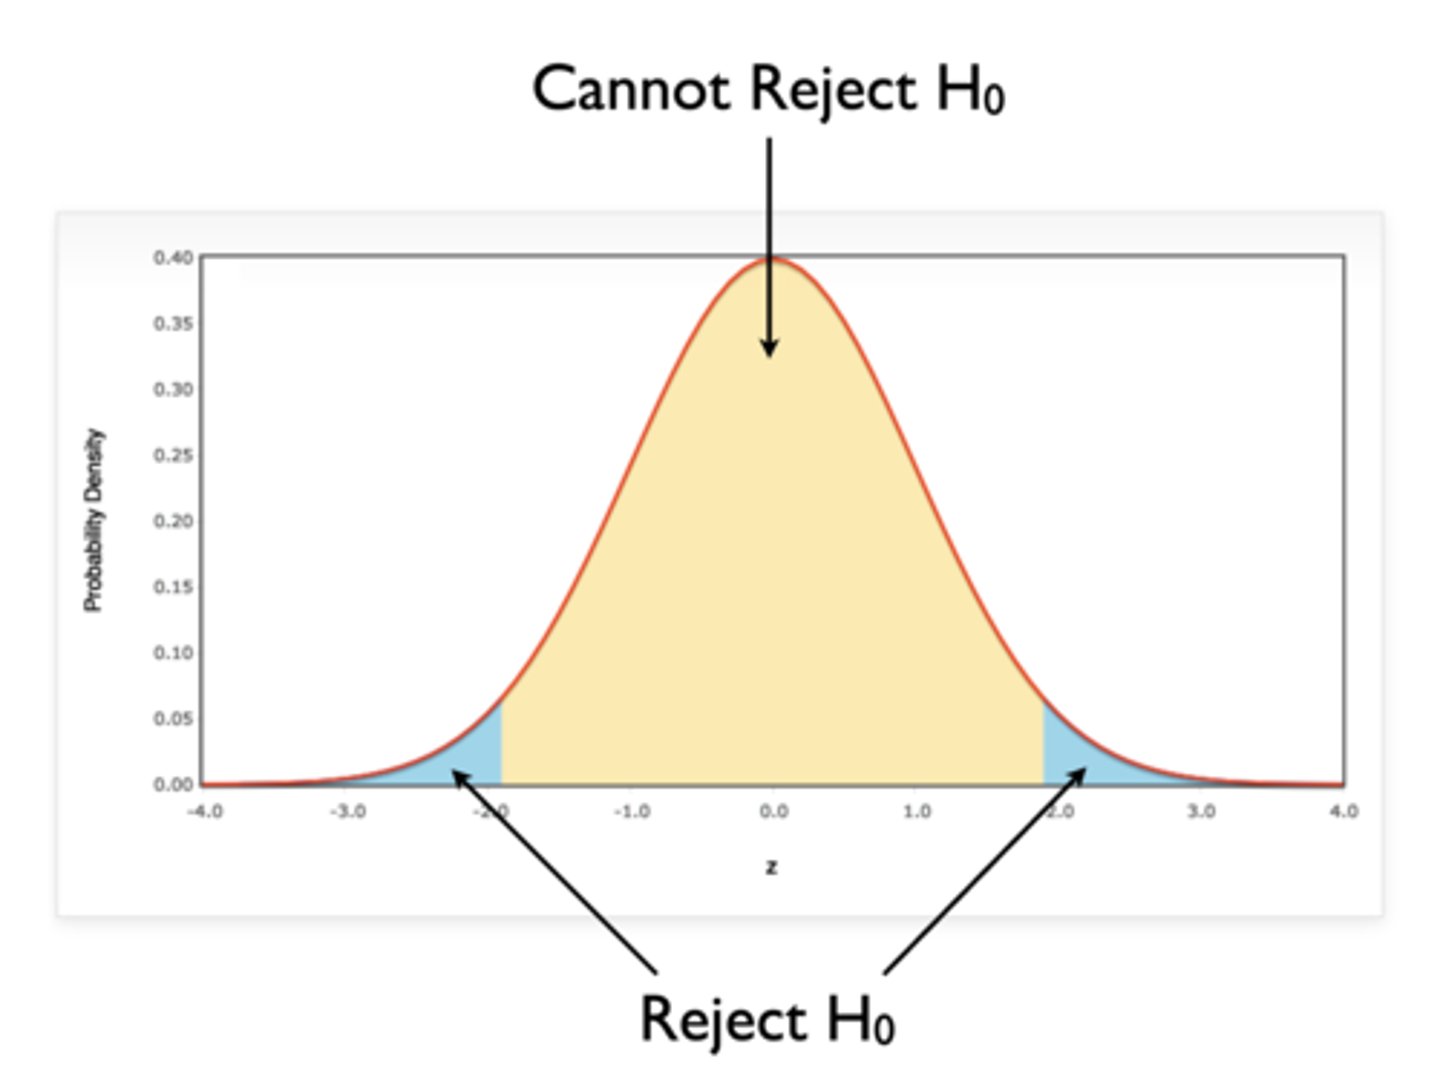
- Essentially convert difference to a z-score
- If -1.96 < z-score < +1.96, cannot reject null
- If z-score < -1.96 or > +1.96, reject null
Why should we always say that we "cannot reject" the null hypothesis instead of saying we "retain" the null hypothesis?
- If z = ± 2.50, reject null
- If z = + 1.25, conclusion could be:
- Retain null (suggests you are supporting this conclusion)
- Cannot reject null (more conservative conclusion; many reasons for null results other than null is true, like sample being too small to present effect)
- Therefore, it's recommended to never say "retain"
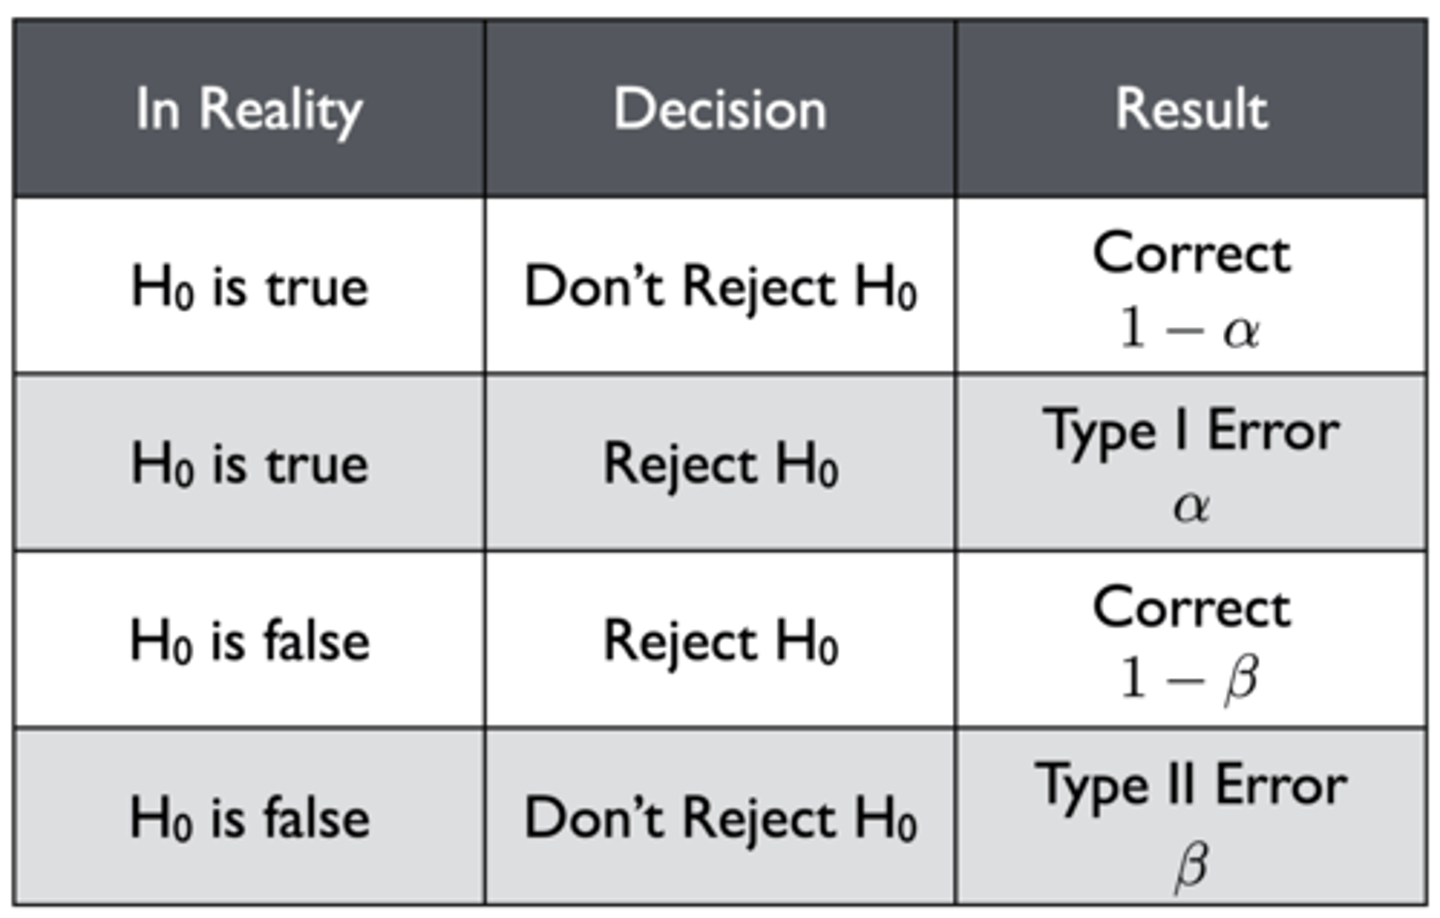
What are the four outcomes of accepting/rejecting the null hypothesis?
1. Null is true and isn't rejected: correct (1 - α)
2. Null is true and is rejected: Type I error (α)
3. Null is false and is rejected: correct (1 - β)
4. Null is false and isn't rejected: Type II error (β)
Note: α = 0.05
Why is the first outcome of accepting/rejecting the null hypothesis worded as 1 - α?
p(Correct Answer) + p(Type I Error) = 1
p(Correct Answer) = 1 - p(Type I Error)
p(Type I Error) is represented by α = 0.05
- There is a 5% risk of wrongly rejecting a true hypothesis
- There is a 95% chance of correctly failing to reject a null hypothesis
What is the statistical significance of α = 0.05 (probability of a Type I error)?
- Why 0.05 and not 0.01 or 0.06? Not really important (i.e. largely arbitrary convention)
- Important point: when designing a study, set α before looking at data (cannot adjust α afterwards because it's cheating)
Z-Test
Making inferences about whether a group mean is different from a population mean
How can we construct a null hypothesis and a nondirectional/two-tailed hypothesis to test if ultimate frisbee players score differently on the GRE than other GRE test-takers?
H0: the mean of frisbee players is the same as the mean of non-frisbee players (or mean = 500)
Ha: the mean of frisbee players is different than the mean of non-frisbee players (or mean ≠ 500)
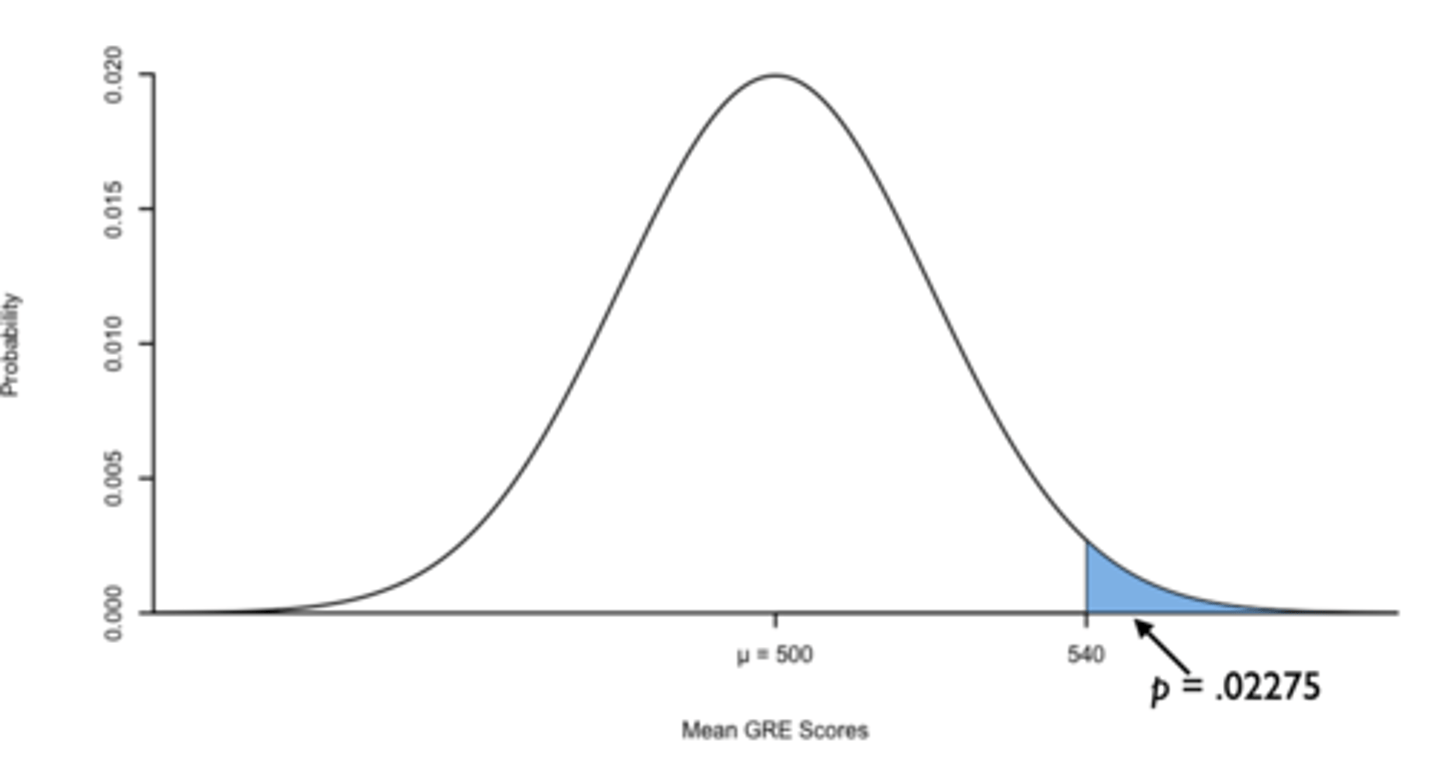
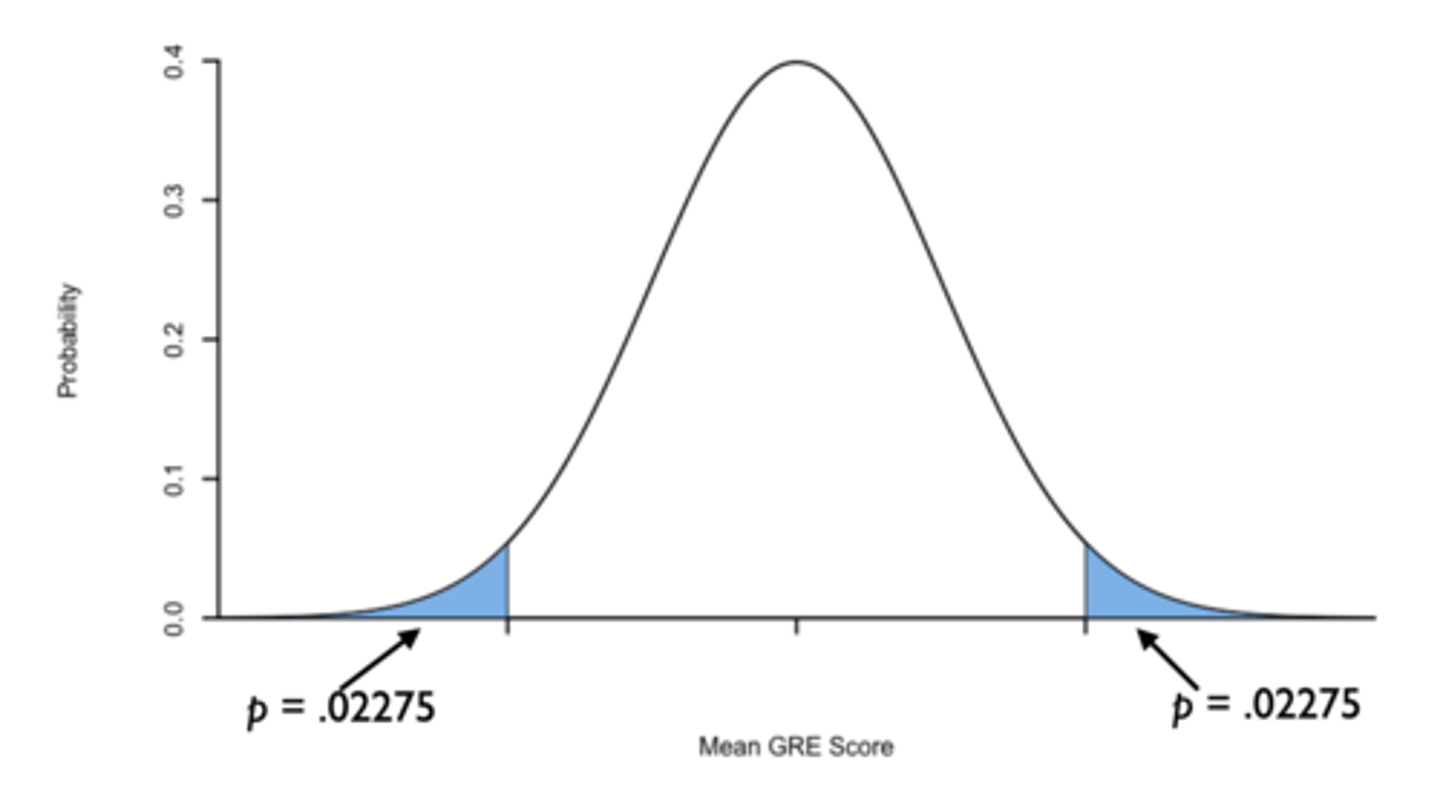
The population of scores from the GRE forms a normal distribution with a mean of 500 and a standard deviation of 100. We take a random sample of n = 25 ultimate frisbee players who took the GRE. The mean of this group was M = 540.
Do ultimate frisbee players score differently on the GRE than other GRE test-takers?
Standard Error: 100 / √25 = 20
z-score: 540 - 500 / 20 = 2
Probability of z > 2: 1 - 0.97725 = 0.02275
Probability of z < 2 = 0.02275
Therefore, the probability of z being less than or greater than 2: (0.02275)(2) = 0.0455
α = 0.05 and p < 0.05. Therefore, ultimate frisbee players who took the GRE had higher GRE scores than the population of GRE test-takers (reject null)
How can we construct a directional/one-tailed hypothesis to test if ultimate frisbee players score differently on the GRE than other GRE test-takers?
H0: the mean of frisbee players is less than or equal to the mean of non-frisbee players
Ha: the mean of frisbee players is greater than the mean of non-frisbee players
- We have to do this before we see our data
- Usually easier to specify Ha first and then make H0 everything that Ha is not
How do the statistics of a one-tailed hypothesis differ from a two-tailed hypothesis?
Because this is a directional test, or a one-tailed hypothesis, we already know p = 0.02275
p < 0.05. Ultimate frisbee players had higher GRE scores (M = 540) than the population of GRE test-takers (reject null)