Imaging QA Unit 1 test
1/67
There's no tags or description
Looks like no tags are added yet.
Name | Mastery | Learn | Test | Matching | Spaced |
|---|
No study sessions yet.
68 Terms
Pixel (in Digital Imaging)
§Picture Element
§A square cell within a matrix
§1 grey shade per box
§Each grey shade represents the intensity of the electrical signal that the radiation created(the darkest shade of grey got the most radiation)
Matrix
§Grid of pixels / table
§Set of rows and columns
§Each pixel can be designated by its column and row number
An increase in matrix size does what to pixel size?
decreases pixel size (smaller)
How does that effect spatial resolution?
The smaller the pixel, the larger the matrix
The better the spatial resolution… more details displayed;
The sharper the image
If the image has a matrix of 512 x 512, how many pixels are there? (multiply the two)
Find the area 512 x 512 = 262, 144 pixels are displayed
Dexel
•Detector Element
•Small boxes that collect electrical charge located IN your Image Receptor
•If your pixel size matches your dexel size it would represent the exact shade of grey (Post-processing changes this)
•Dexel size ultimately determines the sharpness of the image
•What’s a Del Pitch?
Distance between the center of 2 dexels
Wires and such in between them increase it
Voxel
•Volume Elements
•Make a “cube” -- determines its volume in 1 pixel when displayed
•Includes thickness of the “slice”
•Volume averaging – misrepresented pixel value due to too thick of slice
•Diagnostic Imaging – the whole thickness of your patient; think superimposition
Pixel size = FOV / Matrix
§Use just 1 dimension of each
§1 cassette measurement and 1 row of the matrix
§IR that is 14” x 17” turn to cm to match matrix measurements in SI units (mm)
üfor conversion: there are 2.54 cm in 1 inch
§14” = 35 cm
§17” = 43 cm
§Use collimated field # when the whole IR isn’t being used
What is the size of the pixel displayed in the Nuclear Medicine image if the FOV is 105cm x 104cm and the matrix is 64 x 64?
PS = 105 cm / 64 = 1.64 cm (16.4 mm)
Compare that to a pixel size in DR at 0.29 mm!
Field of View (FOV):
§Is determined in a number of ways
§Physical size of the display monitor
§Physical size of the entire IR
§Size of the collimated field
§Size of a post-processed zoom or magnification feature
§Effects spatial resolution
§The inherent spatial resolution of hardware arrays is unaffected by changes in FOV, IR size, collimation, or “zoom”, because the physical size of any hardware pixel or dexel is not subject to change
§ The spatial resolution of a light image from a display monitor or PSP plate is affected by FOV and matrix size.
Pixel pitch
§aka Dot Pitch
§Distance (usually in mm) from the center of one pixel to the center of its adjacent pixel
§How does it effect spatial resolution?
The lower the pixel pitch (smaller the number) the better the spatial resolution
Shades assigned:
§Each pixel is assigned a number to represent the shade of grey for that system
§Its intensity or density per box/pixel
§Some systems use high numbers for BLACK and low numbers for WHITE, but they can be vice versa
§It can get confusing when they aren’t consistent!
AMA – Active Matrix Array
§A constructed matrix in a system (IR) that populates the area of activity for it
§Could also be the active part of your monitor screen
§In a digital IR, the flat panel display consists of millions of individual dexels
§The address of each dexel to be represented in each pixel is thanks to the AMA
How do we select what part of the IR is active?
our collimated field only
Spatial Resolution Review
Better spatial resolution if:
§LARGE matrix
§SMALL pixels (or dexels, or voxels)
§Pixel (Dot or Dexel) pitch is low (small number/less mm)
§FOV on a screen – decrease in FOV, improves spatial resolution
§An increase in FOV results in a larger pixel per the formula
§Tighter collimation (smaller FOVs) greater better spatial resolution
§Careful with DR captured images… Collimated area on a DR cassette
§Doesn’t change the dexel size – we are talking about pixel size on the computer screen
histogram
•Graph that stacks exposure values determined by all the pixel shades in your displayed image
•Indicating the number of pixels counted for each value (gray level)
•
•X-axis – Exposure Values
•Each shade of gray from bright white to pitch black stacked to compare their frequency
•Y-axis – Frequency of that shade
•How often does the shade of gray appear
Histogram Analysis
•Processing an image according to the procedural algorithm chosen by the technologist
•These protocols are automatically engaged when the anatomical procedure is selected at the console
•VOI – Values of Interest = main lobe consideration
•The created histogram is compared with a stored histogram model in the Procedural Algorithm for that anatomic part; VOIs are identified, and the image is displayed = Characteristic Histogram
•Neural Histogram
•An evolving histogram (uses its brain!)
•Some manufacturers update the ideal histogram by averaging data from the previous 50 procedures performed for the specific anatomy
•So, using a histogram on the wrong anatomy, would damage its integrity
•Utilizing a bunch of bad technique choices can hurt this histogram process
•Consistently over or under-exposing a particular anatomy
•Would be bad for our lab (experiments)
•Priori Histogram (first)
•that is never changed from the original setting
Constructing the Histogram:
•Based on a simple scale of brightness/intensity (or density), usually from white to black as read left to right
•The main lobe = tissues within the anatomy
•The area of importance
•VOIs
•The tail lobe = “raw” back- ground density of the exposure image
•A black spike
•Left or right side, depending on the histogram’s setup
The point Smax must be identified
•Background densities (right of SMAX ) must be eliminated from averaging calculations used for the exposure indicator and for rescaling, so the image brightness can be displayed correctly
•Yet, the black shades after s-max are still displayed on the image
Histogram Type 1 Analysis
•Algorithm for a histogram designed with the expectation that there will be a direct exposure area
•Some raw data exposure; like in extremities
•
Note:
üS-min
üS-Ave
üS-max
S-min
between the main lobe and the whites
S-Ave
in the middle of the main lobe
S-max
between main lobe and tail lobe
Histogram Type 2 Analysis
•An algorithm for histogram analysis which does NOT search for an SMAX point must be used
•for an Image with no suspected background density
•Like an abdomen that covers the whole FOV
Histogram Type 3 Analysis
•Both raw background densities and large barium areas that are nearly blank must be eliminated from averaging calculations for the exposure indicator
•Positive contrast agents present
•Lead shielding
•Prosthesis
•S-min must also be identified and eliminated from the brightness scale for display
•Use main lobe only for calculations for brightness
Exposure Indicators
•How is your EI # (S#) assigned?
•Can it Change?
•The exposure indicator is not an actual exposure reading taken at the image receptor, but is extrapolated (calculated) by the computer from reading the midway point (between SMIN and SMAX) on the same image histogram generated for processing
•You can change this by reprocessing your image
•Masking out the gonadal shielding, keys in pockets, reassigning an inappropriate mask
Rescaling
•A post-processing function that changes raw data into a favorable image
•Adjusts your actual histogram per image to the desired/stored/expected histogram to display
Rescaling Errors
•Was your technique wrong / Are there exposure errors?
•This image is underexposed…
•Bottom image is corrected with a characteristic histogram/rescaling process
•Are there artifacts?
•Prosthesis
•Unexpected Barium
•Lead Shielding in the image
ONE of the BIG reasons gonadal shielding was eliminated
Exposure Field Recognition {EFR} – a CR Histogram issue:
•EFR is used to find where the edges of the FOV are
•Border recognition issues
•Ghost images included from Off-focus radiation
•Partitioned Pattern Recognition (PPR) or “Segmentation” [CR only]
•Scans across the receptor plate row by row, to determine the number and orientation of views taken
•Software recognizes each collimated border of an exposed field by the sudden dramatic change in density
•Accumulation of too much background and scatter radiation between fields may cause software to mistake them as anatomy within a field
•Multiple fields are then treated as one large field, averaging all densities between different exposures
•Result: Each exposure is processed to improper level
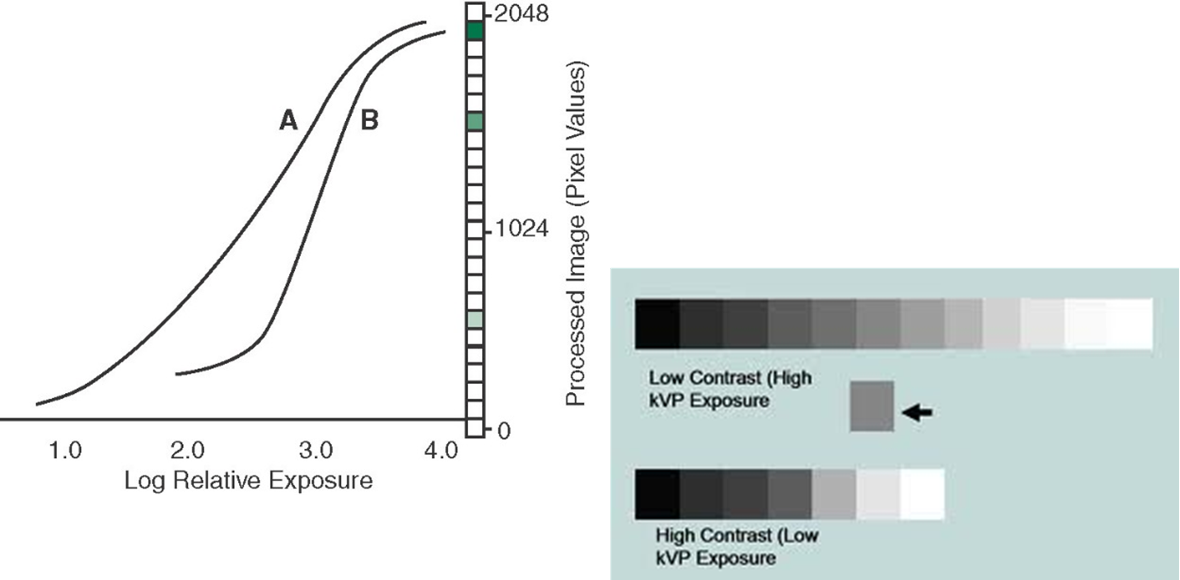
Look Up Tables
{LUTs}
•A post-processing function that reassigns pixels values by looking at a table to determine the new value
•Adds the desired brightness and contrast
•Lookup tables provide the means to alter the original pixel values to improve the brightness and contrast of the image
•Can also change contrast
•Example of changing the contrast of an image
•Low contrast or High contrast is determined by the number (value) the LUT puts in the pixel
Steep S Curve = High Contrast
Shallow S Curve = Low Contrast
• When the “body” portion of the gray-scale curve is shallow, A, long gray scale; low contrast is indicated
•When it is steep, B, short gray scale; high contrast image is indicated
Histogram Errors/User Errors:
•Do NOT process images under the wrong Procedural Algorithm
•Even a different projection in the same anatomy
•The rescaling and LUT processes will not work properly
If your future job has anatomy/projections you consistently change algorithms for, have a supervisor adjust the “Key Op” functions!
Correct your masking error and REPROCESS image –
üIs there too much raw IR exposure (you didn’t collimate enough)? (Keep all anatomy exposed)
üIs there clipped anatomy the histogram is expecting (you collimated too tight)?
üAre the borders displayed correctly, the computer is looking for 2 or 4 borders using Exposure Field Recognition (EFR)?
ØMaybe your exposure (too light or too dark); too much scatter; too much noise) this challenged the processing to find the collimated edge
Use the Correct
üHistogram
üCollimation
üCentering
Histogram Analysis Errors
•Can occur from several causes:
•From segmentation or exposure field recognition errors
•When the type of histogram analysis applied is mismatched to the actual histogram acquired
•When the acquired histogram attains a bizarre, unexpected shape
•Multiple exposure errors combine
•Very extreme exposure conditions exist
Error from Unexpected Histogram Shape
•Example: Pelvis with shielding and a total hip replacement:
•A lead apron/gonadal shield and a large radiopaque prosthesis may result in two “spikes” at the left /white side of the data
•The computer may locate SMIN between these two spikes, too far to the left, and then include that data from the prosthesis in the VOI with SAVE too far left
•Result would be too light of an image
?
•Segmentation Rescaling Error
•Too many borders to track!
•Borders are not equal
•
•Various histogram analysis and rescaling errors can result in an image that is too light, too dark, with excessive contrast or with excessive gray scale
üThese errors can be unrelated to the original radiographic technique used
üEvaluate the issue, don’t re-exposure your patient
histogram
frequency of recorded exposure values
histogram analysis
identifies the values of interest
rescaling
histogram to expected values
lookup table
used to correct brightness and contrast
correct histogram processing
correct body part+correct collimation=
dynamic range
•The range of exposures that can be captured by the detector
•Range of exposures you can actually detect and quantify (measure)
•The number of gray shades with which each pixel can be represented by the system
How many shades of gray can each pixel change to!
Thousands
•The series of exposure values that will result in a radiographic image
narrow dynamic range equals a smaller window of optimal exposures
(Film screen had a narrow Dynamic Range)
DONT NEED TO KNOW ALL DEFINition
gray scale
The range of pixel values actually present in a displayed image at 1 moment
•Human eye can see only 32 at one time
mottle
is dynamic rage is too low
Noisy
Grainy
Underpenetrated
Quantum Mottle
Undiagnostic
saturation
--if dynamic range it too high
Anatomy appears burnt out
--8 x 10 times the required dose WOW
Gray scale destroyed as the tail lobe would be extreme
Exposure Index {EI#}:
•The indicator is a vendor-specific value that provides the radiographer with an indication of the accuracy of their exposure settings for a specific image (ASRT, 2010).
•EI-number, S-number, REG, IgM, ExI, etc…
•Each digital image system provides an Exposure Index (EI), a target EI, and the deviations from that target EI
•A marker for exposure quality
•Each examination has a target EI
In some systems: values under that EI are considered underexposed, values above are overexposed
Deviation Index
quantifies the difference between the actual EI and the Target EI
•This feedback allows the radiographer to track and adjust his or her exposures.
•DOES NOT mean the image needs to be repeated
--a next time adjustment is noted
Dose creep
•aka Exposure Creep
•DON’T BE A CREEPER
Check your EI # after EVERY projection – adjust manual techniques - adjust stored techniques
•the gradual acceptance over time by radiographers of the use of higher radiographic exposures, and hence doses to the patient, for the same X-ray examination and projection in digital planar radiography
•
•Follow ALARA always, Use AEC when warranted, Look at the EI#, etc…
Exposure Latitude
•The range of exposures that produce quality images at an appropriate patient dose
•quality images at different techniques
Technologists can use many different techniques to achieve a similar quality image
For example, increasing kVp by 15% instead of doubling mAs
•different systems accept different latitudes -- some are pickier than others
less dose is used on the portabl- it is direct current
in the room the current needs to be rectified
Attenuation Coefficient
üRatio or percentage of original x-ray beam intensity absorbed by a particular tissue area in the patient
ü
üHigh Coefficient # = Whiter image result
ü
üLow Coefficient # = Darker the pixel
JUST LIKE Attenuation we have already learned – coefficient just means it is digital now
Windowing
•Adjusting the brightness and/or contrast of the image displayed at the monitor screen with controls at the console as the image is viewed
•The overall or average brightness of the image/average density or overall darkness of the image
•Can also adjust the contrast/gray scale of the image
WINDOW LEVEL
-- CONTROLS BRIGHTNESS LEVELS
DECREASE IN # =
A BRIGHTER IMAGE
INCREASE IN # =
A DARKER IMAGE
Window Width
controls displayed gray scale
Decrease in # is a shorter gray scale {More blacks and white}
Increase in # is a longer gray scale {More grays}
--increasing window width lengthens gray scale
Dynamic Range Compression (DRC
aka “Tissue Equalization” or “Contrast Equalization”
With conventional radiography,
when soft tissue techniques were
used to demonstrate soft tissue areas,
the bones were then depicted too
light
Now we can window to display it all
By compressing the gray scale curve, DRC brings extremelylight densities up to a darker level, and extremely dark areas are made lighte
Dynamic Range Compression extra
Mathematically, DRC finds the mid-point of the gray scale curve, then progressively reduces pixel values above this point, and progressively increases pixel values below it
Applied to a degree visibly affecting the image, this results in tissue equalization, a cutting off of the darkest and lightest densities
Dynamic Range Compression OR Gray scale Truncation
A clipping off of the extreme ends of the gray scale
Does not increase contrast, but reduces Pitch blacks and bright whites
As Dr. Smyser used to tell me… see through the whites
truncation= shortening something by removing part of it
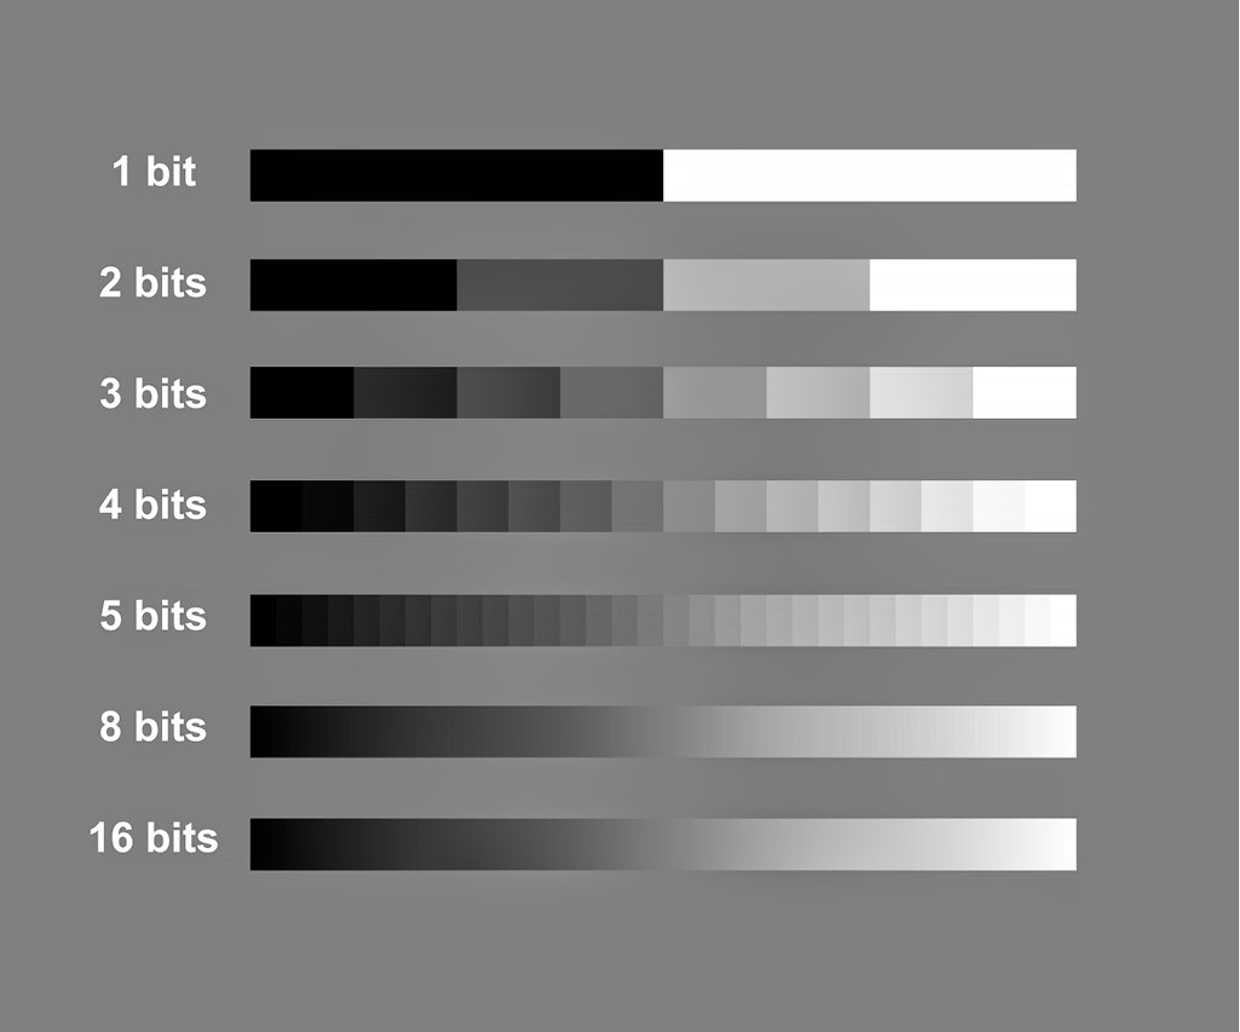
Bit Depth
•Any # of brightness levels that can be assigned to any given pixel in the digital image (stored)
•The maximum shades of gray a system store for you to use per pixel
•More information can be "Seen" esp compared to film screen
•Large bit depth -- LOTS of brightness levels -- lengthens contrast resolution
Calculating Bit Depth:
•Bit depth refers to the color information stored in an image. The higher the bit depth of an image, the more colors it can store. The simplest image, a 1 bit image, can only show two colors, black and white. That is because the 1 bit can only store one of two values, 0 (white) and 1 (black).
•21 = 2 shades of gray
•
•Bit Depth Calculations 2 to the power of the bit
•3 bit system is 23 so, 2 x 2 x 2= 8 shades of gray can be displayed per pixel
Quantization
•Conversion from electrical signal to digital display
•Analog to Digital Converter takes electronic signals and changes them to brightness levels displayed in pixel values
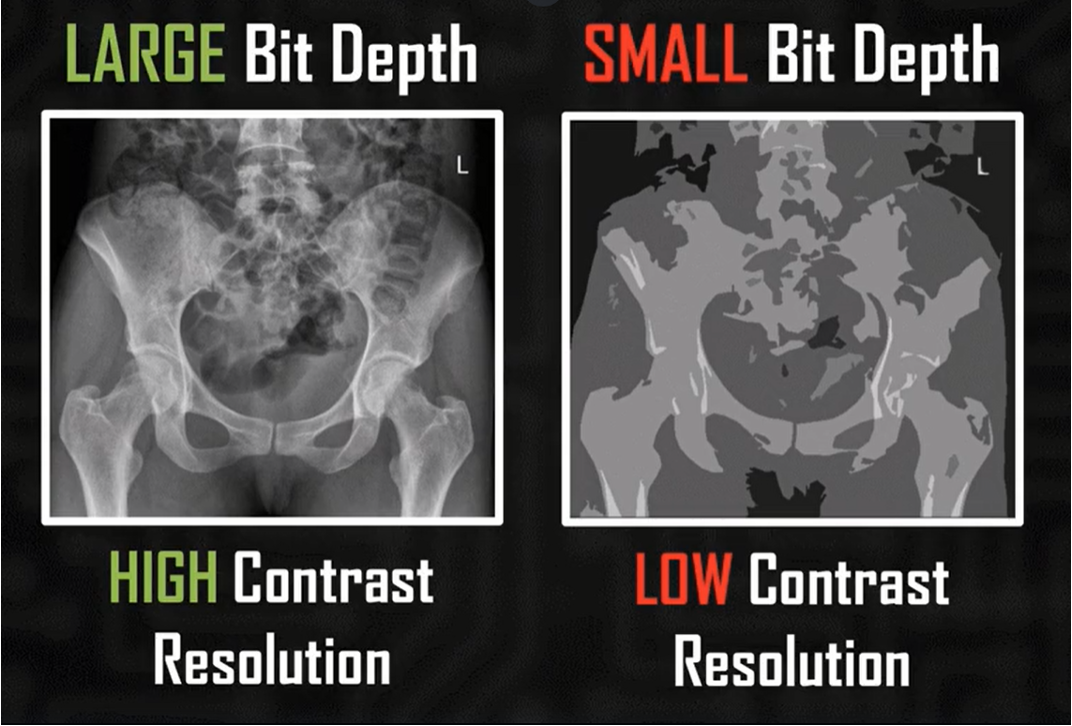
contrast resolution
•improves with Larger bit depths and brightness levels
•Large bit depth =
high contrast resolution
•Small bit depth =
low contrast resolution
