PSY2750 Quiz 1
1/47
There's no tags or description
Looks like no tags are added yet.
Name | Mastery | Learn | Test | Matching | Spaced | Call with Kai |
|---|
No analytics yet
Send a link to your students to track their progress
48 Terms
Summation notation (∑)
Total sum of values
∑X² vs (∑X)²
Because squaring is applied before summation in ∑X²
Nominal scale measurement
Blood type (A, B, O)
Scale of measurement with true zero
Ratio
Experimental vs non-experimental study
Experimental studies manipulate variables; non-experimental studies do not
Population parameter notation
μ (population mean)
Purpose of a frequency distribution
To organize data into categories with corresponding frequencies
Formula for the sum of frequencies
N = ∑fX
Graphical representation for continuous data
Histogram
Cumulative frequency
A running total of frequencies up to a certain point
Measure of central tendency affected by extreme values
Mean
Best measure of central tendency for ordinal data
Median
Variability in a data distribution
The differences between scores and how spread out they are
Formula for the range in a dataset
Xmax - Xmin
Standard deviation measures
How scores are distributed around the mean
Difference between variance and standard deviation
Variance is the square of the standard deviation
What a z-score represents
The distance of a score from the mean in standard deviation units
z-score for X = 90 with mean 80 and SD 5
2.0
True about z-scores
The shape of the z-score distribution is the same as the original distribution
Meaning of a z-score of -2.00
The score is 2 standard deviations below the mean
σ
population standard deviation
s
sample standard deviation
∑
summation (sum of all numbers)
N
population (total number)
n-1
sample (total number)
SS
sum of squares
formula:
- find deviations (X - μ)
- square
- sum them up
ex. Data: 2, 4, 6
1. Mean: μ= 2 + 4 + 6 / 3 = 4
2. Find each deviation from the mean: (2−4),(4−4),(6−4) = −2, 0, 2
3. Square each deviation: (−2)^2, (0)^2, (2)^2 = 4, 0, 4
4. Sum the squared deviations: 4+0+4=8
So, SS = 8
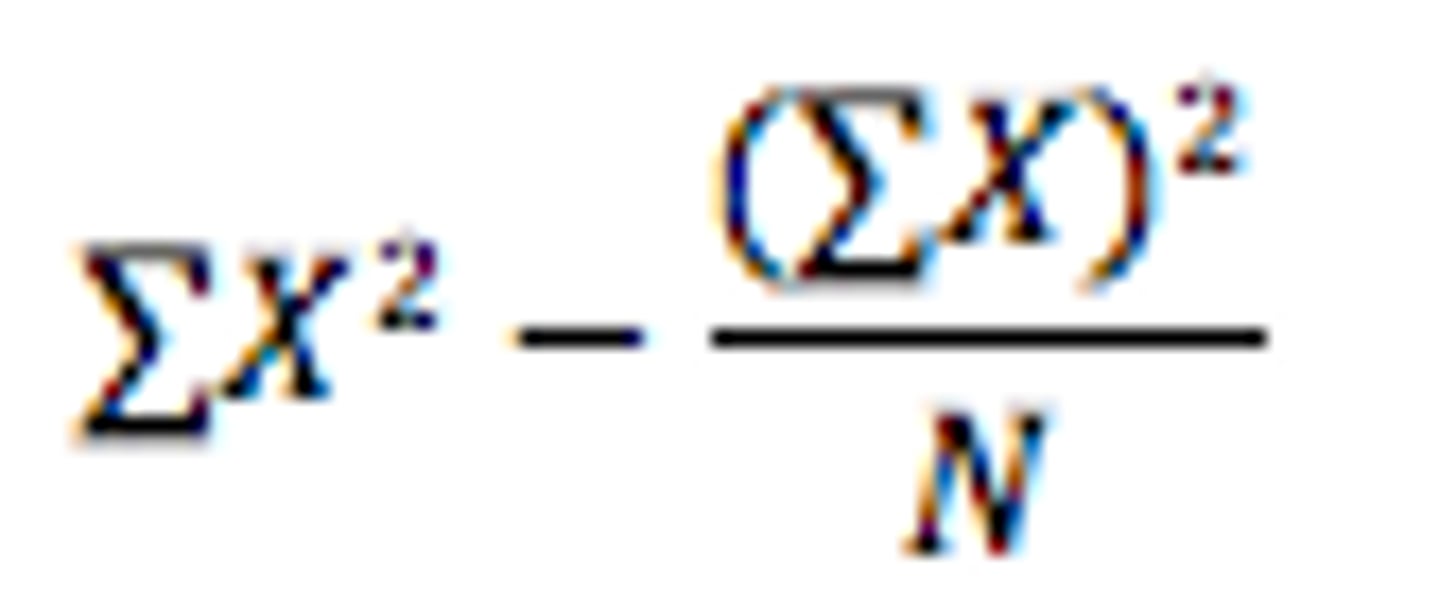
SS formula
SS=∑X^2−(∑X)^2/N
ex. ∑X = 1 + 3 + 5 = 9
∑X² = 1² + 3² + 5² = 1 + 9 + 25 = 35
SS = 35 - 27 = 8
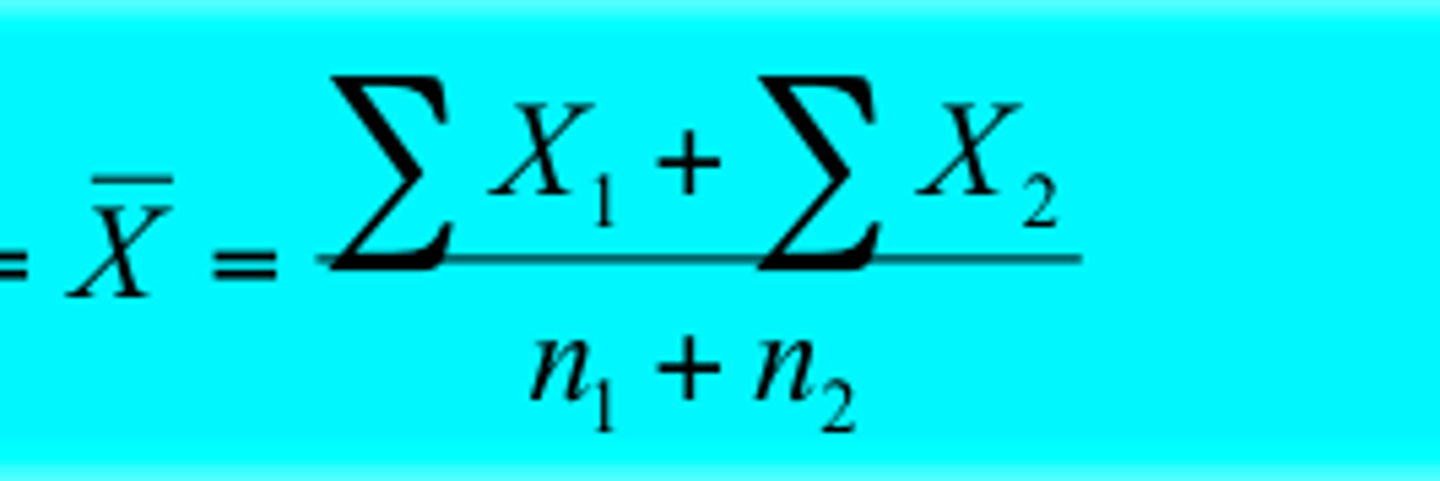
weighted mean
- accounts for the contribution of different sample sizes
- calculates the overall mean by summing the values from different groups and dividing by the total number of observations
σ²
population variance
s²
sample variance
variance
squared measure of spread
standard deviation
- measures the average distance of data points from the mean
- square root of variance
Z-score
- represented by 'z'
- measures how many standard deviations a data point is from the mean
- positive Z-score = value is above the mean
- negative Z-score = value below the mean
ex. Z-score of 2 means the value is 2 standard deviations above the mean.
μ
mean of population
Z-score formula
z = (X- μ)/σ
z=(x-mean)/standard deviation
M
mean of sample
descriptive statistics
summarizing data from one group with one or more variables
correlational methods
examining the relationship between two variables in one group
comparative methods
comparing two or more groups across one or more variables
experimental methods
manipulating variables to establish cause-and-effect relationships between them
non-experimental methods
observing relationship between variables without manipulation
frequency distribution
a way to organize and summarize data by grouping it into categories or intervals and showing how often each category or interval occurs
frequencies
number of times a value or range of values appears in the dataset
class interval
a range of values used to group data in a frequency distribution
histogram
used for continuous data
smooth curve
used for large datasets
bar graph
used for categorical data
cumulative frequency
add each frequency to the sum of previous frequencies