Quiz Chapter 16 - Lineaire regressie MOD 8
1/34
There's no tags or description
Looks like no tags are added yet.
Name | Mastery | Learn | Test | Matching | Spaced |
|---|
No study sessions yet.
35 Terms
Toetsvraag 2021-2022 - R
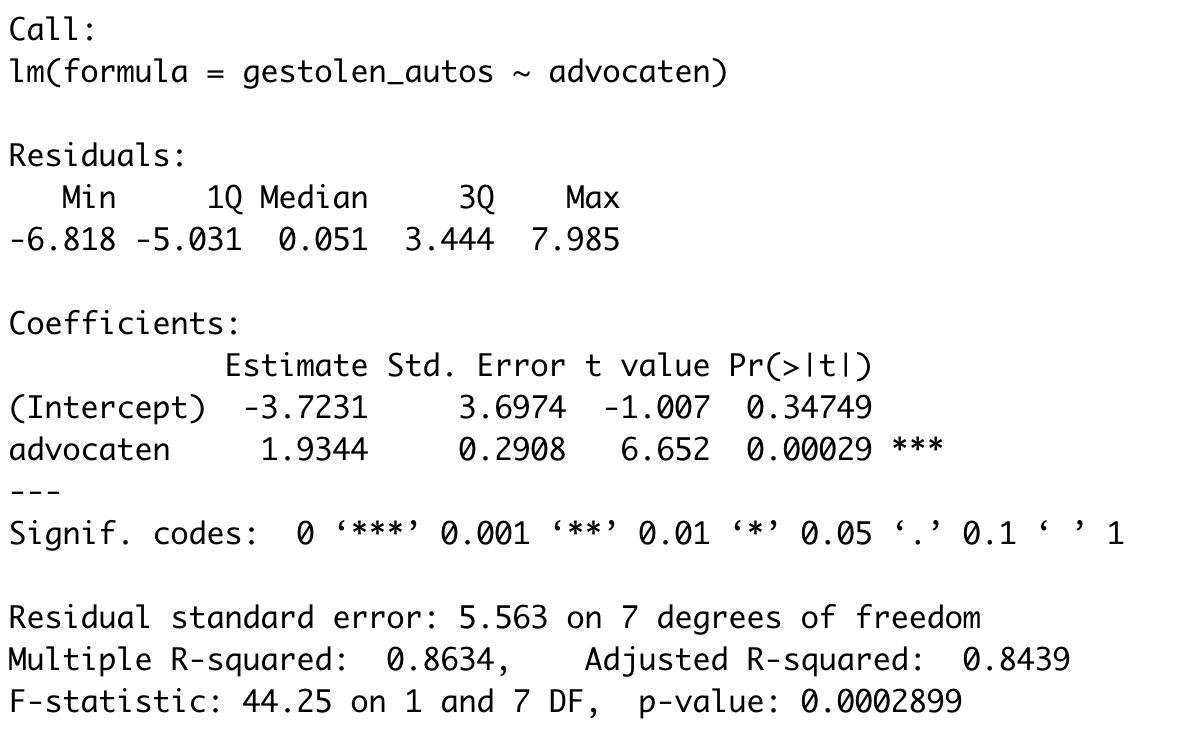
Hieronder staat de output van R voor het overzicht (Engels: summary) van een lineair model. De gegevens waarop dit is gebaseerd, zijn het aantal advocaten en het aantal gestolen auto's in een bepaalde week voor 9 steden in het VK. Wat is de vergelijking voor de regressielijn?
voorspelde aantal gestolen auto's = -3.7231 + 1.9344 * aantal advocaten

Toetsvraag 2021-2022 - Oefeningen
Een bioloog denkt dat er een lineair verband is tussen de hoeveelheid kunstmest die een tomatenplant krijgt, en de daaropvolgende opbrengst van tomaten. Hij selecteert willekeurig acht tomatenplanten en behandelt deze wekelijks met een oplossing van x gram kunstmest in een vaste hoeveelheid water. De opbrengst, y in kilogram tomaten, wordt neergeschreven. De correlatiecoëfficiënt r is 0.9444.
Gebaseerd op onderstaande info, met hoeveel kilogram stijgt de geschatte opbrengst per extra gram kunstmest in de oplossing? Tip: de berekening kan eenvoudig uitgevoerd worden zonder de waarden van de individuele observaties te gebruiken.
Per extra gram kunstmest stijgt de verwachte opbrengst tomaten met 1.0810 kilogram
A sales manager claims that there is a relationship between college GPA and sales performance (number of units sold) among salespeople hired within the last year. Use the regression results shown below and set α = .05 to test his claim.
Predictor Coef SE Coef T P
Constant -0.484 3.256 -0.15 0.884
GPA 7.423 1.044 7.11 0.000
reject the null hypothesis and conclude that there is a significant relationship between GPA and sales performance
As the carbon content in steel increases, its ductility tends to decrease. A researcher at a steel company measures carbon content and ductility for a sample of 15 types of steel. Use the following regression results to find the 95% confidence interval for the slope of the regression equation.
Predictor Coef SE Coef T P
Constant 7.671 1.507 5.09 0.000
Carbon Content -3.296 1.097 -3.01 0.010
-5.666 to -0.926
Toetsvraag 2021-2022 - Oefeningen
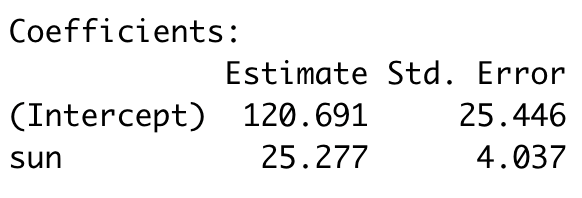
Gedurende 9 random dagen in augustus wordt het aantal uren zonneschijn gemeten. Een ijsverkoper noteert het aantal verkochte ijsjes op deze dagen. Wanneer we een lineair model opvragen van de data, geeft R onderstaande output. Wat is de P-waarde horend bij de richtingscoëfficiënt die de vraag beantwoordt of er een significant lineair verband bestaat tussen het aantal uren zonneschijn en het aantal verkochte ijsjes? Tip: test tweezijdig!
De P-waarde is 0.0004 en dus kunnen we op significantieniveau 0.05 zeggen dat er een lineair verband is tussen het aantal uren zonneschijn en het aantal verkochte ijsjes
Which of the following does NOT affect the standard error of the regression slope?
Spread around the line: se
All of these affect the standard error.
Spread of x values: sx
Critical value: t*
Sample size: n
Critical value: t*
Toetsvraag 2021-2022 - Oefeningen
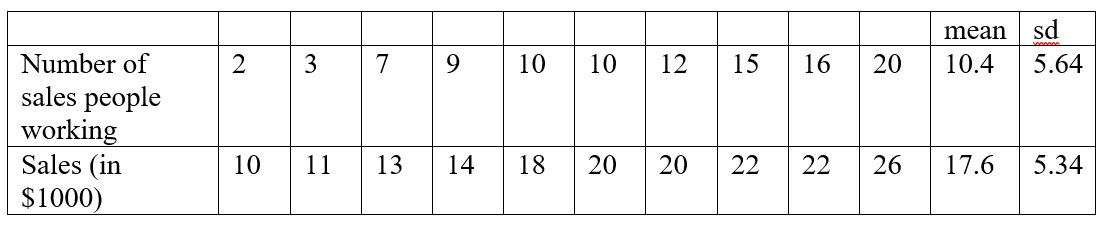
Een boekhandel wil beoordelen of het hebben van meer verkopers per dag hun omzet zal verhogen. Ervan uitgaande dat aan de aannames en condities voor lineaire regressie is voldaan, wordt een lineaire regressie uitgevoerd op een steekproef (zie tabel) en is de richtingscoëfficiënt van de regressielijn 0.913 en het intercept 8.101. De standaarddeviatie van de residuen se is 1.477 en de standaardfout van de richtingscoëfficiënt is 0.0873.
Geef het 95%-betrouwbaarheidsinterval voor de werkelijke gemiddelde toename van de omzet voor iedere extra persoon die op die dag werkt.
0.712 ; 1.114
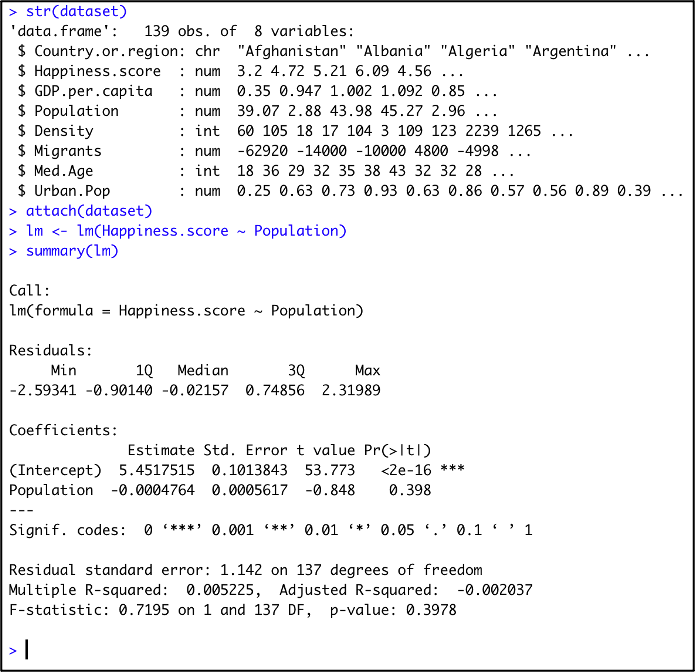
The World Happiness Report is a landmark survey of the state of global happiness. The report calculates a happiness score for each country in the world based on answers to main life evaluation question from nationally representative samples.
A researcher is using these happiness scores to determine which variables are able to explain the state of happiness of a country. Therefore, she has built the following linear model in R
Given the linear model that this researcher has fit, which of the following statements is false?
We can reject the null hypothesis that there is no linear association between the state of happiness of a country and its population on a significance of 5%.
Vraag 9
Cars from an online service were examined to see how fuel efficiency (highway mpg) relates to cost (in dollars). According to the regression equation, a used car that costs $13,000 is predicted to get about 30.24 miles per gallon. According to the data, the car got 35 miles per gallon. What is the value of the residual for this car?
+4.76
A researcher is interested in developing a model that can be used to distribute assistance to low income families for food costs. She used data from a national social survey to predict weekly amount spent on food using household income (in $1000). The resulting regression equation is
How much money would be needed to feed a family for a week whose household income is $12,000?
$110.57
Toetsvraag 2021-2022 - Theorie
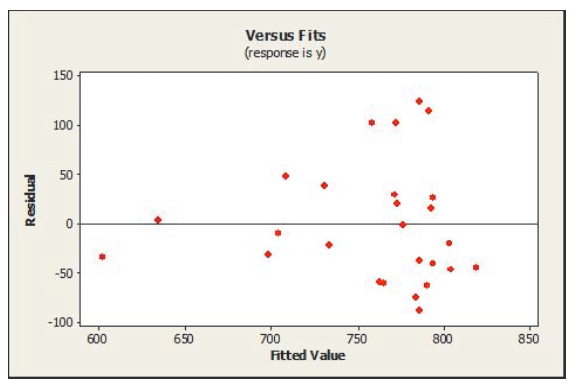
Onderstaande figuur toont de residuen versus de voorspelde waarden van een lineaire regressie uitgevoerd voor 2 kwantitatieve variabelen. Welke conclusie omtrent de condities bij lineaire regressie kunnen we duidelijk trekken uit de plot?
Gelijke spreiding conditie is niet voldaan
A sales manager was interested in determining if there is a relationship between college GPA and sales performance (number of units sold) among salespeople hired within the last year. From the regression results shown below, identify the residual standard deviation.
Predictor Coef SE Coef T P
Constant -0.484 3.256 -0.15 0.884
GPA 7.423 1.044 7.11 0.000
S = 1.57429 R-Sq = 78.3% R-Sq(adj) = 76.8%
1.574
just fout
Het is belangrijk om de aannames in de juiste volgorde na te gaan: 1) Lineariteit 2) Onafhankelijkheid errors 3) Gelijke variantie rond de regressierechte 4) Normale verdeling errors per x-waarde
juist
juist fout
Om de aanname van Normale verdeling van de errors per x-waarde na te gaan moet je in de praktijk via een histogram nagaan of de x-variabele en y-variabele in de steekproef Normaal verdeeld zijn.
fout
juist fout
Wanneer aan de aanname van lineariteit voldaan is, dan is de aanname van gelijke variantie rond de regressierechte ook steeds voldaan.
fout
juist fout 4
Om correcte inferentie te kunnen doen, is het voldoende indien aan de aanname van Normale verdeling van de errors per x-waarde is voldaan.
fout
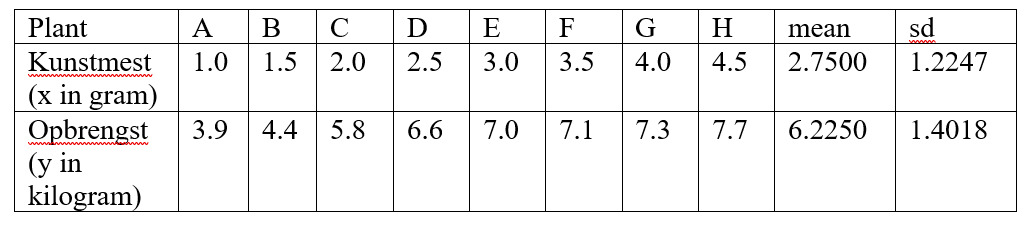
Een bioloog denkt dat er een lineair verband is tussen de hoeveelheid kunstmest die een tomatenplant krijgt, en de daaropvolgende opbrengst van tomaten. Hij selecteert willekeurig acht tomatenplanten en behandelt deze wekelijks met een oplossing van x gram kunstmest in een vaste hoeveelheid water. De opbrengst, y in kilogram tomaten, wordt neergeschreven. De correlatiecoëfficiënt r is 0.9444.
Gebaseerd op onderstaande info, welk percentage van de variabiliteit in de opbrengst wordt verklaard door de hoeveelheid kunstmest? Tip: de berekening kan eenvoudig uitgevoerd worden zonder de waarden van de individuele observaties te gebruiken.
89.19%

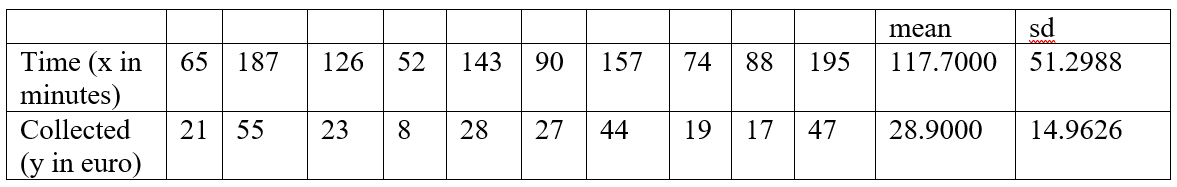
Nasser organiseert een straatinzameling voor een liefdadigheidsinstelling voor geestelijke gezondheidszorg. De inzameling vindt plaats in een grote stad op een bepaalde zaterdag. Vrijwilligers staan met verzamelblikken op drukke plekken en vragen voorbijgangers om donaties. De onderstaande tabel toont voor 10 vrijwilligers de tijden, x minuten, die ze hebben besteed aan het inzamelen, samen met de bedragen, y euro, die ze hebben ingezameld. Op basis van deze data stelt R een lineair model op. De output is de volgende:
Geef een 95% betrouwbaarheidsinterval voor het voorspelde gemiddelde ingezamelde bedrag van vrijwilligers die 137 minuten besteden aan het verzamelen van donaties.
(2de fabeelding bij de antwoord nodig voor de oef)
29.2121 ; 38.9503
According to the plot of residuals versus fitted values below, which of the following is true?
linearity condition is not satisfied.
quantitative variables condition is not satisfied.
nearly normal condition is not satisfied.
equal spread condition is not satisfied.
equal spread condition is satisfied.
equal spread condition is not satisfied.
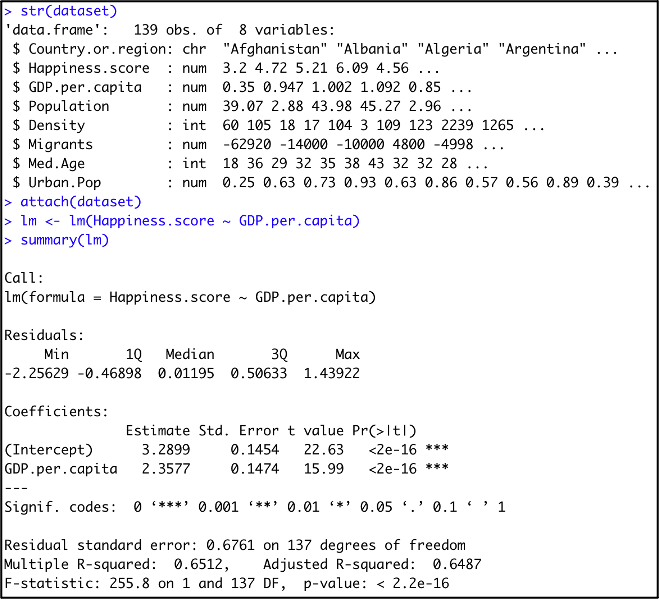
The World Happiness Report is a landmark survey of the state of global happiness. The report calculates a happiness score for each country in the world based on answers to main life evaluation question from nationally representative samples.
A researcher is using these happiness scores to determine which variables are able to explain the state of happiness of a country. Therefore, she has built the following linear model in R:
Given the linear model that this researcher has fit, which of the following statements is false?
There is a positive correlation between the state of happiness of a country and its GDP per capita
About 67.61% of the variation in hapiness of a country can be explained by its GDP per capita.
We can reject the null hypothesis that there is no linear association between the state of happiness of a country and its GDP per capita on a significance of 5%.
Data on 139 countries were used to fit this linear model.
About 67.61% of the variation in hapiness of a country can be explained by its GDP per capita.
The number of hours of training time received by employees and the time it took (in minutes) for them to trouble shoot their last process problem was estimated using a regression equation. The 95% prediction interval for trouble shooting time with 8 hours of training was determined to be 12.822 to 19.261. The correct interpretation is
We can be 95% confident that the trouble shooting time by a particular line worker who received 8 hours of training will be between 12.822 and 19.261 minutes.
A researcher gathers data on the length of essays (number of lines) and the SAT scores received for a sample of students enrolled at his university. Based on his regression results, the 95% confidence interval for the slope of the regression equation is -0.88 to 1.34. At α = 0.05, we can say
The slope of the regression equation is not significantly different from zero.
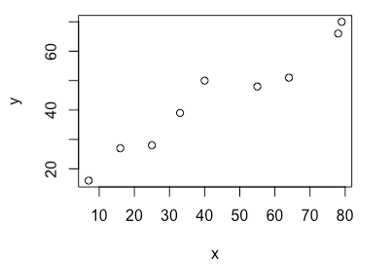
Gebaseerd op de gegeven scatterplot voor x en y, wat is de meest plausibele waarde voor de correlatiecoëfficiënt r?
0
0.05
-0.62
0.96
0.96
De hypothesetoets voor de richtingscoëfficiënt met H0: β1 = 0 bij lineaire regressie geeft je…
de exacte waarde van de richtingscoëfficiënt in de populatie
antwoord op de vraag of er een significant verschil is tussen 2 populatiegemiddeldes
antwoord op de vraag of er een statistisch significante lineaire associatie is tussen 2 kwantitatieve variabelen in de populatie
antwoord op de vraag of er een ander type van verband aanwezig is (niet-lineair, maar vb. exponentieel) tussen 2 kwantitatieve variabelen
antwoord op de vraag of er een statistisch significante lineaire associatie is tussen 2 kwantitatieve variabelen in de populatie

Een boekhandel wil beoordelen of het hebben van meer verkopers per dag hun omzet zal verhogen. Ervan uitgaande dat aan de aannames en condities voor lineaire regressie is voldaan, wordt een lineaire regressie uitgevoerd op een steekproef (zie tabel) en is de richtingscoëfficiënt van de regressielijn 0.913 en het intercept 8.101. De standaarddeviatie van de residuen se is 1.477 en de standaardfout van de richtingscoëfficiënt is 0.0873.
Geef het 95%-betrouwbaarheidsinterval voor de voorspelde gemiddelde omzet op dagen waarop 12 werknemers werken.
17.932 ; 20.180
juist fout
Een residu is het verschil tussen de geobserveerde y-waarde in de gegevens en de daarmee corresponderende y-waarde voorspeld door het regressiemodel
juist
juist fout
De residuen kun je bepalen door de correlatiecoëfficiënt te berekenen
fout
juist fout
Residuen zijn steeds positieve waarden
fout
juist fout
Een residu is het verschil tussen de x-waarde en de voorspelde y-waarde
fout
Het betrouwbaarheidsinterval voor een voorspelde gemiddelde y-waarde bij een specifieke x-waarde…
is breder wanneer de standaarddeviatie van de residuen kleiner is (bij hetzelfde betrouwbaarheidsniveau)
is breder wanneer de x-waarde waarvoor je de voorspelling wil doen verder van de gemiddelde x-waarde ligt (bij dezelfde steekproefgegevens en betrouwbaarheidsniveau)
hangt enkel af van de steekproefgrootte en het gekozen betrouwbaarheidsniveau
is altijd breder dan het overeenkomstige predictie-interval voor een voorspelde individuele y-waarde
is breder wanneer de x-waarde waarvoor je de voorspelling wil doen verder van de gemiddelde x-waarde ligt (bij dezelfde steekproefgegevens en betrouwbaarheidsniveau)
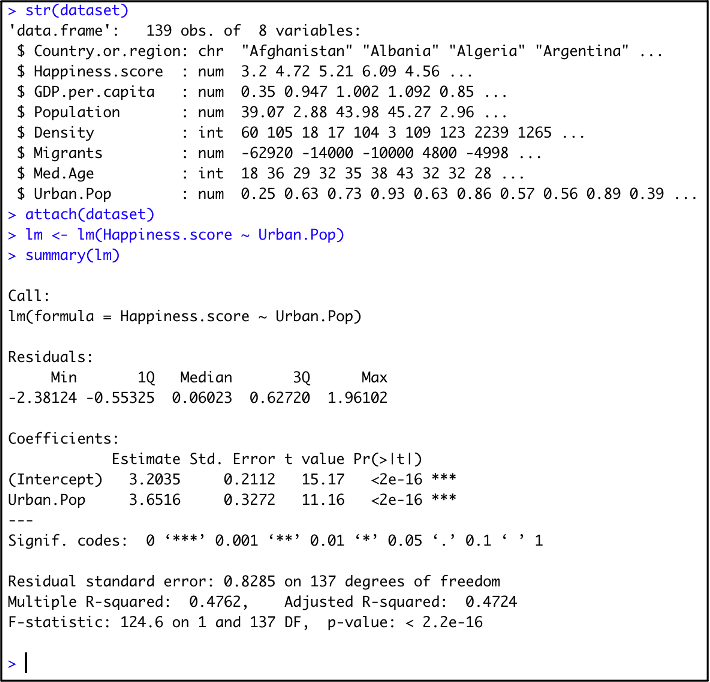
The World Happiness Report is a landmark survey of the state of global happiness. The report calculates a happiness score for each country in the world based on answers to main life evaluation question from nationally representative samples.
A researcher is using these happiness scores to determine which variables are able to explain the state of happiness of a country. Therefore, she has built the following linear model in R:
Given the linear model that this researcher has fit, which of the following statements is false?
We can reject the null hypothesis that there is no linear association between the state of happiness of a country and its urban population on a significance of 5%.
About 47.62% of the variation in hapiness of a country can be explained by its urban population.
There is a negative correlation between the state of happiness of a country and its urban population.
Data on 139 countries were used to fit this linear model.
There is a negative correlation between the state of happiness of a country and its urban population.
juist fout
Als de relatie tussen 2 kwantitatieve variabelen niet lineair is, maar een eerder gebogen positieve trend heeft, en je berekent toch de correlatiecoëfficiënt r dan heeft deze de waarde 0.00
fout
juist fout
Het heeft enkel zin de correlatiecoëfficiënt r te berekenen wanneer de 2 variabelen kwantitatief zijn én wanneer de relatie effectief ook lineair is
juist
juist fout
Als het teken van de correlatiecoëfficiënt r negatief is dan zal ook het teken van de richtingscoëfficiënt b1 negatief zijn
juist
juist fout
Een uitschieter kan er soms toe leiden dat een zwakke correlatie (r dicht bij 0 zonder de uitschieter) een hoge correlatiecoëfficiënt bekomt (r dichter bij 1 of -1, met de uitschieter)
juist