OPT 323 Biostatistics
1/79
There's no tags or description
Looks like no tags are added yet.
Name | Mastery | Learn | Test | Matching | Spaced | Call with Kai |
|---|
No analytics yet
Send a link to your students to track their progress
80 Terms
What is a population?
collection of people that we want to generalize a set of findings to
What is a sample?
small part of population that we study to determine the generalities we are interested in = should be representative of the population
What is a discrete numeric variable?
numeric variable that can only take on certain discrete values with gaps or interruptions in the values that the variable can assume (usually integers)
ex) count data of patients

What is a continuous numeric variable?
numeric variable that can technically be measured with unlimited precision with NO gaps in values that the variable could assume
ex) BP, IOP

What is an ordered categorical variable?
categorical with a “value” variable that can take on a logical order, sequence or rank
ex) level of physical fitness

What is an unordered categorical variable?
categorical variable with a “value” that is NOT able to be organized in a logical order, sequence or rank
ex) eye colour

What is a dichotomous variable?
variable only consists of 2 categories
Ex) Defining a cataract as either nuclear, cortical, or posterior subcapsular is an example of what type of variable?
categorical, unordered
Ex) Defining a cataract as either 1+, 2+, 3+, or 4+ is an example of what type of variable?
numeric/categorical, discrete, ordered
What is an independent variable?
variable that is manipulated by the experimenter and that does not depend on any other variables = “predictor variable” = X axis
What is a dependent variable?
variable that is not manipulated by the experimenter and that does depend on the other variables = "outcome variable" = Y axis
What is the mean?
average of all values in a data set

What is the median?
middle value in a data set
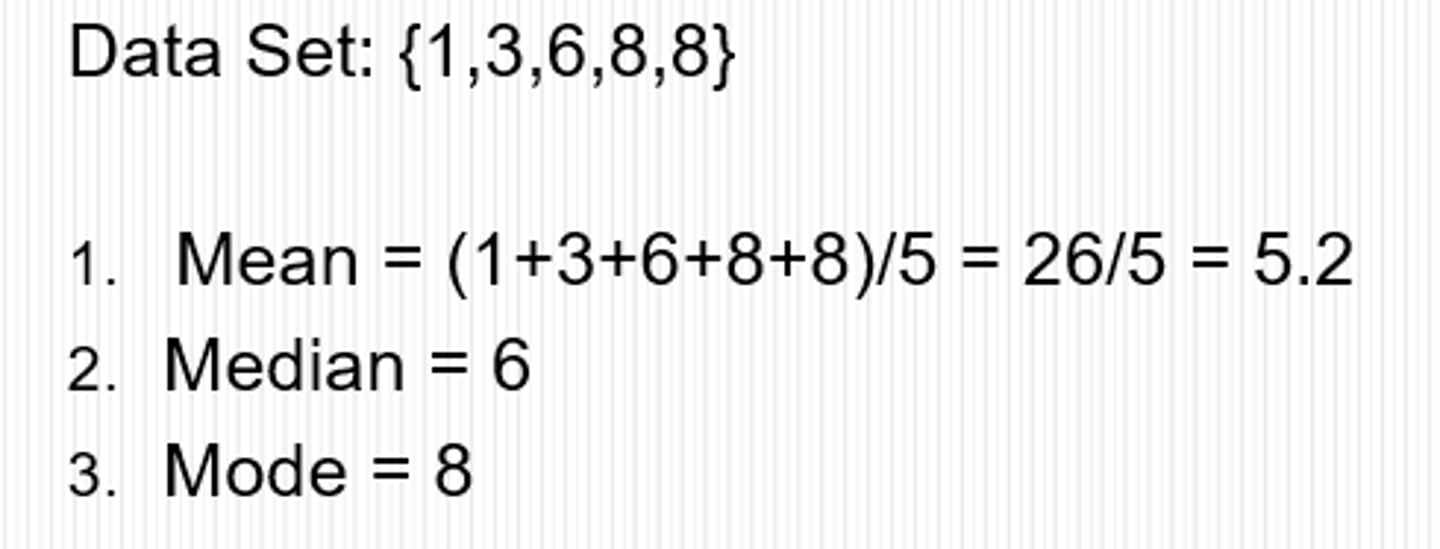
What is the mode?
most commonly occurring value in a data set

What is variance?
reflects how different each data point if from the mean
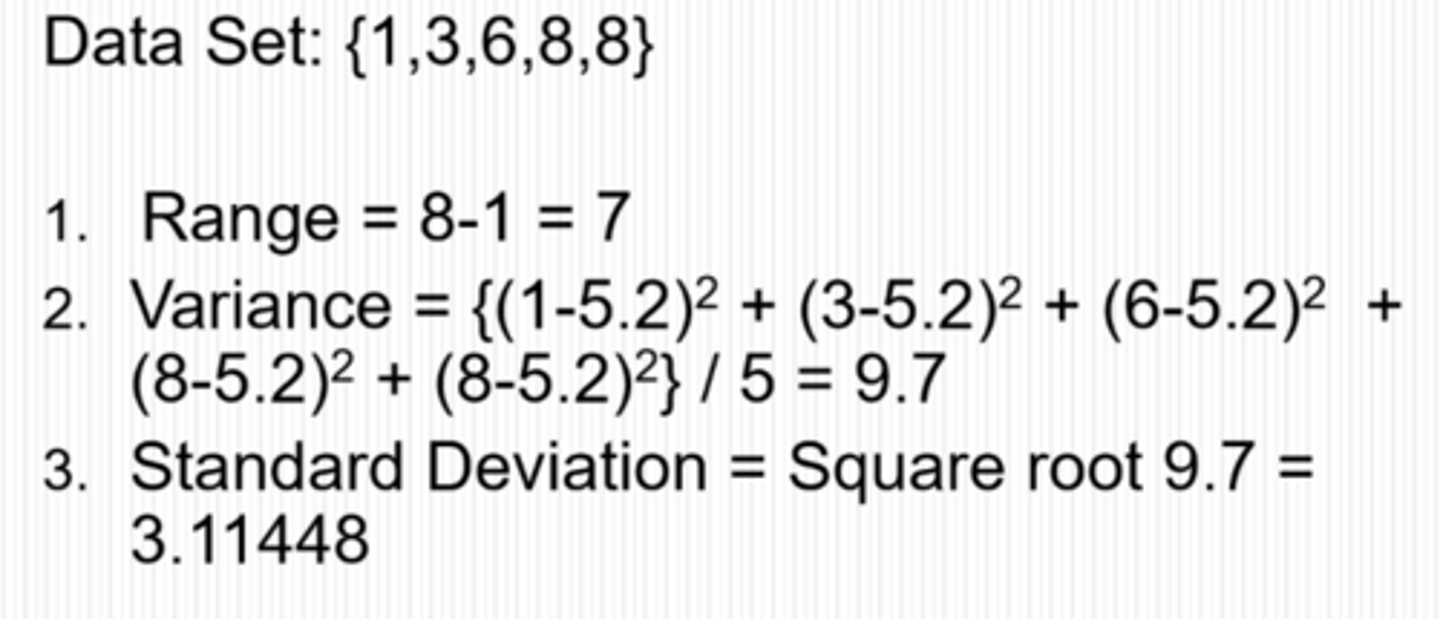
What is standard deviation?
square root of the variance

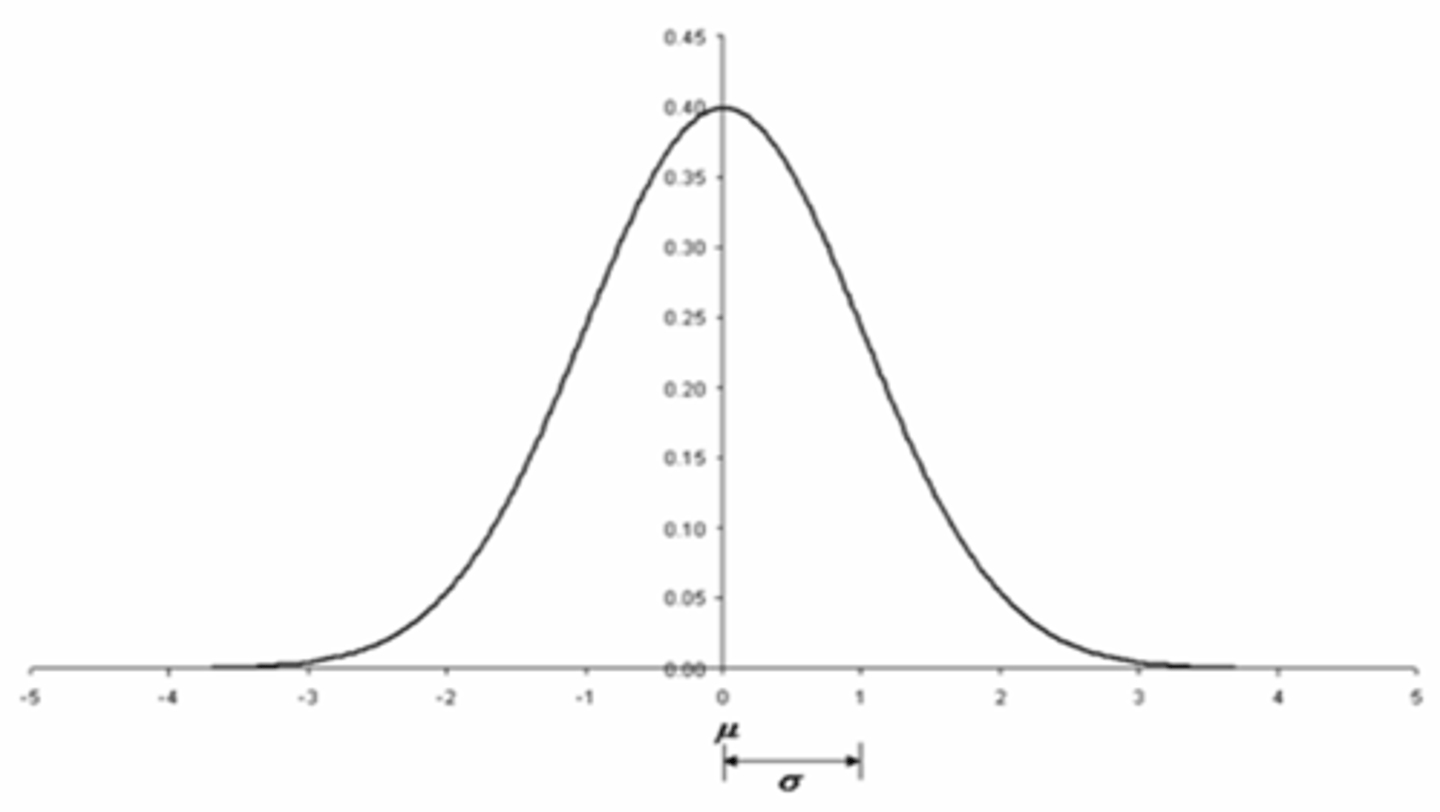
What % of data falls within 1 standard deviation of the mean?
68%

What % of data falls within 2 standard deviations of the mean?
95%

What % of data falls within 3 standard deviations of the mean?
99.7%
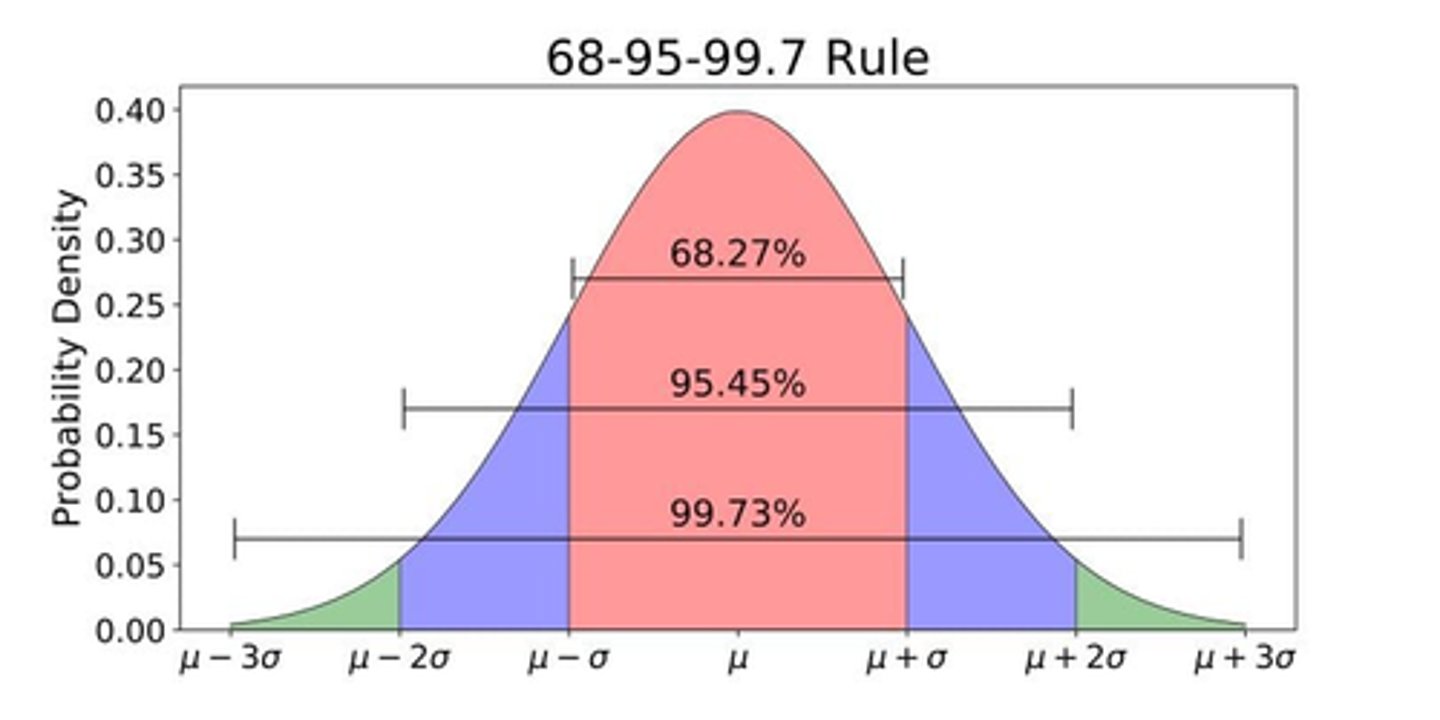
What is a normal distribution? What 2 things do we need to define it?
symmetric bell curve distribution of data defined solely by the mean and standard deviation
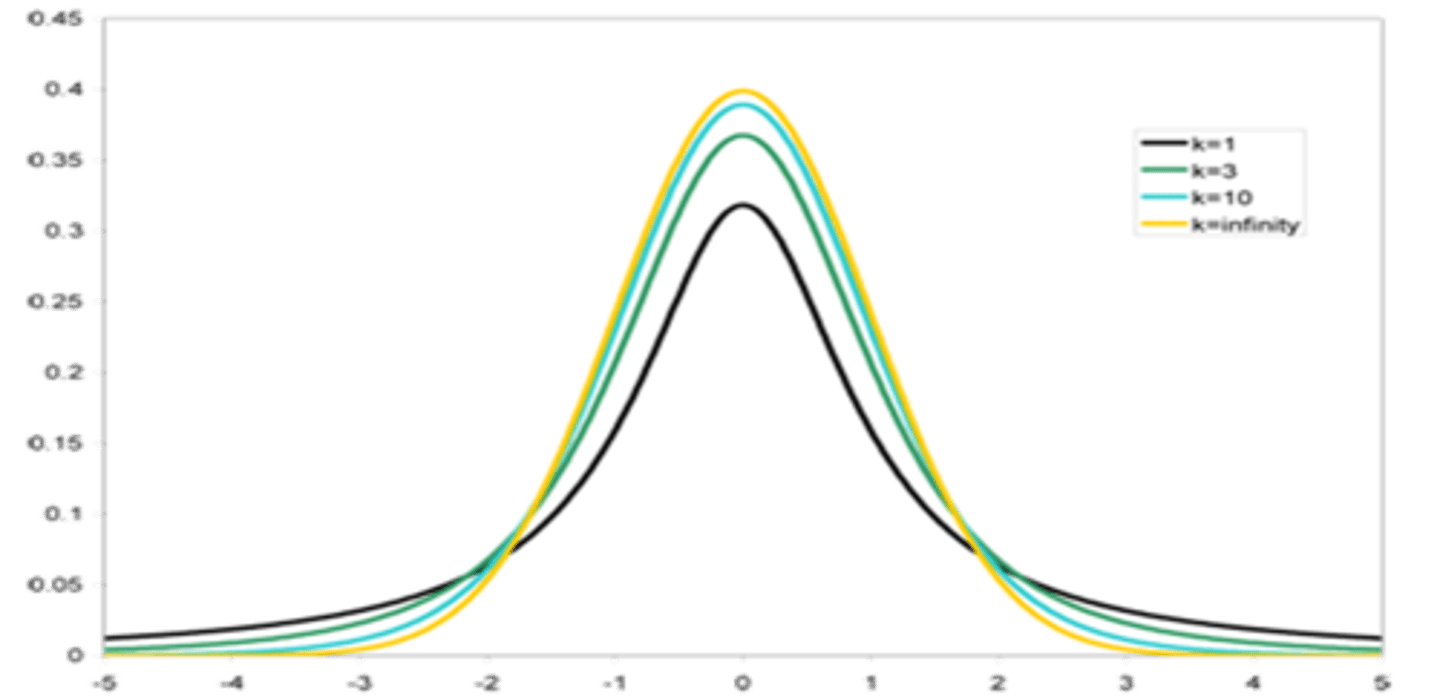
When might we use a t distribution?
useful for data sets that are not fit by the normal distribution (small sample sizes esp < 30) = distribution of data changes based on the degrees of freedom

The smaller the degrees of freedom, the __________ the peak and the ___________ the tails of a t distribution.
smaller degrees of freedom:
lower peak
higher tails
What is a null hypothesis?
H0 = there is no statistical difference between the 2 groups
What is an alternative hypothesis?
Ha = there is a statistical difference between the 2 groups

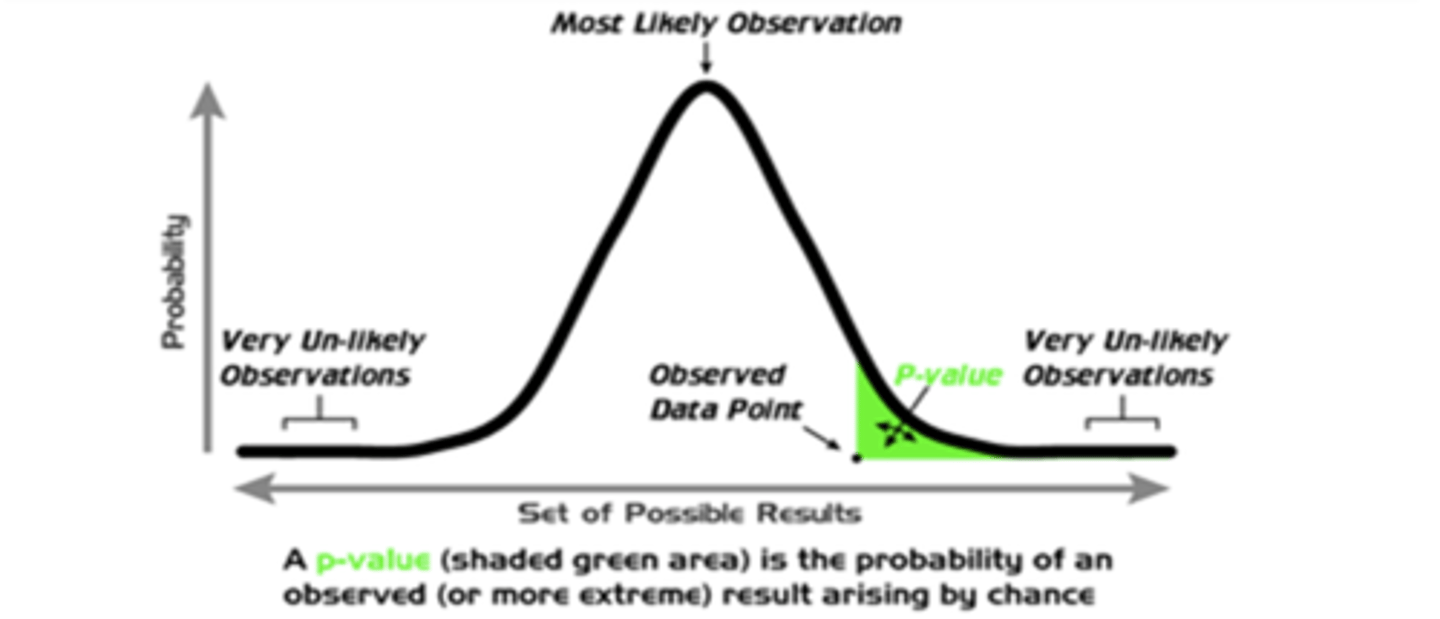
What is the p-value?
probability of observing a certain data set given that the null hypothesis is true

What does it mean if we have a large p-value that is larger than our pre-set alpha value?
we do not have evidence to reject the null hypothesis = supports the null

What does it mean if we have a small p-value that is smaller than our pre-set alpha value?
we do have evidence to reject the null hypothesis = supports the alternative

Essentially, a smaller p-value indicates that there is ___________ support for our alternative hypothesis.
stronger

What is an independent t-test?
determines whether the 2 means collected from 2 independent sample groups are significantly different
ex) 1 group receives drug, 1 group receives placebo
What is a dependent t-test?
determines whether the 2 means collected from 1 dependent sample group are significantly different
ex) 2 measurements conducted on the same person at different times
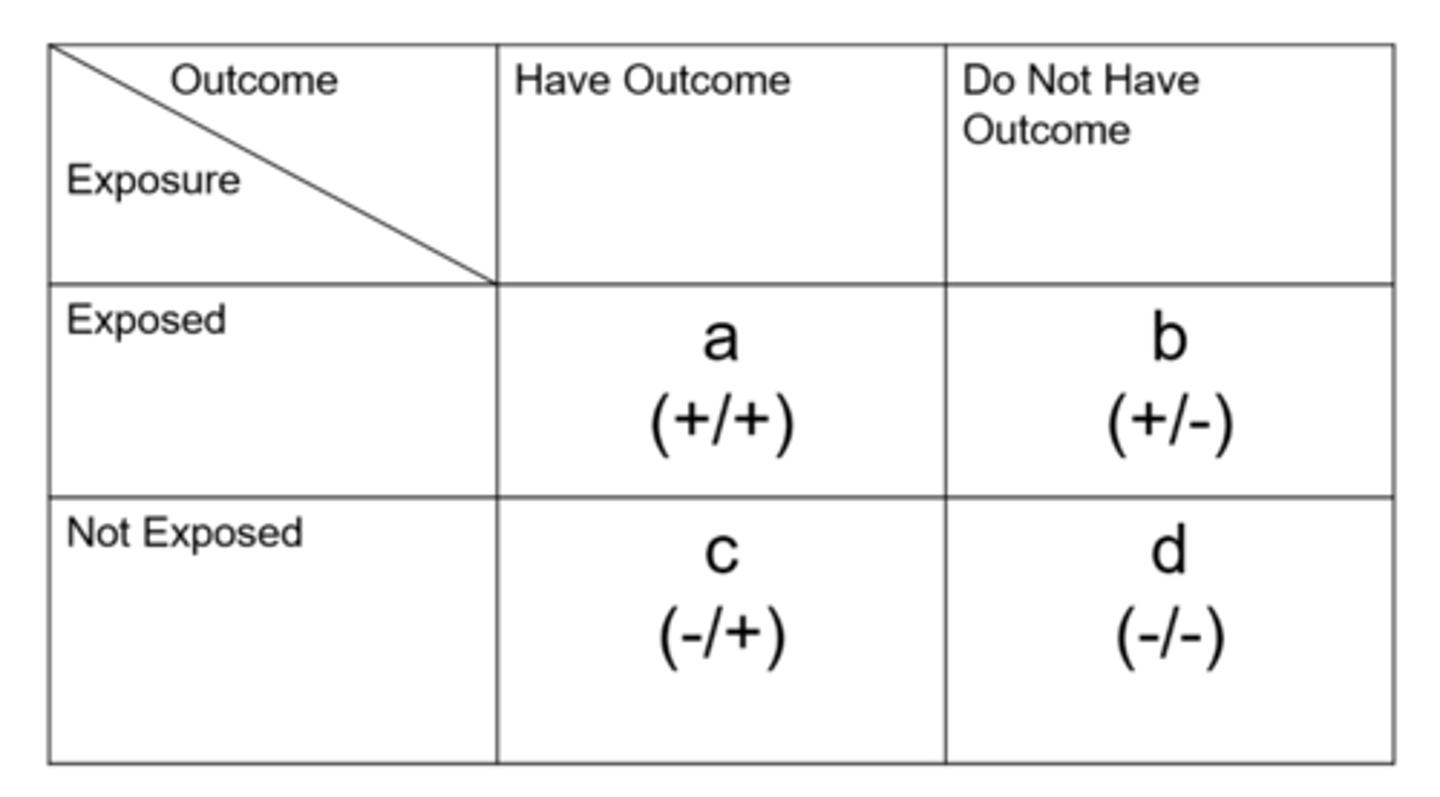
How do we determine cumulative incidence from a contingency table?
= exposed people with disease / total exposed people with and without disease
can also do with unexposed

How do we determine relative risk from a contingency table?
cohort study:
= cumulative incidence in exposed / cumulative incidence in unexposed

How do we determine odds from a contingency table?
= exposed people with disease / exposed people without disease
can also do with unexposed

How do we determine odds ratio from a contingency table?
case control study:
= odds in exposed / odds in unexposed
Does the relative risk or odds ratio always overestimate the risk?
odds ratio = this is especially true when the outcome/disease is common

Ex) from this data of Yellow Fever in Memphis, what is the cumulative incidence in the exposed?
= exposed people with disease / total exposed people with and without disease
= 4204 / 6000
= 70%

Ex) from this data of Yellow Fever in Memphis, what is the cumulative incidence in the unexposed?
= unexposed people with disease / total unexposed people with and without disease
= 946 / 14,000
= 6.8%

Ex) from this data of Yellow Fever in Memphis, what is the relative risk for the outcome?
= cumulative incidence in exposed / cumulative incidence in unexposed
= 70% / 6.8%
= 10.3x

Ex) from this data of Yellow Fever in Memphis, what is the odds in the exposed?
= exposed people with disease / exposed people without disease
= 4204 / 1769
= 2.34
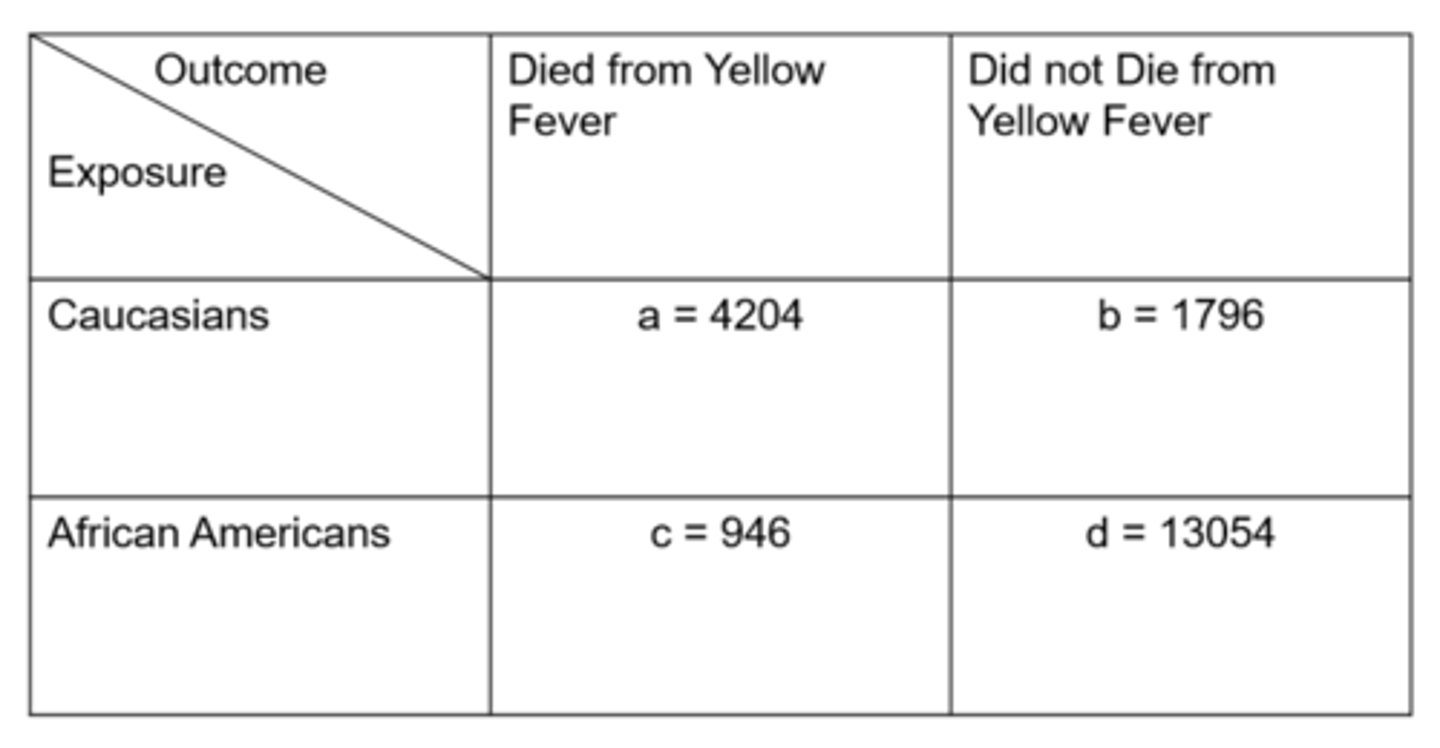
Ex) from this data of Yellow Fever in Memphis, what is the odds in the unexposed?
= unexposed people with disease / unexposed people without disease
= 946 / 13,054
= 0.072

Ex) from this data of Yellow Fever in Memphis, what is the odds ratio?
= odds in exposed / odds in unexposed
= (4204 / 1976) / (946 / 13,054)
= 32.30

Ex) from this data of SCO Honors students, what is the cumulative incidence in the exposed?
41.9%

Ex) from this data of SCO Honors students, what is the cumulative incidence in the unexposed?
29.9%

Ex) from this data of SCO Honors students, what is the relative risk?
1.40

Ex) from this data of SCO Honors students, what is the odds in the exposed?
0.720
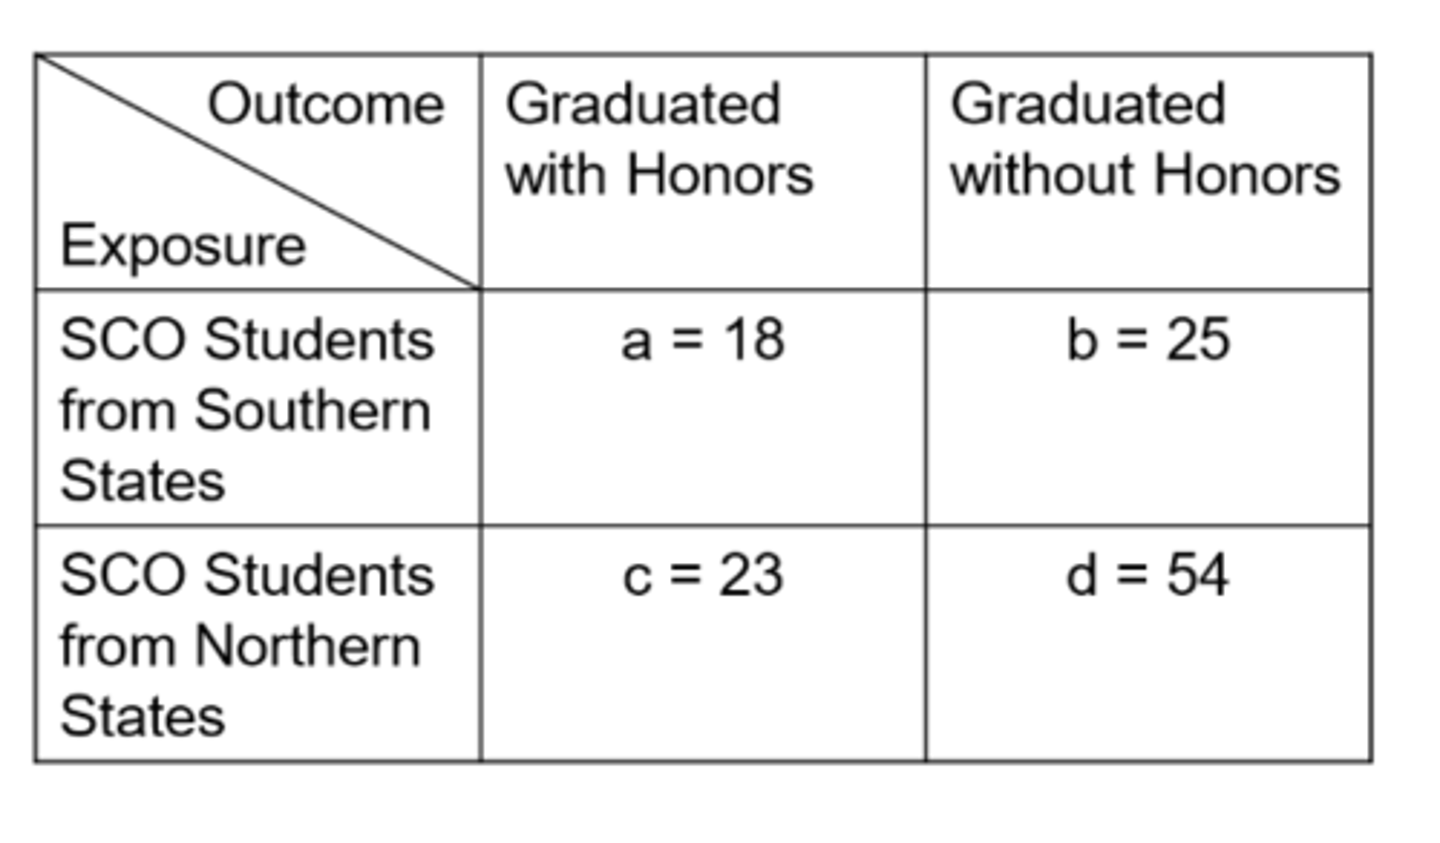
Ex) from this data of SCO Honors students, what is the odds in the unexposed?
0.426

Ex) from this data of SCO Honors students, what is the odds ratio?
1.69

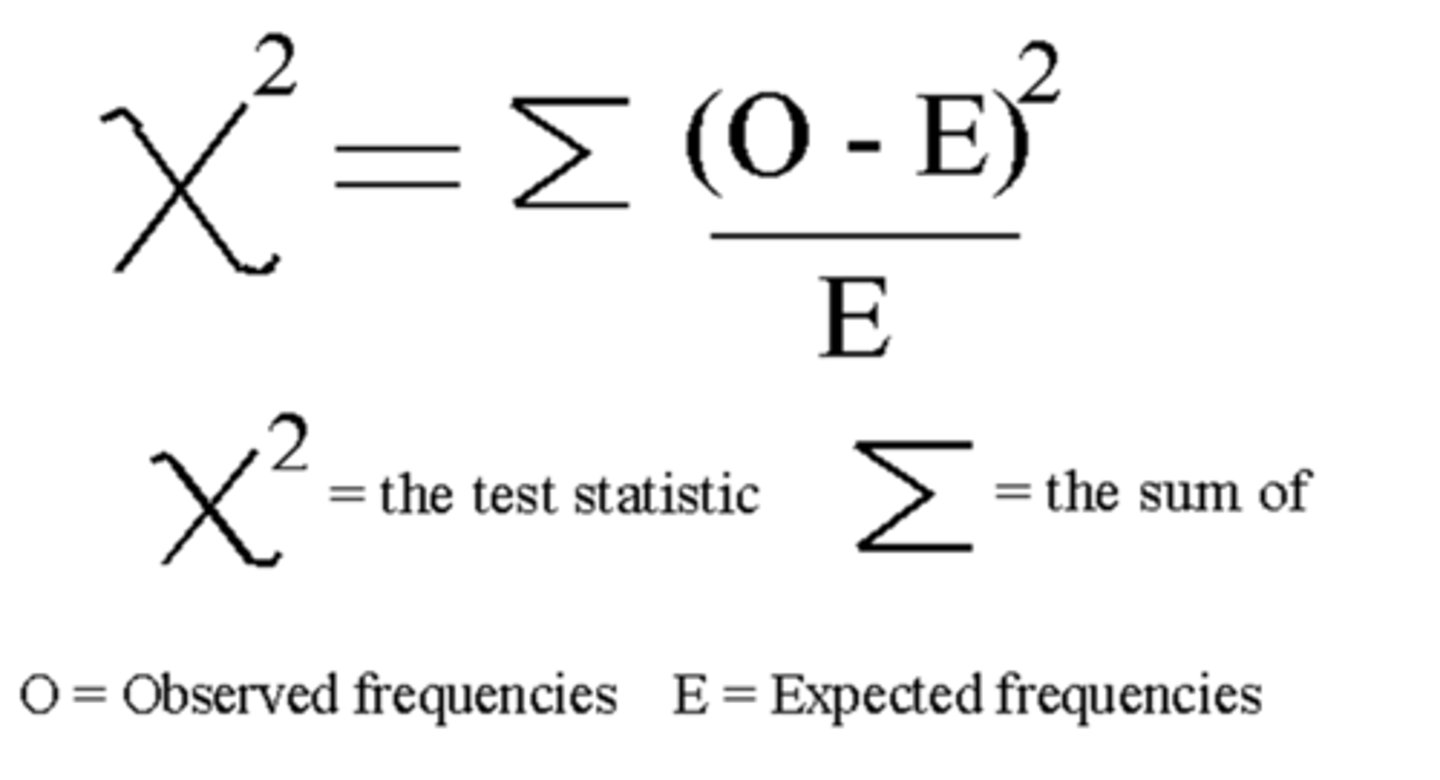
What is the Chi-squared test for independence?
tests the association between 2 categorical variables using a p-value to assess H0 (no association) and Ha (association)
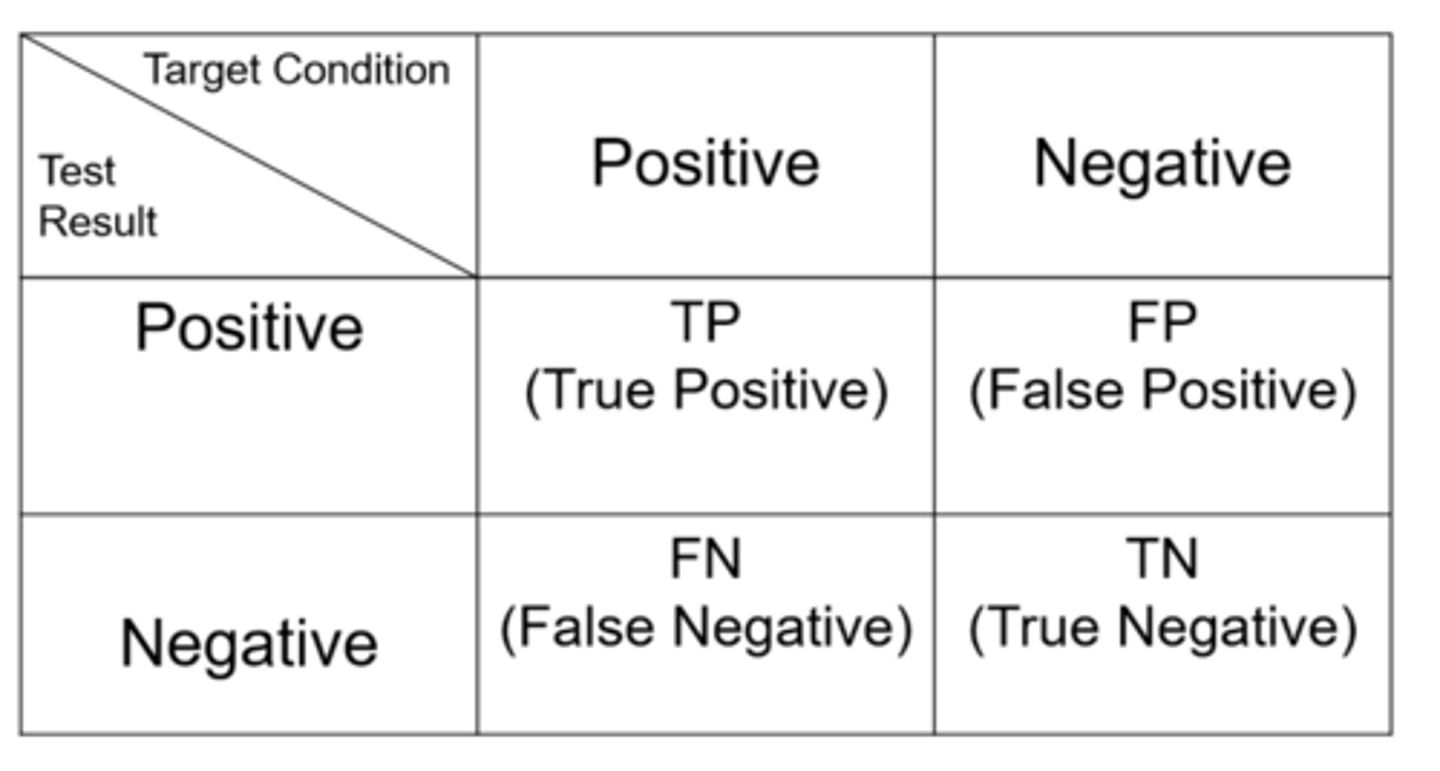
What is a type I error?
rejecting the null hypothesis when it is actually true = false positive = worst kind of error!
ex) convicting someone of a crime they did not commit
ex) approving an IOP drop as working "better" than timolol when it is not

What is a type II error?
rejecting the alternate hypothesis when it is actually true = false negative
ex) a guilty person is set free
ex) not approving an IOP drop even though it actually is "better" than timolol
Ex) what is the number of false positives for this data of SCO Honors students?
25

Ex) what is the number of false negatives for this data of SCO Honors students?
23

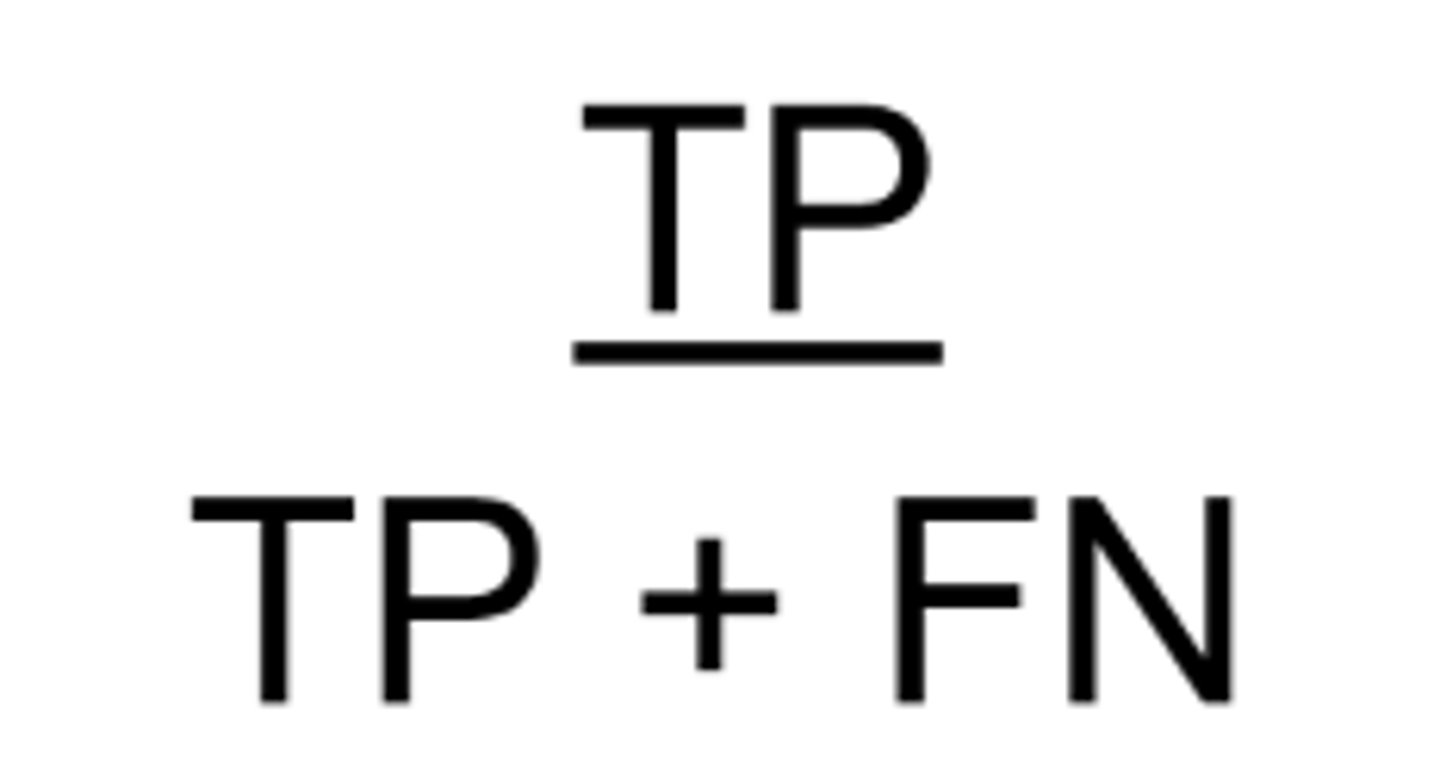
What is sensitivity?
proportion of subjects with the disease who have a positive test result = how good the test is at detecting true positives out of all people with disease

How do we calculate sensitivity?
= # true positives / all people with disease
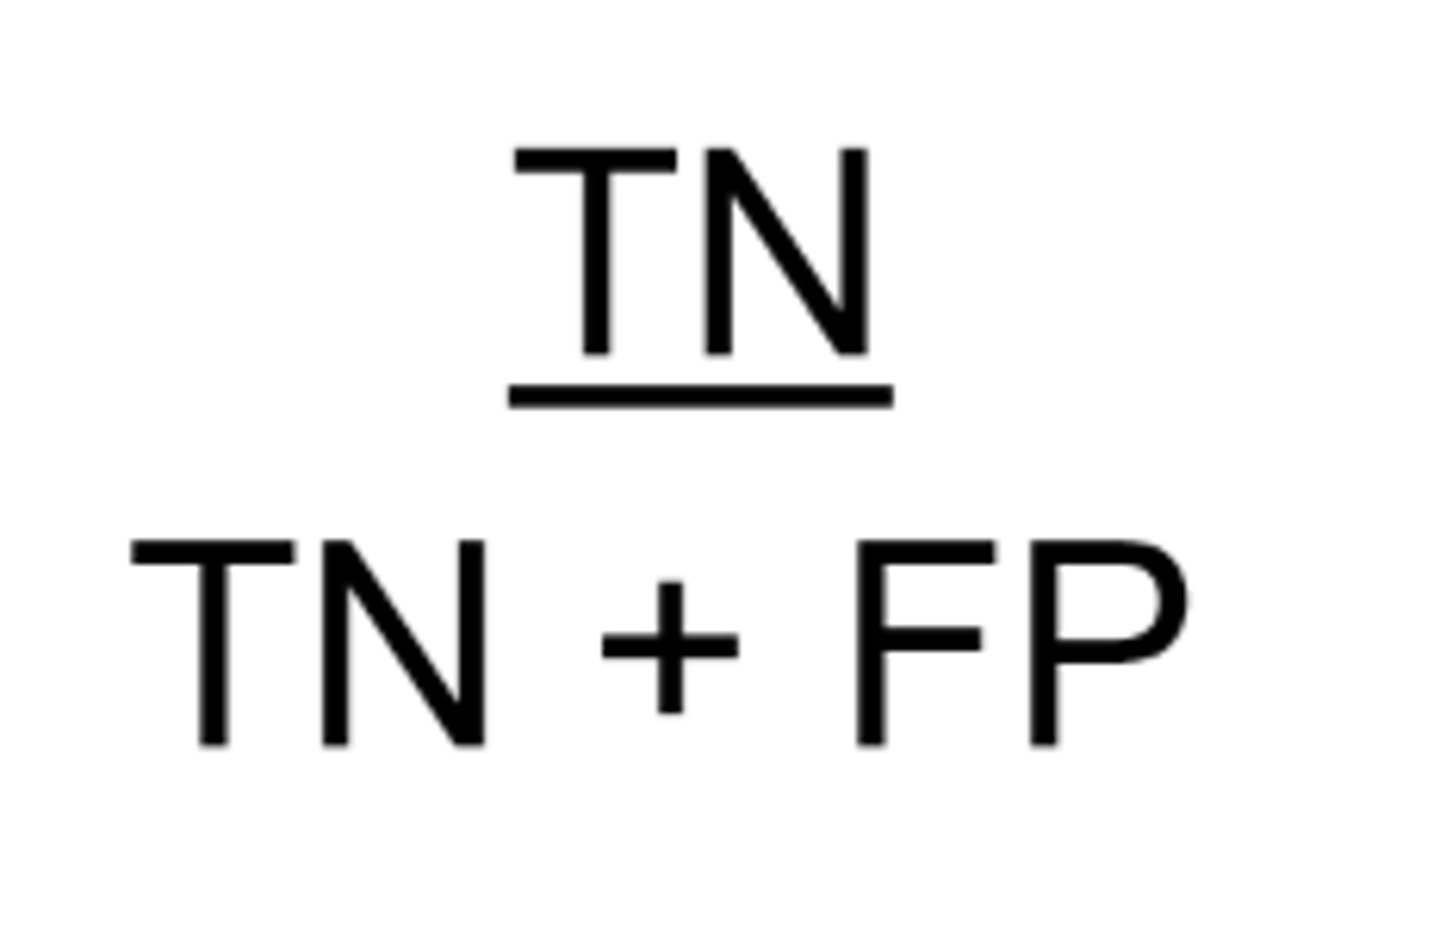
What is specificity?
proportion of subjects without the disease who have a negative test result = how good the test is at detecting true negatives out of all people without disease

How do we calculate specificity?
= # true negatives / all people without disease
What is positive predictive value?
proportion of subjects who test positive that actually have the condition = how good the test is at detecting people with disease out of all people who test positive
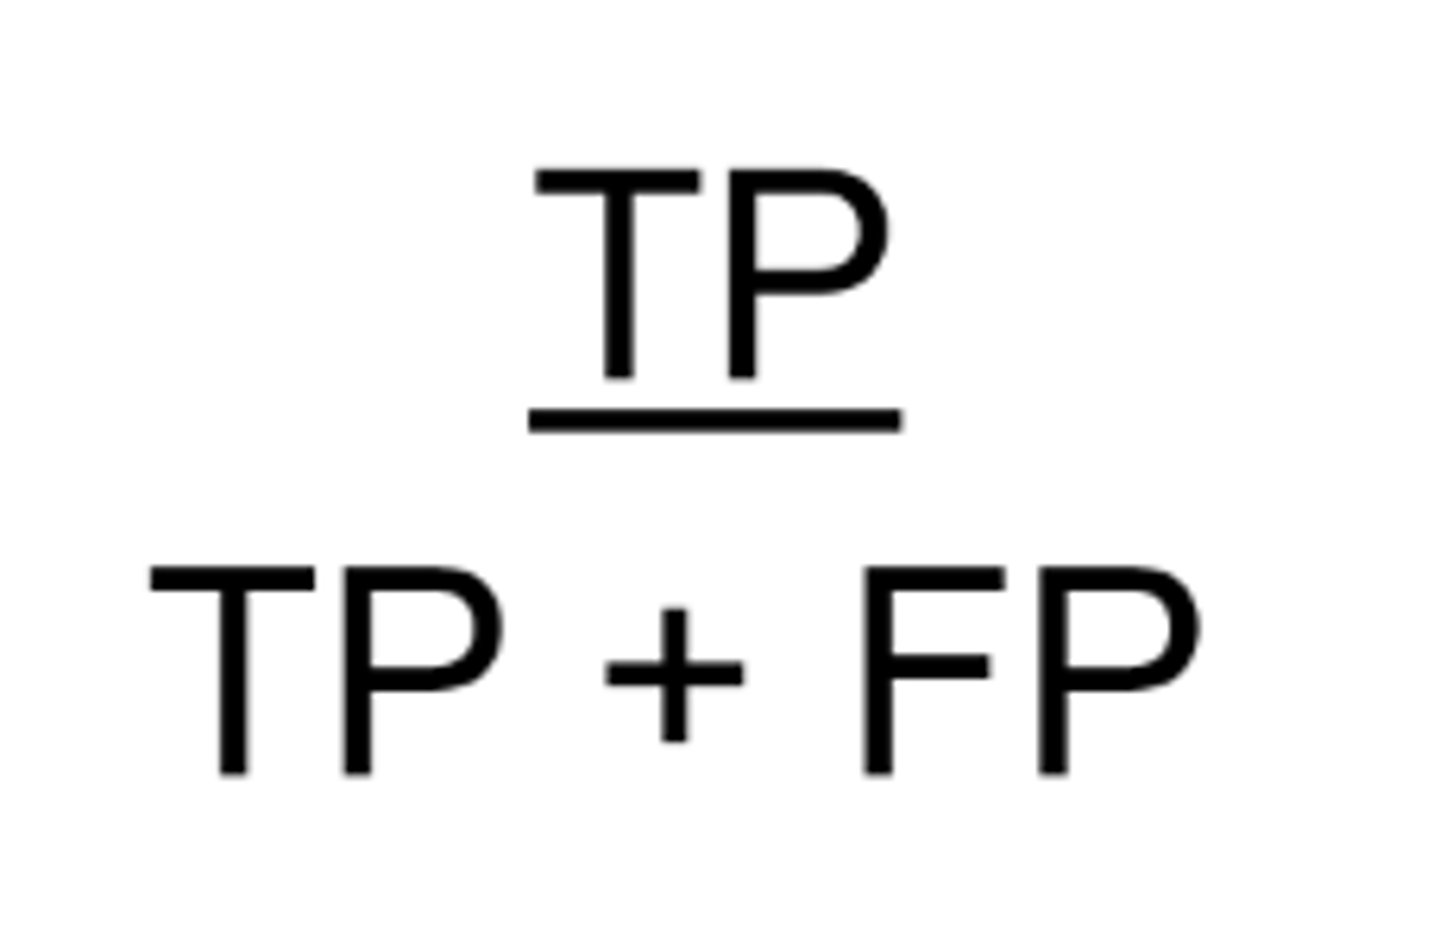
How do we calculate positive predictive value?
= # true positives / all people who test positive

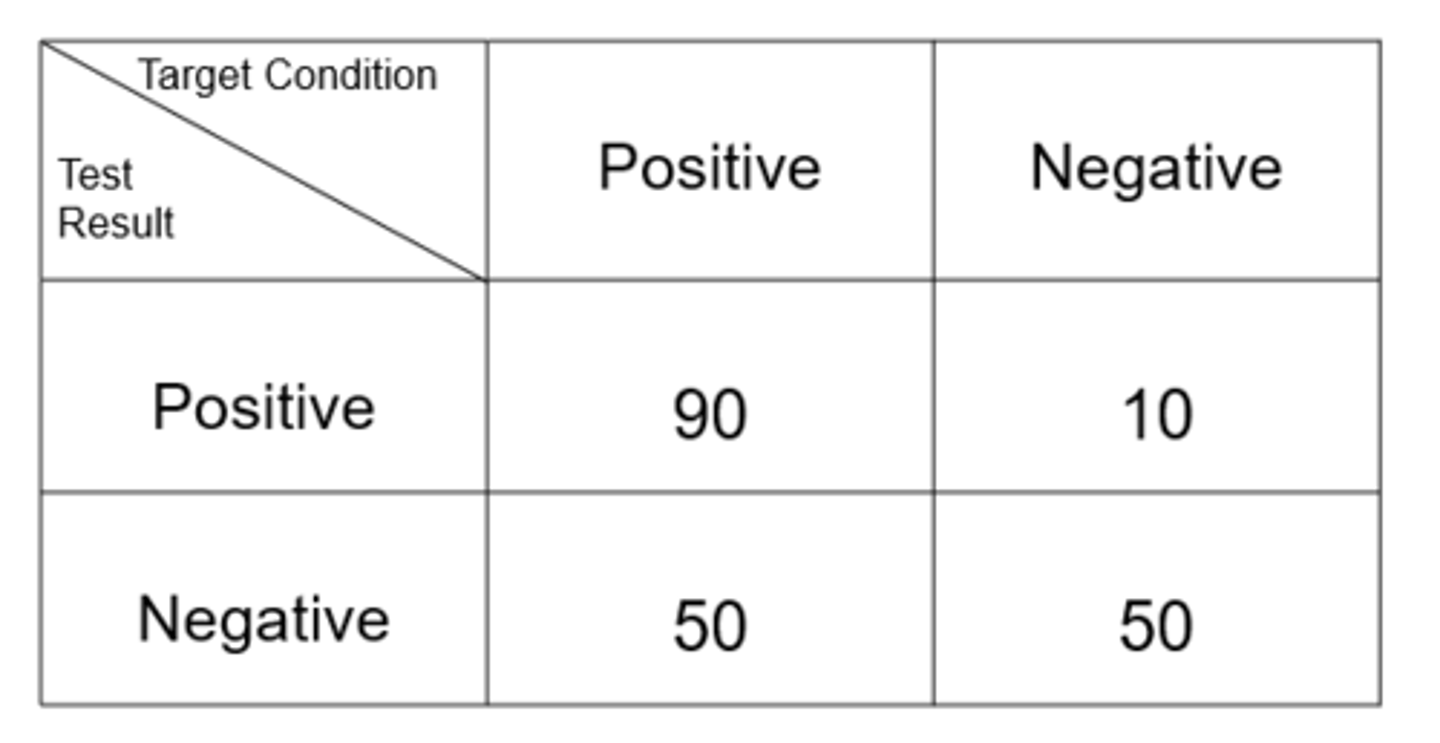
Ex) from this data set, what is the sensitivity?
64.3%

Ex) from this data set, what is the specificity?
83.3%

Ex) from this data set, what is the positive predictive value?
90%
What is a correlation coefficient (r)?
used to assess the strength of the correlation between 2 continuous variables
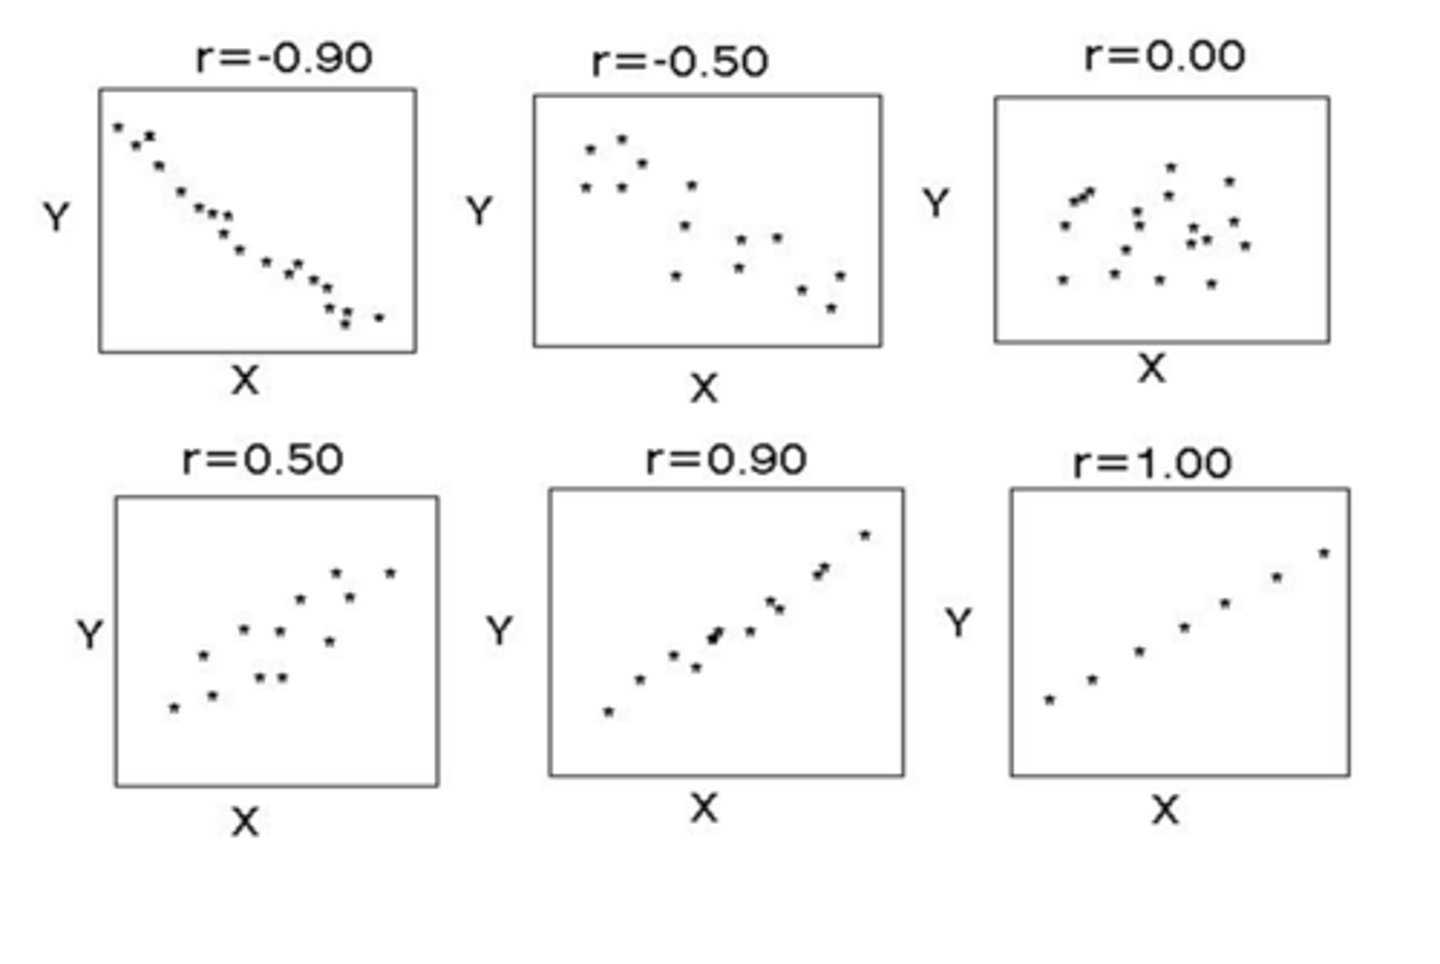
What does the + or - mean for correlation coefficient (r)?
+ means positive correlation
- means negative correlation
THINK: reflects the slope of the line

What is the range of values for correlation coefficient (r)?
r = 1.0 perfectly correlated
r ≥ 0.8 strong correlation
r < 0.8 but ≥ 0.5 fairly strong correlation
r < 0.5 weak correlation
r = 0.0 no correlation

What is simple linear regression?
linear model where one outcome is predicted from one predictor variable with a best-fit line
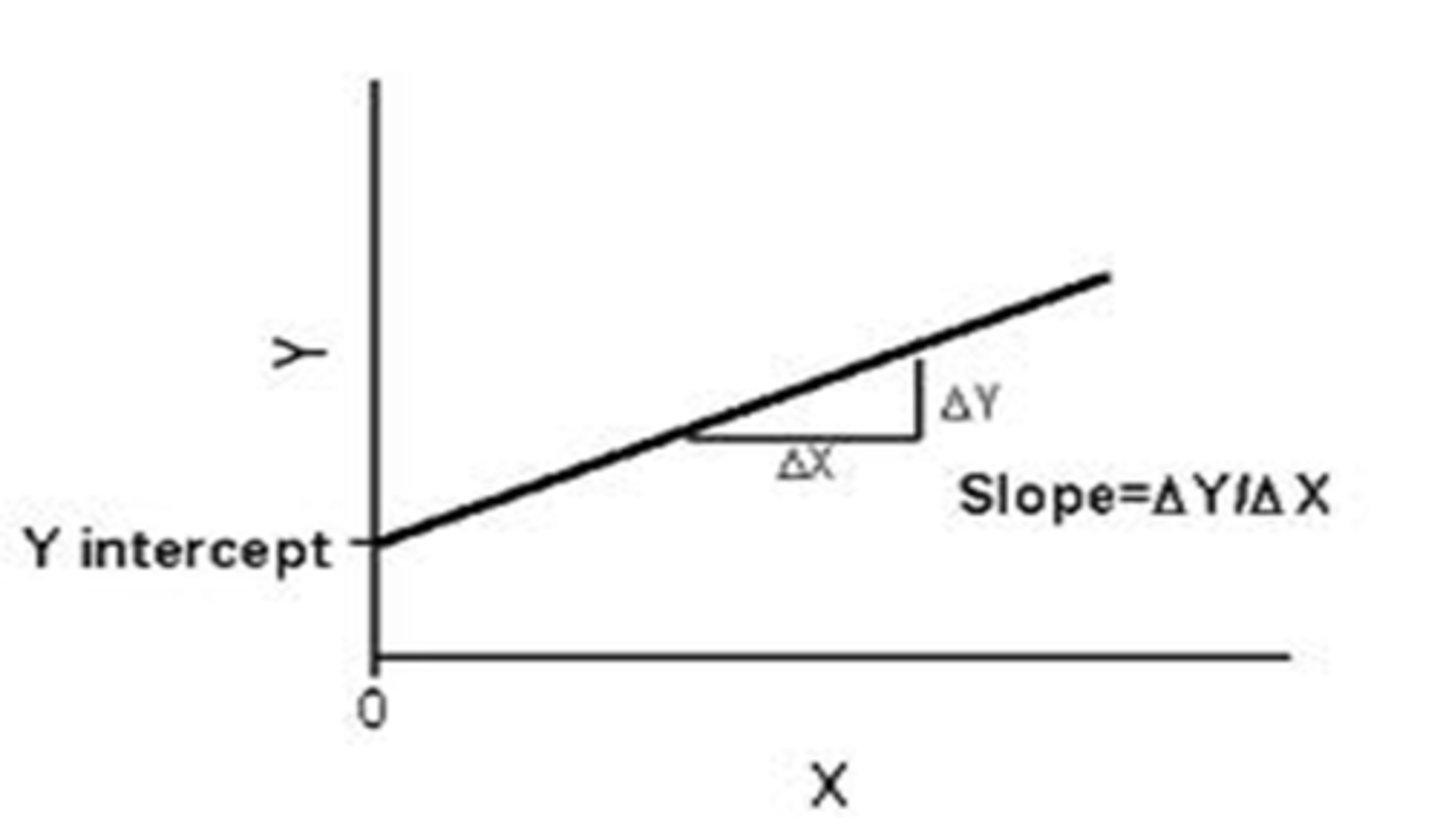
What is the formula for simple linear regression?
y = mx + b
where y is the dependent variable, m is the slope, x is the independent variable, and b is the y intercept
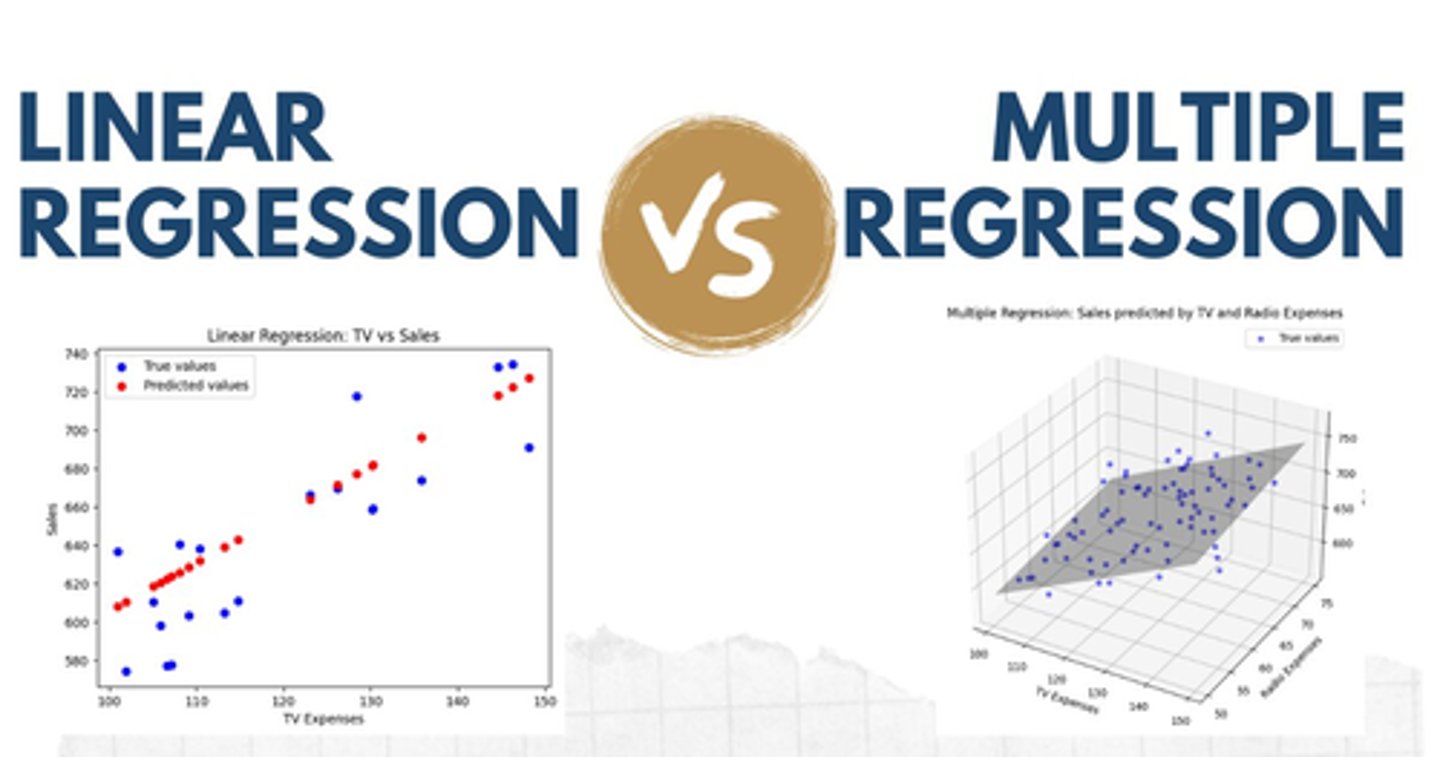
What is multiple regression?
linear model where one outcome is predicted from two or more predictor variables

What is the formula for multiple regression?
y = (each beta coefficient x each independent variable) + b
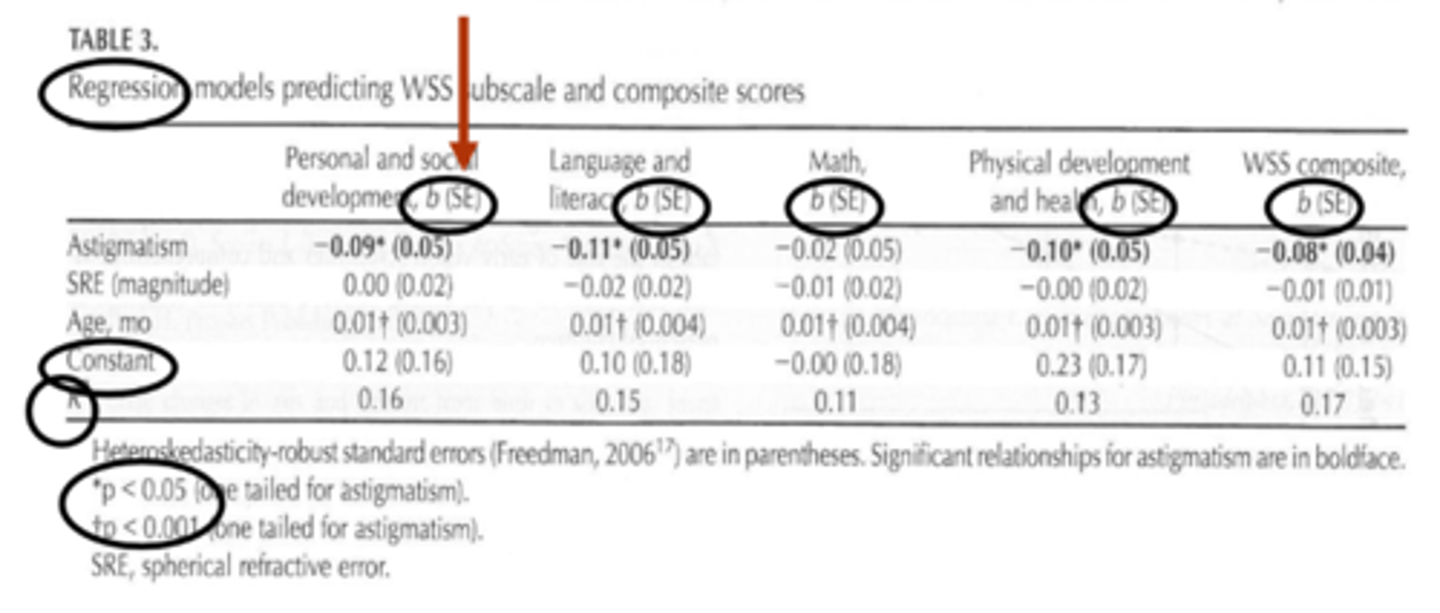
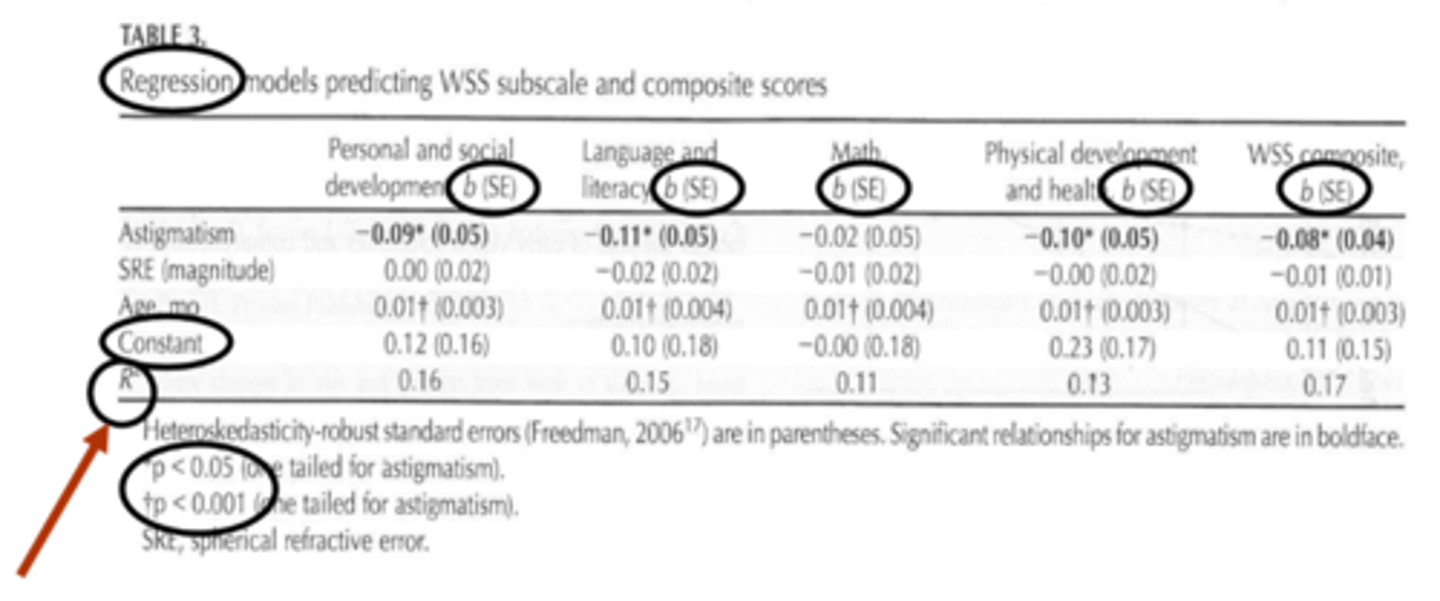
What is the constant in multiple regression?
y-intercept = value of the dependent variable in a regression equation when it's independent variable(s) equal 0
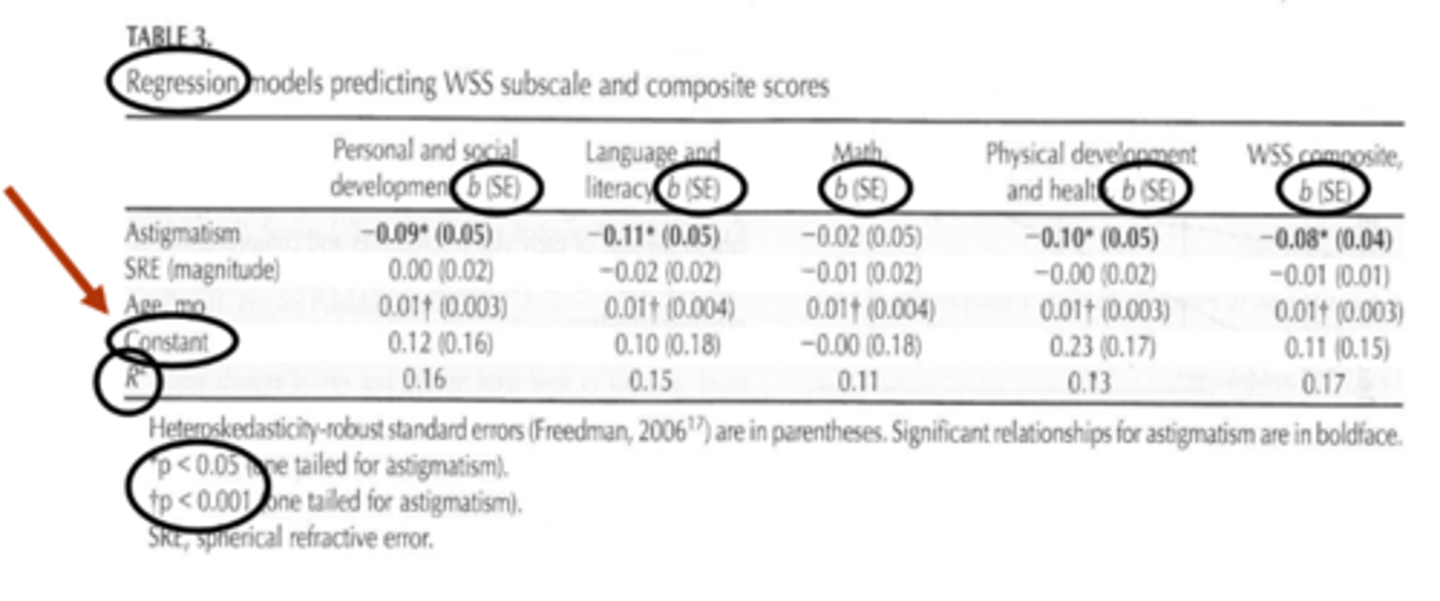
What is the beta coefficient in multiple regression?
degree of change in the dependent variable for every 1-unit change in a certain independent variable
ex) if beta is 0.2, then for every one unit increase in x there is a 0.2 increase in y
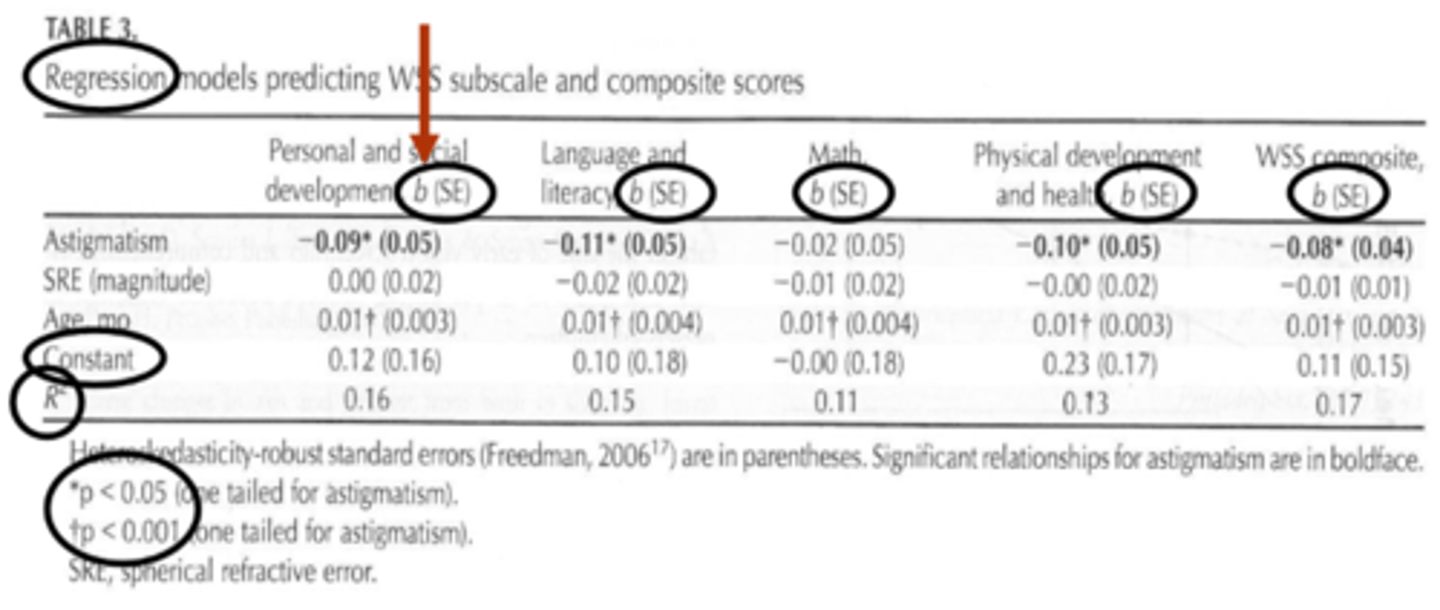
What is the coefficient p-value in multiple regression?
tells us whether or not an independent variable is statisticlaly significant
ex) if the p-value is less than the cutoff, the independent variable is stat significant
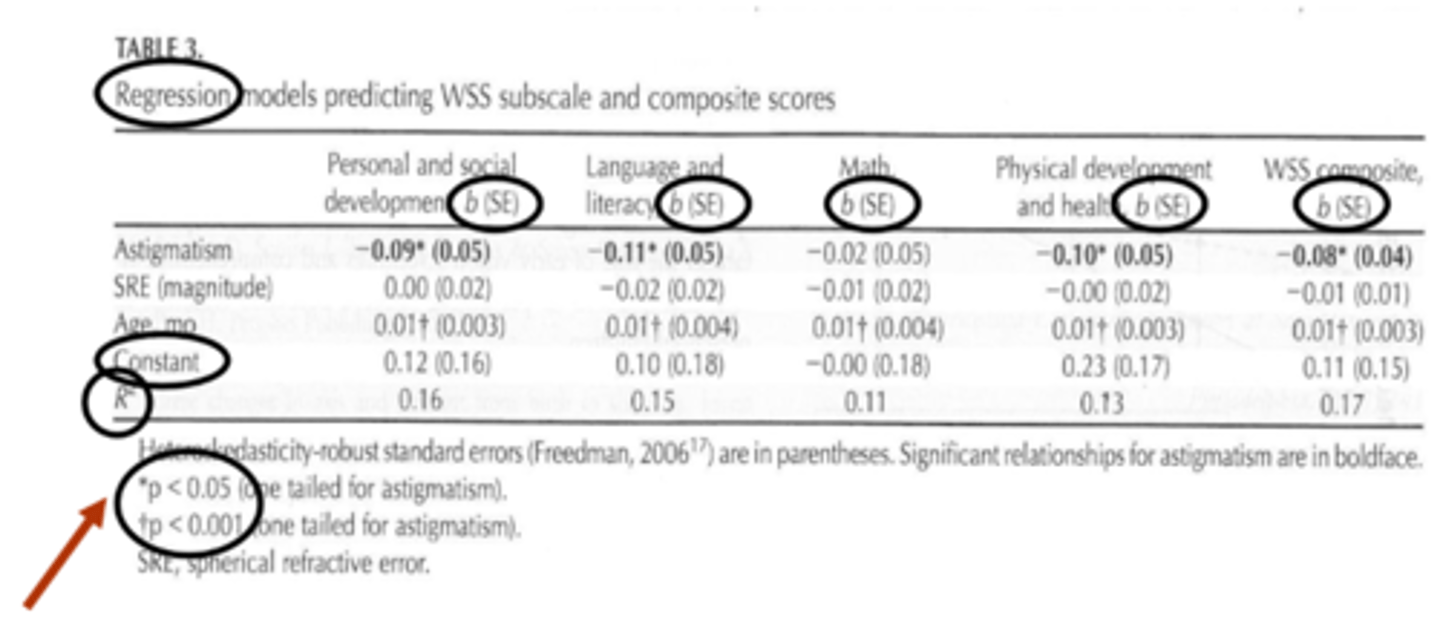
What is the standard error in multiple regression?
another way to tell us how well the linear regression lines fits the data = average distance that the observes values fall from the regression line
Does a smaller or larger standard error indicate that the model is better able to fit the data?
smaller SE

What is the R-squared value in multiple regression?
tells us how well the linear regression lines "fits" the data = the proportion of the variance in the dependent variables that can be explained by the independent variables
ex) and R2 values of 0.16 tells us that only 16% of the variance in the dependent variable can be explained by the independent variables
What is the possible range of values of the R-squared value in multiple regression?
0 to 1
0 indicates that the response variable is not explained by the predictor variable at all
1 indicates that the response variable is completely explained by the predictor variable w/o error

What is logistic regression?
a subset of multiple regression only used when the outcome is a categorical variable (e.g. outcome of seeing an optometrist or not, having disease or not) = since there is no linear relationship between x and y, we have to use the log of the y value (typically the log of the odds/probability)
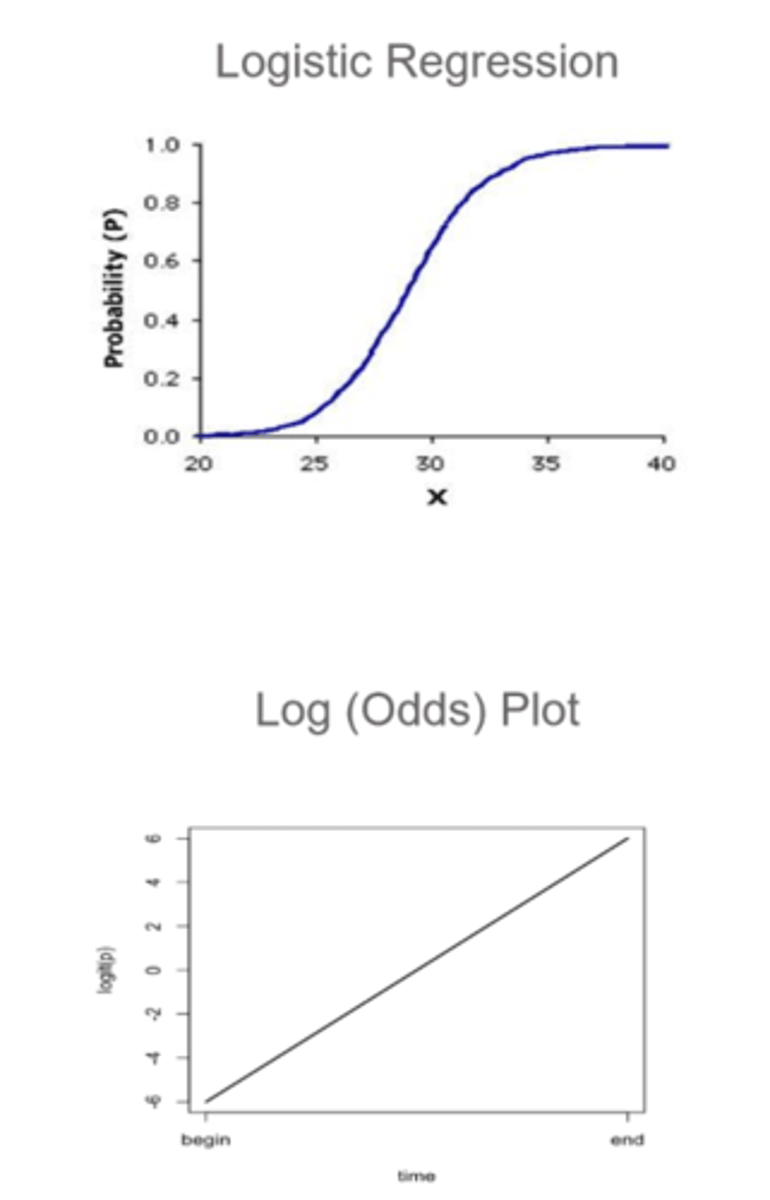
How do we typically use logistic regression?
use formula to calculate probability that an observation takes on a value of 1 = use this formula to predict whether something will be 1 = use predetermined probability threshold to classify an observation as 1 or 0

How does linear vs logistic regression differ in terms of the dependent variable?
linear = continuous
logistic = categorical
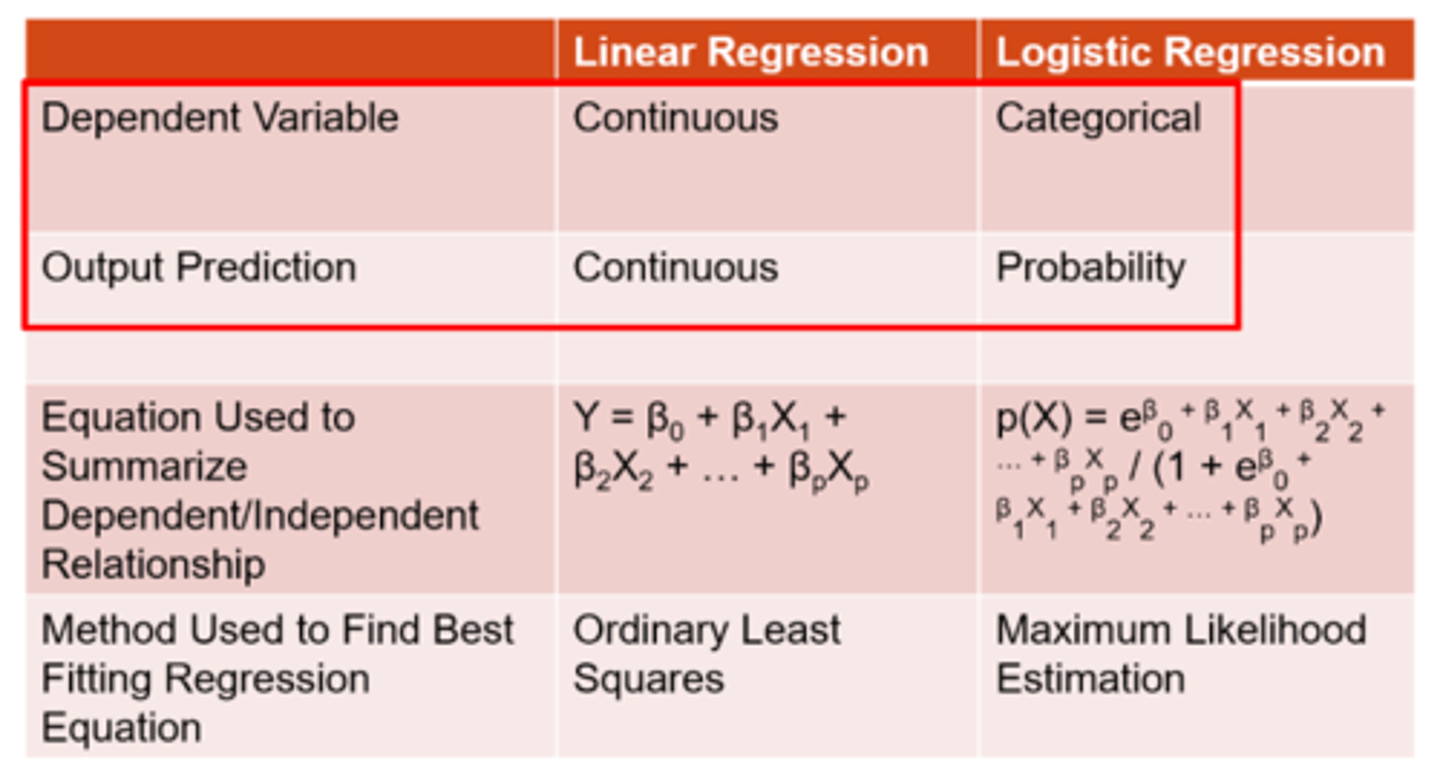
How does linear vs logistic regression differ in terms of the outcome variable?
linear = continuous
logistic = probability

How does linear vs logistic regression differ in terms of the method used to find best fit equation?
linear = ordinary least squares
logistic = maximum likelihood estimation
