5 - Normal Distribution + Standardising Data
1/16
There's no tags or description
Looks like no tags are added yet.
Name | Mastery | Learn | Test | Matching | Spaced | Call with Kai |
|---|
No analytics yet
Send a link to your students to track their progress
17 Terms
Standard Deviation
Measures the average amount by which all values deviate from
Smaller SD, the better
When Should We Change Data?
Return to original data
Error when data entered into database
Recode observation to ‘missing value’
Transform data:
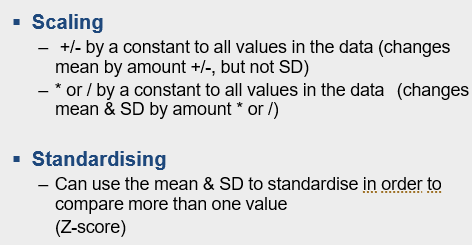
Scale data - units
Standardise data - common mean
±/- Numbers to Data
+ / - by a constant number to each value in a data set
Changes the mean by the amount added or subtracted
SD = Same
Multiplying/Dividing Data
Mean increases / decreases by the proportion its multiplied / divided by
SD Increases / decreases by the proportion its multiplied / divided by
Z Scores
Measure number of SDs an observation is from the mean
+ Z-score - observation above mean
- Z-score - observation below mean
0 Z-score - observation = mean
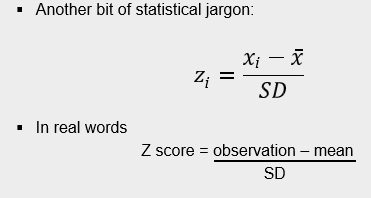
Calculating Z-Score
Rules of Z-Scores
Mean of all Z-scores = 0
SD = 1
Whole data set
Z-Score Indices
Can rank data
Positive measures must mean same for all variables
Compare Z-scores for these indicators by creating an index of all variables
Summary
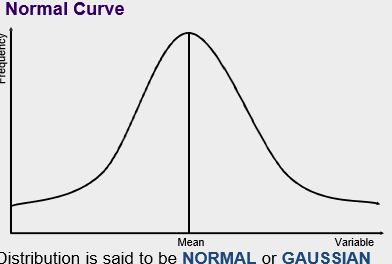
Normal Curve
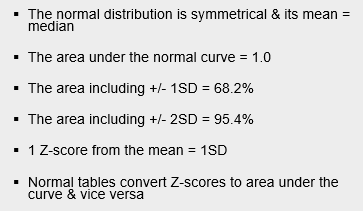
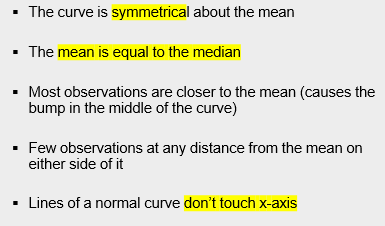
Properties of Normal Distribution
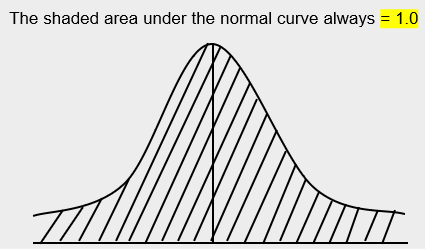
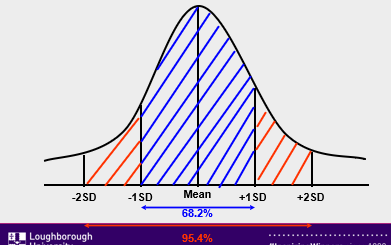
Areas Under the Normal Curve
Important Properties of Normal Curve
What if we don’t have a whole number Z-score?
Use normal tables
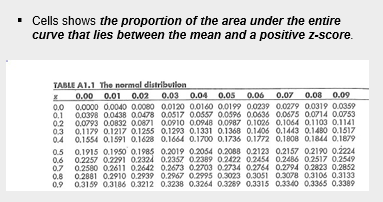
Normal Distribution Table
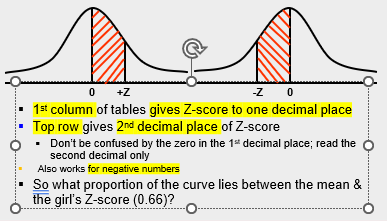
How to Use Normal Tables
Summary