carina level of economic activity
1/62
There's no tags or description
Looks like no tags are added yet.
Name | Mastery | Learn | Test | Matching | Spaced | Call with Kai |
|---|
No analytics yet
Send a link to your students to track their progress
63 Terms
conditions of demand and supply side of the economy as they are subject to continuous change
What cause variations in economic activity over time?
fluctuations in economic activity
What has major effects on economic well-being of societies and individuals within them?
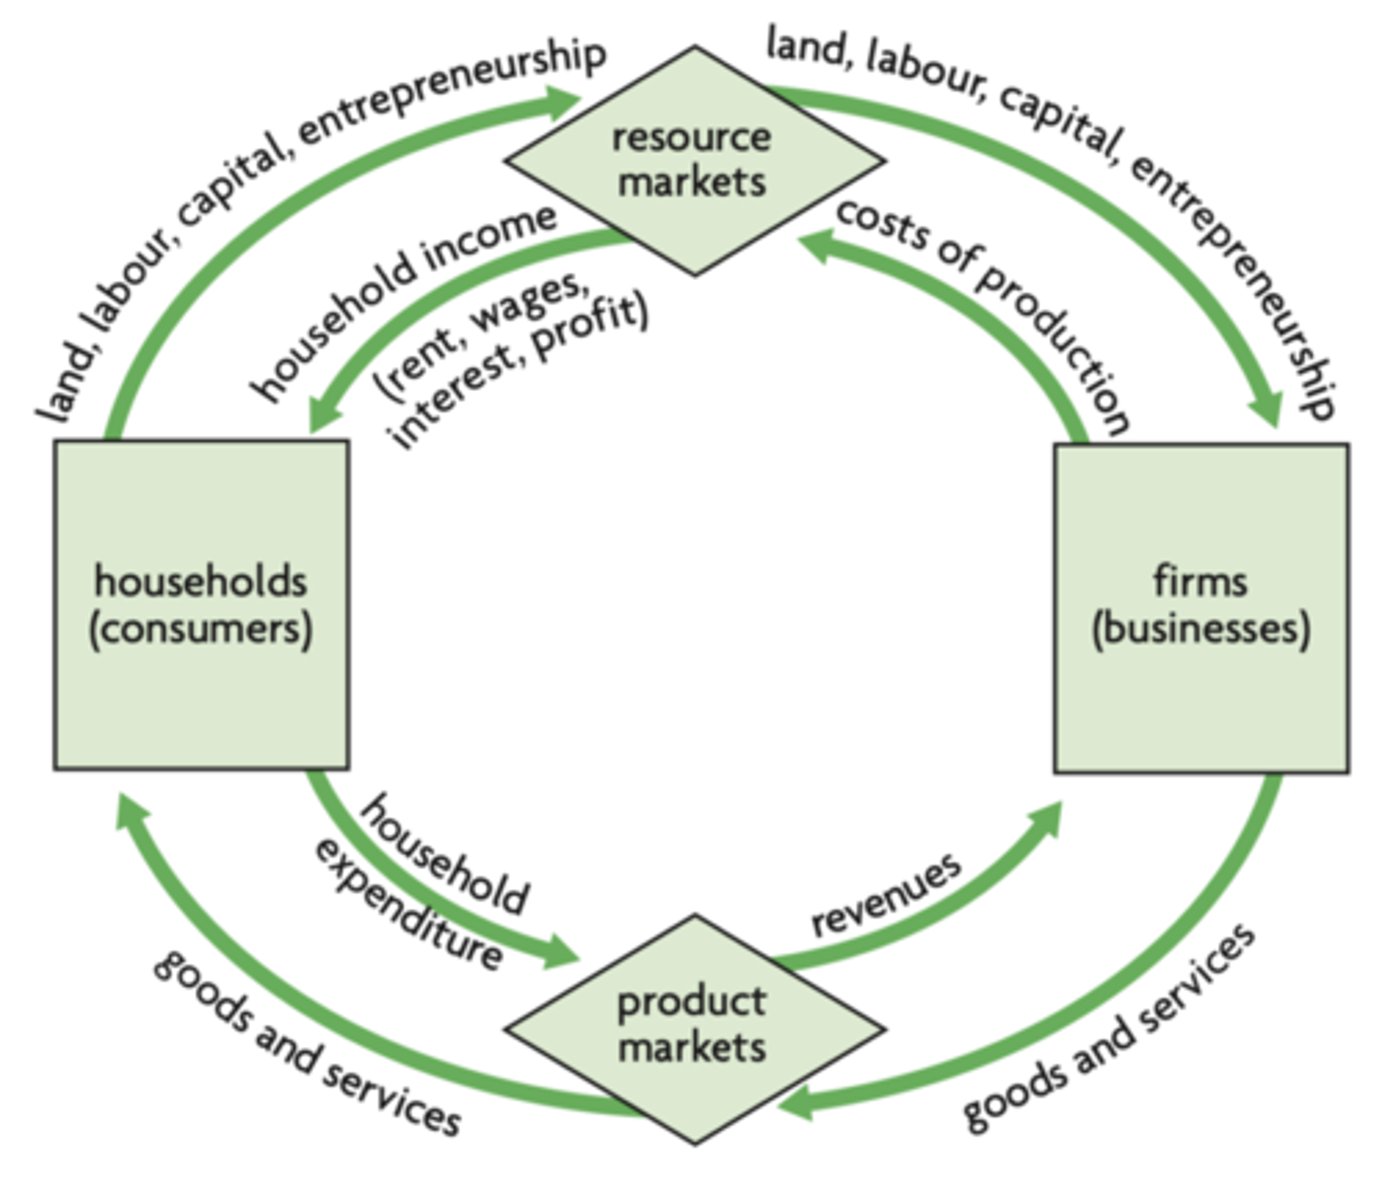
it shows that in any given time period (a year), the value of output produced in an economy is equal to the total income generated in producing that out, which is equal to the expenditures made to purchase that output.
What does the circular flow of income show (closed system)?
that the value of a nations nation is not necessarily equal to the nations income. Circular flow model changes depending on relative sizes of these injections and leakages
What does the circular flow model (with leakages and injections) demonstrate?
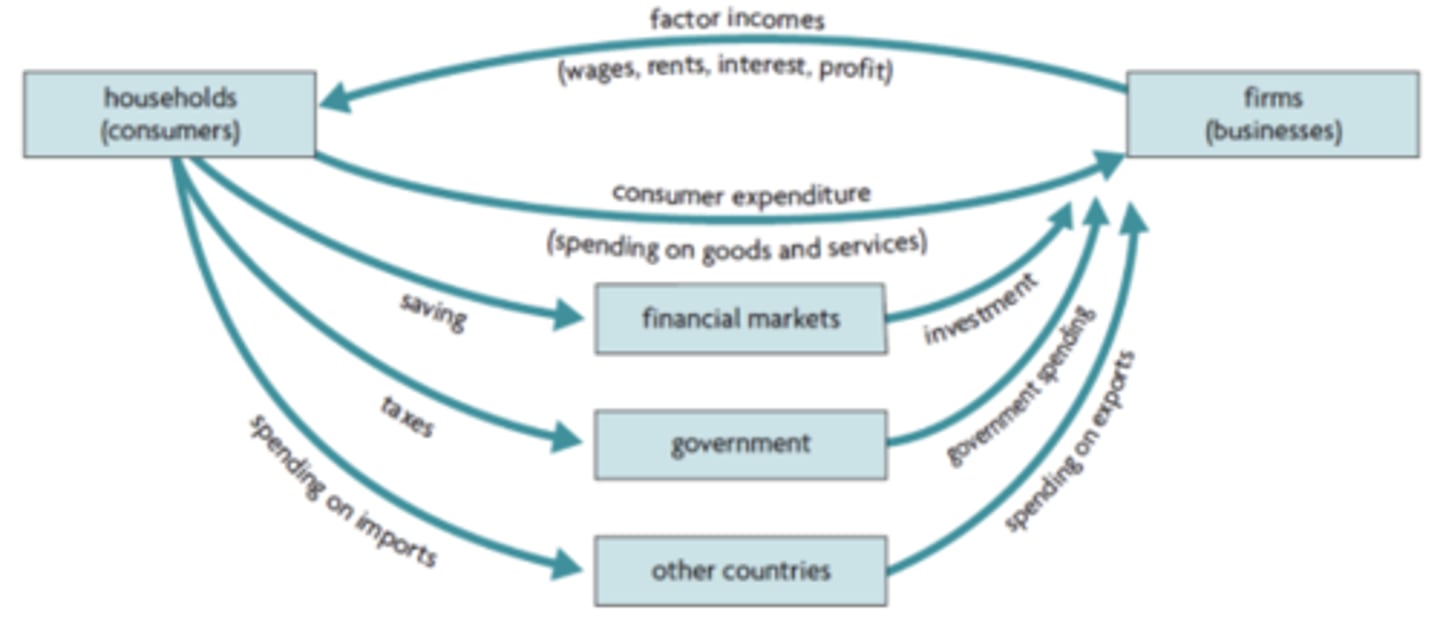
An economy open to international trade - imports and exports
what is an open economy?
the output of an economy, also called aggregate output which is total output
national output
economy's national income or the value of output
national income accounting
1 - assessment of an economy's performance over time (are output and income increasing or decreasing?)
2 - making comparisons of income and output performances with other economies
3 - establishing basis for making policies to meet economic objectives
why is it useful to know national income and value of output? (3)
Expenditure approach, Income approach, Output approach
what are the 3 ways of measuring national output/income?
adding up all the spending on final goods and services produced within a country over a period of time (usually a year)
What is the expenditure approach?
adding up all the income earned by the factors of production that produce all goods and services within a country over a time period (usually a year)
What is the income approach?
the relative incomes shares of the different factors of production and how they might change over time - comparisons over time and across countries
What information does the income approach offer?
calculating the value of all final goods and services produced in a country over a time period
What is the output approach?
information about the performance of each individual sector in the economy by looking at relative shares in total output we can see changes over time and thus make comparisons over time and across countries it calculates the value of output by economic sector (agriculture, manufacturing, transport, etc)
What information does the output approach offer?
goods and services ready for final use
what does the term "final" refer to?
those inputs purchased for the production of final goods
Intermediate goods
1 - Consumption spending (C)
2 - Investment spending (I)
3 - Government spending (G)
4 - Net exports (Xn or X-M)
What 4 components is the expenditure approach broken down into?
all spending by households on final goods and services
What does consumption spending include?
spending by firms on capital goods and spending on new construction
What does the investment spending include?
spending by the government (national, state, an local). including government spending on factors of production like labor services. also public investments = roads, airports, and buildings
What does government spending include?
includes the value of export revenue minus import expenditure
What do net exports include?
goods and services produced within a country (has to be included in measurement of aggregate output)
Exports (X)
domestic spending in other countries (has to be subtracted from expenditures measuring domestic output)
Imports (M)
The measure of aggregate output known as GDP
What do the 4 components of the expenditure approach make up?
the relative contribution of each component to GDP and how they change over time, to make comparisons over time and across countries
what information does the expenditure approach offer?
GDP = C + I + G + (X-M)
What is the formula for GDP?
the market value of all final goods and services produced in a country over a time period (usually a year)
Gross Domestic Product (GDP)
Total income received by residents of a country, equal to the value of all final goods and services produced by the factors of production supplied by the country's residents regardless of where the factors are located
Gross National Income (GNI)
GNI = GDP + (Income from abroad - Income sent abroad)
Calculating GNI
changes in quantities of output produces and/or changes in the prices of goods and services
What may cause an increase in nominal GDP?
values that are based in prices that prevail at the moment
Nominal values
values that have been adjusted for the effects of inflation/prices changes over time
Real values
a country's total GDP?GNI divided by its population
GDP/GNI per capita
because they tell us about the standard of living for a population. they produce an indication of how much of total output of total income in the economy correspond to each person in the population on average
Why are per capita values better?
GDP/GNI per capita = GDP/GNI / population (divided by)
Calculating GDP/GNI per capita
the amount of a country's currency that is needed to buy the same quantity of local goods and services that can be bought with 1 USD.
Purchasing power parity (PPP)
allows us to make buying power comparison s across countries more accurately
Why is PPP important?
a price index used to convert nominal values into real values. they measure average prices in one period relative to average prices in a base year
GDP deflator
100
What is the value of a GDP deflator in the base year?
nominal GDP is the value of current output valued at current prices while real GDP is the value of current output valued at constant prices (base year)
What does nominal GDP vs real GDP measure?
GDP deflator = (nominal GDP/real GDP) x 100
Calculating the GDP deflator
rGDP = (nominal GDP/GDP deflator) x 100
Calculating real GDP using deflator
take the value of real GDP or GNI in the particular year and divide by the population in that year
Calculating real GDP or GNI per capita
are the short-term fluctuations in the growth of real output, which are the alternating periods of expansion (increasing real output) and contraction (decreasing real output)
Business cycles
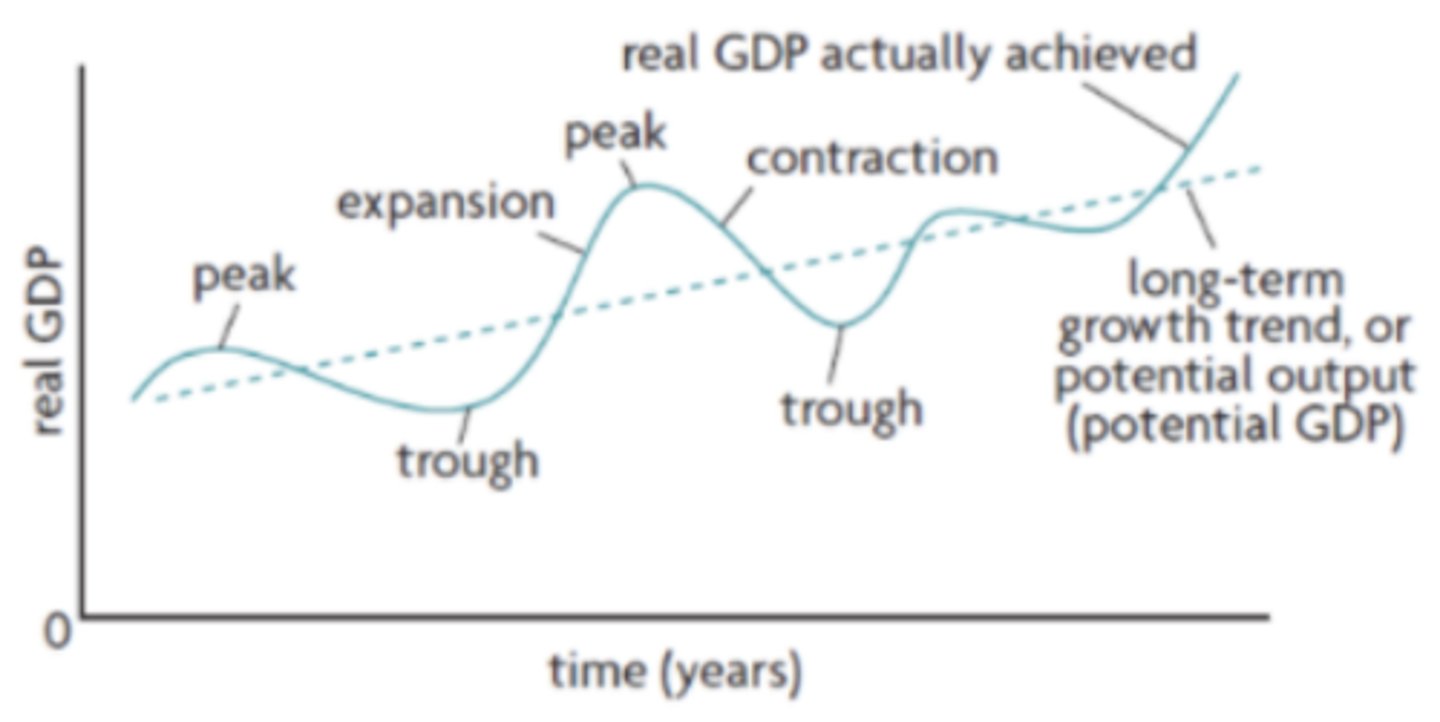
1. Expansion
2. Peak
3. Contraction
4. Trough
What are the 4 phases of the business cycle?
a period when there is positive growth in real output. When real output increases so does the employment of resources and generally average price level
Expansion on a business cycle

the maximum amount of real output. Unemployment will be very low and the economy is likely to be experiencing high inflation
Peak on the business cycle
occurs after peak, real output will fall and if it falls for 6 consecutive months of more it can be categorized as a recession. Unemployment will begin to rise and average prices might start to fall
Contraction on the business cycle

the minimum amount of real output and unemployment is very high during this time. After this there will be another expansion (recovery period)
Trough on the business cycle
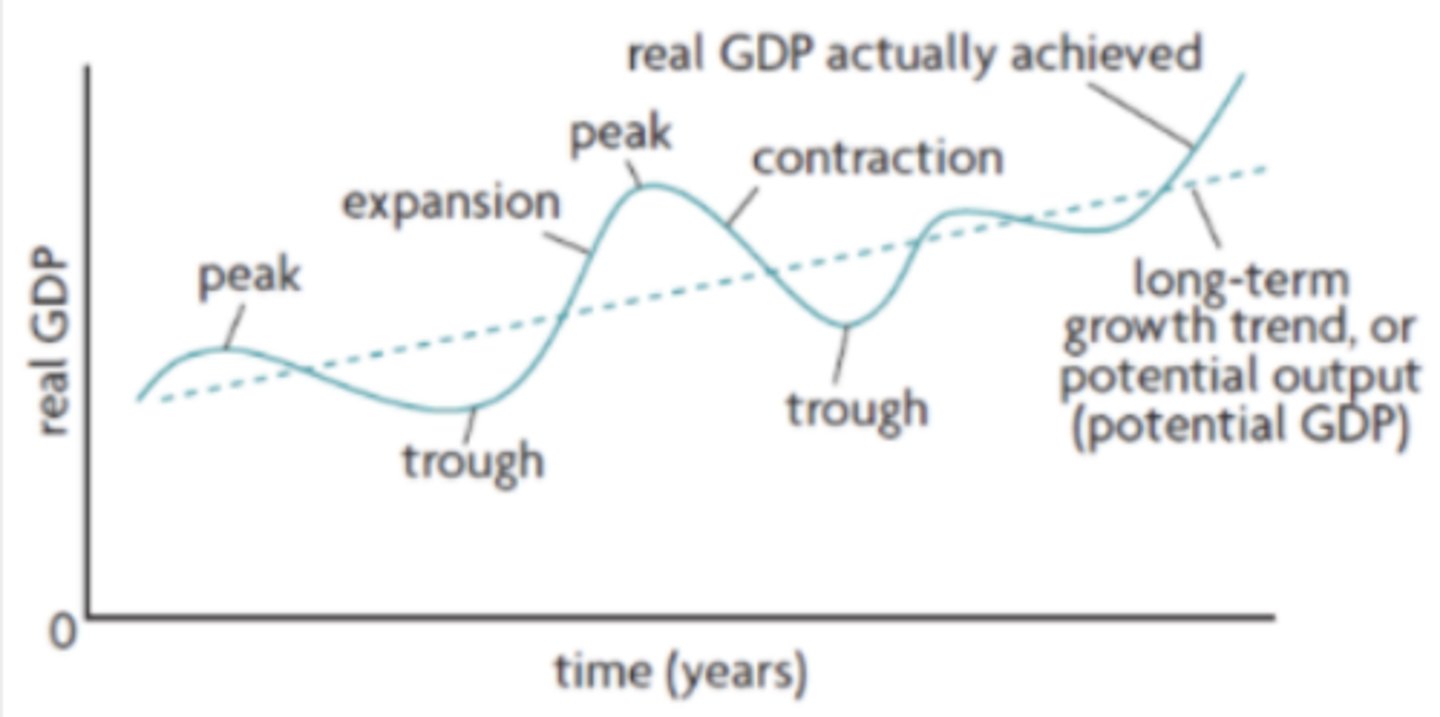
represents the average growth of the economy over a long period of time
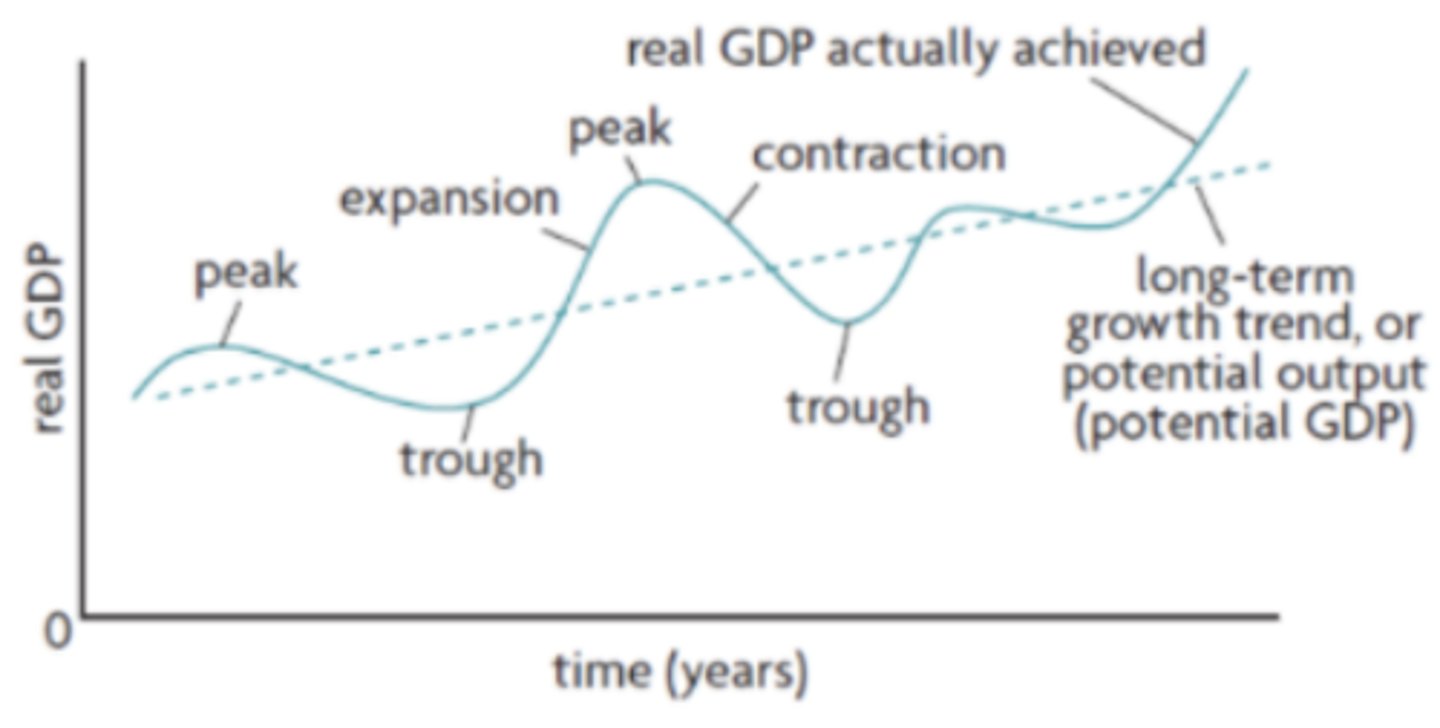
What is the long - term growth trend (in the business cycle)
When real GDP is equal to the long-term growth trend (potential output) this means that all resources including labour are being used to their greatest extent possible but that there is still some unemployment
Natural Rate of Unemployment (NRU)
unemployment is equal to NRU
'Full employment'
- include non-marketed output
- include output sold in underground markets
- take into account quality improvements of goods/services
- take into account the externalities associated with output
- take into account depletion of natural resources
- differ between domestic price levels
Why don't GDP and GNI accurately measure 'true' values of output? (6) they don't...
- make distinctions between the composition of output
- reflect achievements made in the education and healthcare sector
- provide information about the distribution of income/output
- take into account increased leisure
- account for quality of life factors
Why can't GDP and GNI accurately measure economic well-being (5) They don't...
real values of income and output measures as they take into account changes in price levels over time. However, increase in real GDP for some percentage of a certain country maybe overestimate or underestimate the true changes in the populations economic well being because of factors such as improved product quality, improvements of healthcare and education, etc.
What is needed to make comparisons of national income and economic well being over time?
due to the inability of GDP and GNI to measure true value of output, the validity of International comparisons is limited
Comparisons of national income and economic well being between countries
OECD better life index, happiness index, happy planet index
What are alternative measures of well-being?
an index based on a number of factors that the member countries themselves selected as factors that make a better life
What is the OECD better life index?
State of health, jobs and earning, education and skills, work-life balance, housing, personal security
What are some indicators of the OECD better life index ? (6)
created by the United Nations Sustainable Development Network and includes measurements that try to quantify and measure happiness
Happiness Index
real GDP per capita, social support, freedom to make life choices, generosity
What are some indicators that are a measure of the Happiness index (4)?
created by the New Economics Foundation and is a measure that attempts to quantify sustainable well-being.
Happy Planet Index (HPI)
life expectancy, well being, inequality of outcomes, ecological footprint
What are some indicators as a measure of the happy planet index? (4)