Unit 8 - Carbon Cycle and Climate Change
1/47
There's no tags or description
Looks like no tags are added yet.
Name | Mastery | Learn | Test | Matching | Spaced | Call with Kai |
|---|
No analytics yet
Send a link to your students to track their progress
48 Terms
“Climate Change is Hydrologic Change”
US Forest Service summarized the issue several years ago
Document titled
“Climate Change is Hydrologic Change”
Climate change: Known effects on hydrology
Greater snow cover in highest elevations but less at lower elevations
Earlier spring runoff
Reductions on low flows
Higher water temperature
Flooding
Drought
Projections based on three main aspects of Climate Change and hydrology
Due to warmer air temperature
Due to changes in precipitation patterns
Lower winter precipitation at lower latitudes
Higher precipitation at higher latitudes
Due to greater variability in precipitation from year to year
Projections of climate change: due to warmer air temperature
Decreases in snow
Faster and earlier snowmelt
Increased ET, primary productivity, water temperatures
Rising sea levels
Increased coastal erosion and saltwater intrusion
Changes in aquatic habitat and biota
Amount, type, quality, and distribution
Change in water availability
For recreation and cultural experiences
Lowered water quality
Decreased function and operation of existing water
Infrastructure in coastal areas
Projections of climate change: due to changes in precipitation patterns
Lower winter precipitation at lower latitudes
Decreased snow
Changes in streamflow timing
Increased risk of disturbance
Drought, wildfires, insects, disease
Decreased vegetation growth
Changes in species composition
Reduced water supplies
Increased water demand
Increased GW withdrawals
Decreases in fisheries
Decreases in water-based tourism
Higher precipitation at higher latitudes
Increased streamflow
Changes in vegetation growth and species composition
Increased soil erosion and landslides
Increased freshwater supplies
Increased improvements in warm water fisheries
Projections of climate change: Due to greater variability in precipitation from year to year
Increased variability in stream, lake, and riparian habitats
Increased risk for aquatic and riparian species extirpation
Increased soil erosion and landslides
Increased stream and lake sedimentation
Increased uncertainty in water supply
Increased risk to aquatic habitat and water supply infrastructure
Signs of a healthy, resilient watershed – ones that rebound after disturbance and continue to provide ecosystem services
has the capacity to:
Capture and store rainfall
Recharge ground water reservoirs
Minimize erosion losses
Protect soil quality
Sustain and regulate stream flows
Store and recycle nutrients
Support natural riparian and floodplain functions
Provide habitat for native aquatic species
Resist and recover quickly from floods, fire, insect outbreaks, and other extreme events
how do we get to a healthy watershed?
Active management for resilience and enhancing ecosystem adaptability needs to:
Restore meadows, wetlands, and floodplains
To improve natural storage, reduce flood hazard, and prolong seasonal flows
Protect and restore riparian forests
To moderate changes in stream temperature
Remove migration barriers, reestablish habitat connectivity
To help species adapt to changing conditions
Reduce flood and wildfire risks in vulnerable watersheds
To prevent erosion and maintain clean water supplies
Improve or decommission roads
To reduce adverse impacts during large storms
All the Forest Service’s recommendations address water
(which has been our focus since the first class)
But they never addressed Carbon directly...
With the increasing importance of Climate Change
Future management will involve Carbon
Either directly managing for Carbon
Or a consideration of Carbon produced
And its potential impacts
Does watershed management conflict with Carbon management?
Watershed management and carbon management are not in conflict but rather are complementary.
They can work together to achieve multiple benefits, including food security, climate adaptation, and climate mitigation.
Carbon sequestration is a key component of watershed management, as it helps replenish soil organic matter, improve soil structure and stability, and reduce soil erosion.
It also enhances soil biodiversity, nutrient holding capacity, nutrient use efficiency, water holding capacity, crop yields, and profitability.
By implementing sustainable land management practices, such as afforestation and land preparation, carbon sequestration can be effectively achieved and maintained.
Primary compounds responsible for climate change
CO2 – Carbon Dioxide
80% (based on EPA, 2019)
CH4 – Methane
10%, but 25 times greater impact than CO2
Movement and Cycling - ”Carbon Cycle”
Process in which carbon atoms continually travel from the atmosphere to the Earth and then back into the atmosphere.
Yellow – fluxes Units – gigatons/year
White – stored amounts
Red – human additions


Terrestrial portion
Natural Balance (without human additions)
120 gigatons/year in atmosphere
due to photosynthesis
60 – plant respiration
60 – soil microbial respiration and decomposition
Note the importance of soil
Hear about using plants as Carbon sink
Should also be using soil as Carbon sink
2,300 vs. 550
Soil Health is critical
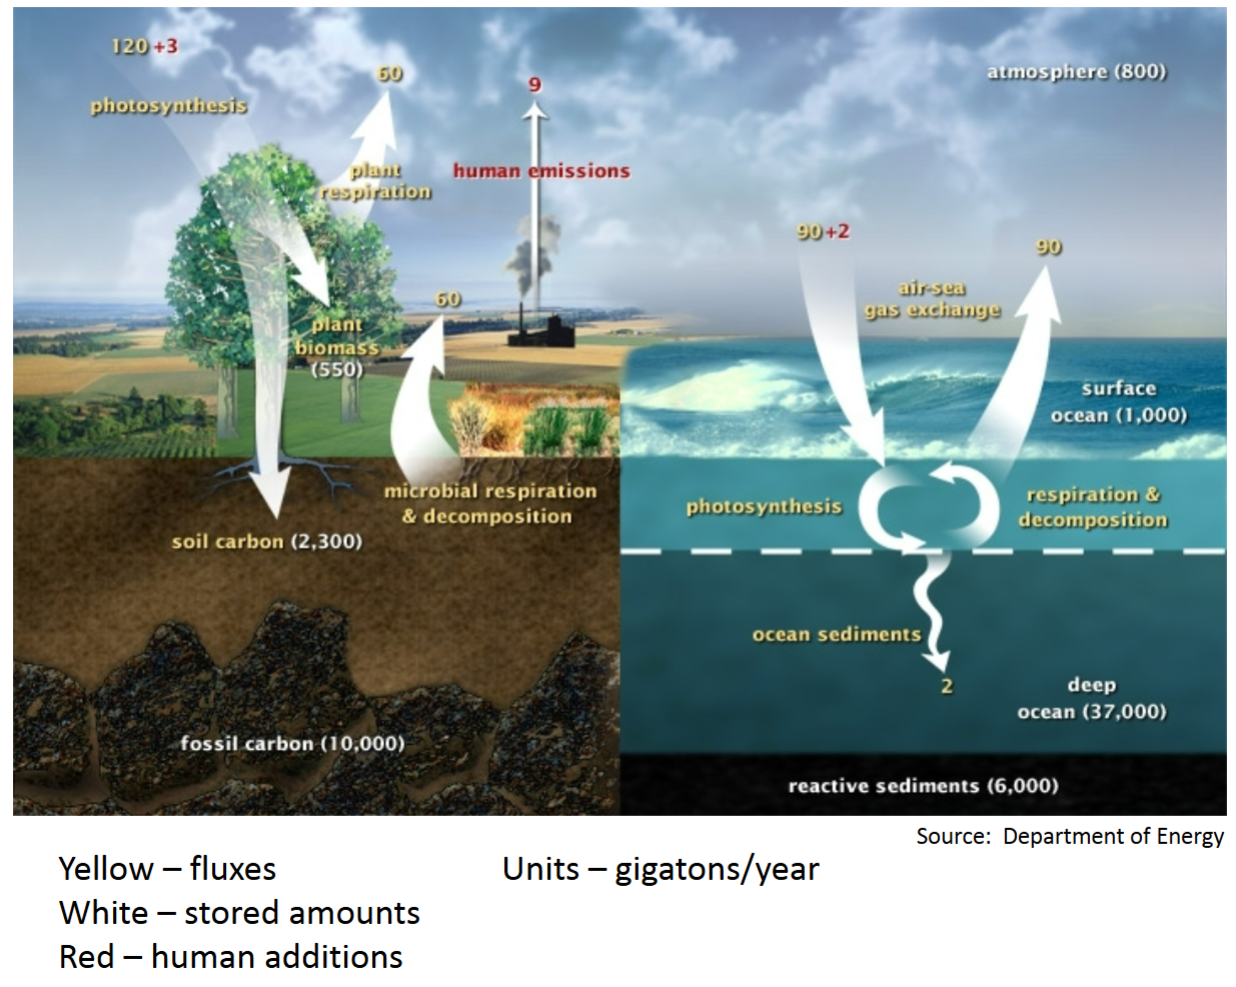
Ocean portion
Natural Balance (without human additions)
90 gigatons/year exchanged
Compare stored amounts
vegetation 550 GT/yr
soil 2,300
atmosphere 800
ocean surface 1,000
deep ocean 37,000
fossil 10,000
“Blue Carbon”
Term for Carbon captured by oceans and coastal ecosystems
Two main carbon cycles
slow carbon cycle
fast carbon cycle
Slow Carbon Cycle –
geological time frames
10-100 million tons annually
Fast Carbon Cycle –
annually
1,000-100,000 million tons annually
in contrast of carbon cycles, human emissions give off
1,000 million tons annually
Slow carbon cycle cycles between
rocks, oceans, and the atmosphere
Complete cycle - between 100 and 200 million years
Starts with chemical weathering of rocks
Rainfall is slightly acidic
pH of 5.6 for clean rain
4.2 for acid rain
carbonic acid
dissolves rocks, releasing C
C carried by streams and rivers to the oceans
Slow carbon cycle in oceans
C is taken up by organisms (i.e., corals and plankton)
forms calcium carbonate
Organisms die and remains fall to seafloor
Over time
buildup of dead creatures
80% of buildup
sediments form limestone
20% of buildup - in mud
forms sedimentary rocks like shale
Slow carbon cycle - carbon returning back to the atmosphere
Volcanoes
tectonic plates slide over one another
Heat forms silicate minerals
with CO2 gas formed
erupt
CO2 gas is released
how much is released?
normally, we think not much
But – 130-380 million tons/yr
If the slow carbon cycle is out of balance
increase of CO2 in atmosphere
-> rise in temperature
-> increase in rainfall
-> dissolves more rock
-> moreCarbonon seafloor
-> reducedCarbonin atmosphere
-> reduced temperature
result is natural feedback process
scale of 100,000-200,000 years
fast carbon cycle is cycling of
Carbon through living organisms
1,000-100,000 million tons/year
Primary components
Plants
Phytoplankton
Since closely tied to plants, you can see the change annually
Fast carbon cycle - in august, peak of
growth in the Northern Hemisphere and peak draw down of Carbon
Followed by plant death and decomposition
respiration returns Carbon to the atmosphere and the return of Carbon to prior levels
Fast carbon cycle -
August
growth in N Hemisphere
(more green than Dec.)
December
growth in S Hemisphere
(summer down under...)
Photosynthesis
CO2 + H2O + sun’s energy = CH2O (sugar) + O2
Respiration
CH2O (sugar) + O2 = CO2 + H2O + energy released
CO2 goes into the atmosphere
Reminder:
1. Plants respire
2. Animals eat plants and respire
3. Death of plants and phytoplankton
4. Fire
human induced changes relative to watersheds - humans tend to cut forests
and replace with crops or pasture
which store less Carbon
also exposes soil to Carbon loss
exacerbating the problems
human induced changes relative to watersheds - with increase in atmospheric Carbon
increased plant growth
called ”Carbon Fertilization”
models show 12-76% increase
if levels in atmosphere double
however, other factors may be limiting
water, light, and nutrients
human induced changes relative to watersheds - freshwater lakes and streams
Studies in Germany
pH dropped 0.3 in the last 35 years
Rate is 10 times faster than oceans
Appears freshwater absorbs CO2 differently than oceans do
CO2 increased steadily during that time
Freshwater crustaceans (Daphnia, or water fleas) were less likely to evade predators
Appears this is a result of changes in CO2 in water rather than pH
Managing Carbon on a Watershed
You are probably not able to:
Control fossil fuel emissions
Promote use of electric vehicles
Convert to renewable energy sources
...and a thousand other steps to manage C...
What you can do to manage carbon:
Tie-up Carbon in the landscape
Vegetation
Healthy Soil
Permafrost
Reduce Carbon losses
Erosion control
Agricultural processes
Reduced tillage/no tillage
Addition of organic matter
Use of cover crops
Erosion Control and Carbon
Some authors claim that erosion will result in a Carbon sink
Erosion leads to
deposition of soil
deposition of organic matter
...resulting in vegetative increases
...and thus, greater Carbon storage
Other studies have included a wider range of ecological processes
Concluded the opposite
increased Carbon emissions
Positive feedback
Climate change produces larger rainfall events
...leading to more erosion
...leading to more Carbon emission
...leading to more large rainfall events
...and on and on...
Objective 1 – maintain or increase water yield
Seems to conflict with managing C
Increasing vegetation for C
increased losses – Interception and Transpiration
But
probably decrease runoff
increase infiltration
greater recharge (which is a form of water yield)
Wildcard are extreme events
increase in intensity and number
vegetation can help mitigate some impacts
can capture some of the water (in reservoirs, etc.)
IF you plan appropriately
Objective 2 – maintain or improve water quality
Increased soil health will aid water quality
Increased vegetation will aid water quality
Slow down runoff
Decrease erosion
Increased filtering of pollutants
Shading effects, and increased DO
Except for extreme events
Will tend to decrease water quality
Vegetation and soil health - mitigate
Objective 3 – regulate stream flows (timing)
Vegetation increases will have two benefits
Runoff will be reduced
...except for extreme events
Greater recharge potential
aid in low stream flows
Objective 4 – control excessive soil erosion and excessive runoff
As with Objective 2, increased vegetation and improved soil health will help
Rutgers University and New Jersey Climate Adaptation Alliance - multiple actions that can be taken
1. Disconnect impervious cover
Eliminate surfaces that are not necessary
Reduce or convert impervious surfaces
Disconnect impervious surfaces from flowing directly to waterways
Rutgers University and New Jersey Climate Adaptation Alliance - multiple actions that can be taken
preserve and restore wetlands and marshes
Effective barriers against flash floods and sea level rise
Filter pollutants
Slow flood flows
Help to prevent erosion
Support biodiversity
Rutgers University and New Jersey Climate Adaptation Alliance - multiple actions that can be taken
Design green infrastructure tools to treat a higher capacity
Rain gardens
Tree trenches
like a rain garden for trees
Stormwater planters and bioswales
Pervious (permeable) pavement
Rain barrels
Rutgers University and New Jersey Climate Adaptation Alliance - multiple actions that can be taken
Restore streams and their floodplains
Daylighting streams previously buried in pipes or culverts
Restoring channelized streams to natural flow patterns
Rutgers University and New Jersey Climate Adaptation Alliance - multiple actions that can be taken
Reestablish aquatic habitat connectivity by removing migration barriers
Convert pipe culverts to bottomless arch culverts or bridges
Replacing narrow culverts with wider openings
Increases carrying capacity during storm events
Rutgers University and New Jersey Climate Adaptation Alliance - multiple actions that can be taken
Maintain riparian buffers along waterways
yeah!
Rutgers University and New Jersey Climate Adaptation Alliance - multiple actions that can be taken
Plant tolerant native species and manage the spread of invasive species
More tolerant of inundation for a few days
Withstand warmer climates
Withstand more variable precipitation
Rutgers University and New Jersey Climate Adaptation Alliance - multiple actions that can be taken
set up a monitoring program
Identify key indicators and their critical levels
Water levels, fish stocks, wetland coverage, stream temps, nutrient loads, bacteria, stream flow...
Maintain good data on existing conditions and trends
Allows managers to be more sensitive and to adapt quickly
Periodically reevaluate management practices and indicator targets
Rutgers University and New Jersey Climate Adaptation Alliance - multiple actions that can be taken
partner with local governments to revise land use ordinances
Assess land use, zoning, and other ordinances
Revise municipal regulations to encourage practices that enhance watershed protection
Open space preservation
Clustered development
Promote natural recharge and reductions in runoff
Rutgers University and New Jersey Climate Adaptation Alliance - multiple actions that can be taken
Educate the public on demand management and water supply protection strategies
Reduce personal water usage
Protect groundwater
High efficiency fixtures
Native plants for lawns
Require minimal irrigation, pesticides, and fertilizers
Redirecting downspouts to permeable surfaces