3 - Correlation and multiple regression
1/32
There's no tags or description
Looks like no tags are added yet.
Name | Mastery | Learn | Test | Matching | Spaced | Call with Kai |
|---|
No analytics yet
Send a link to your students to track their progress
33 Terms
What is correlation?
An association or dependency between two independently observed variables
e.g., cloud cover correlates with probability of rainfall
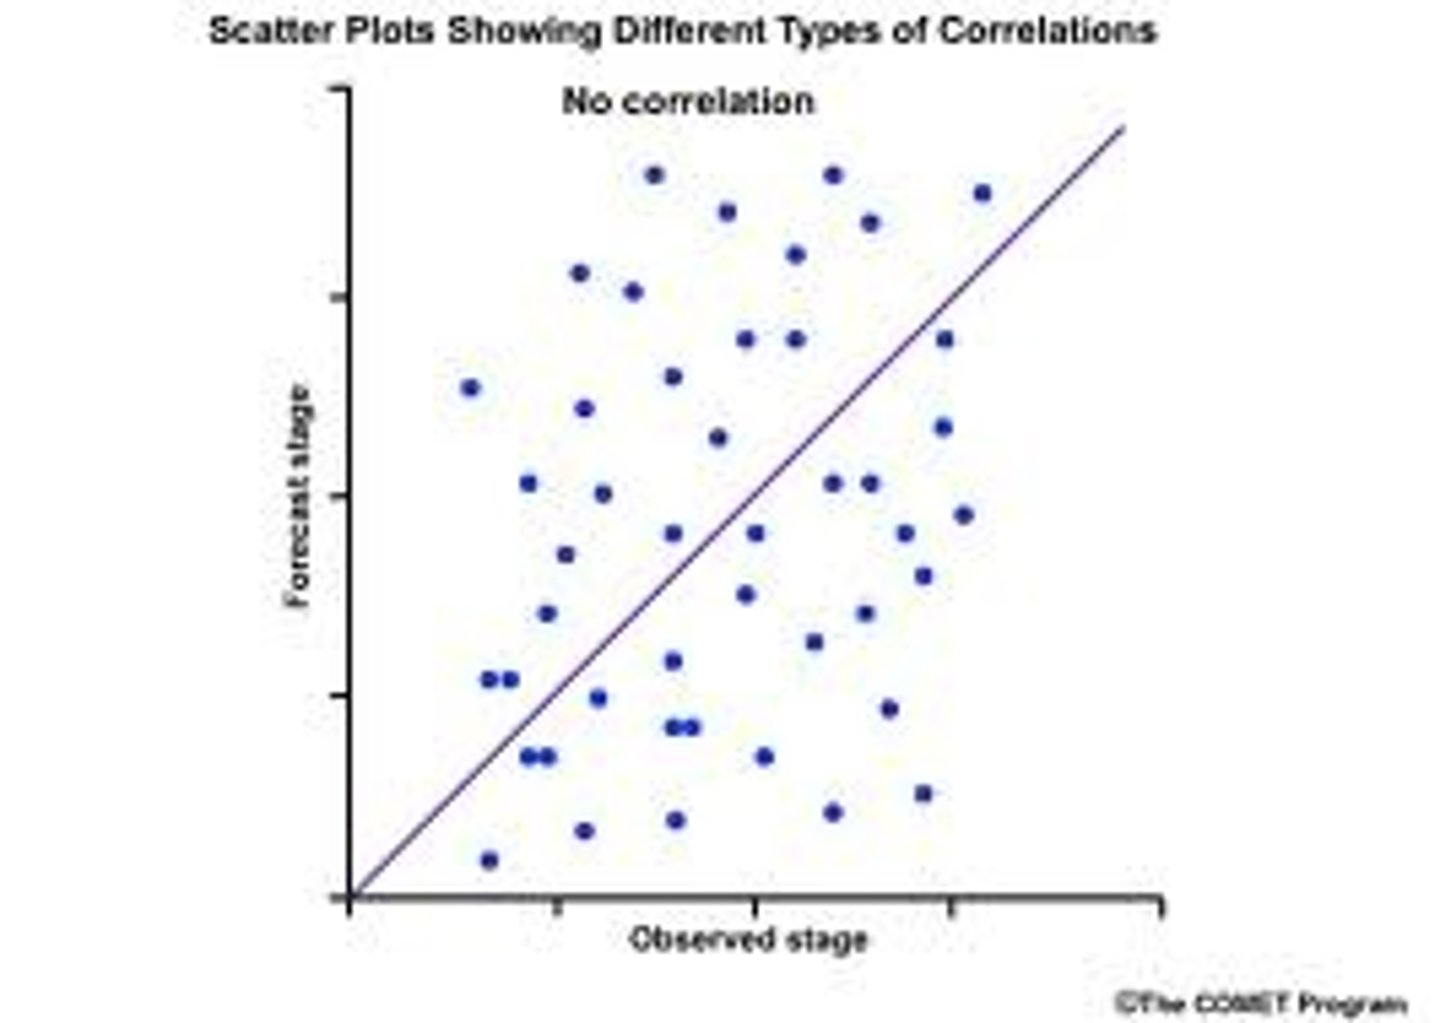
We can use a scatterplot to visualise a correlation, where each point represent a participant
What is the analysis of correlation?
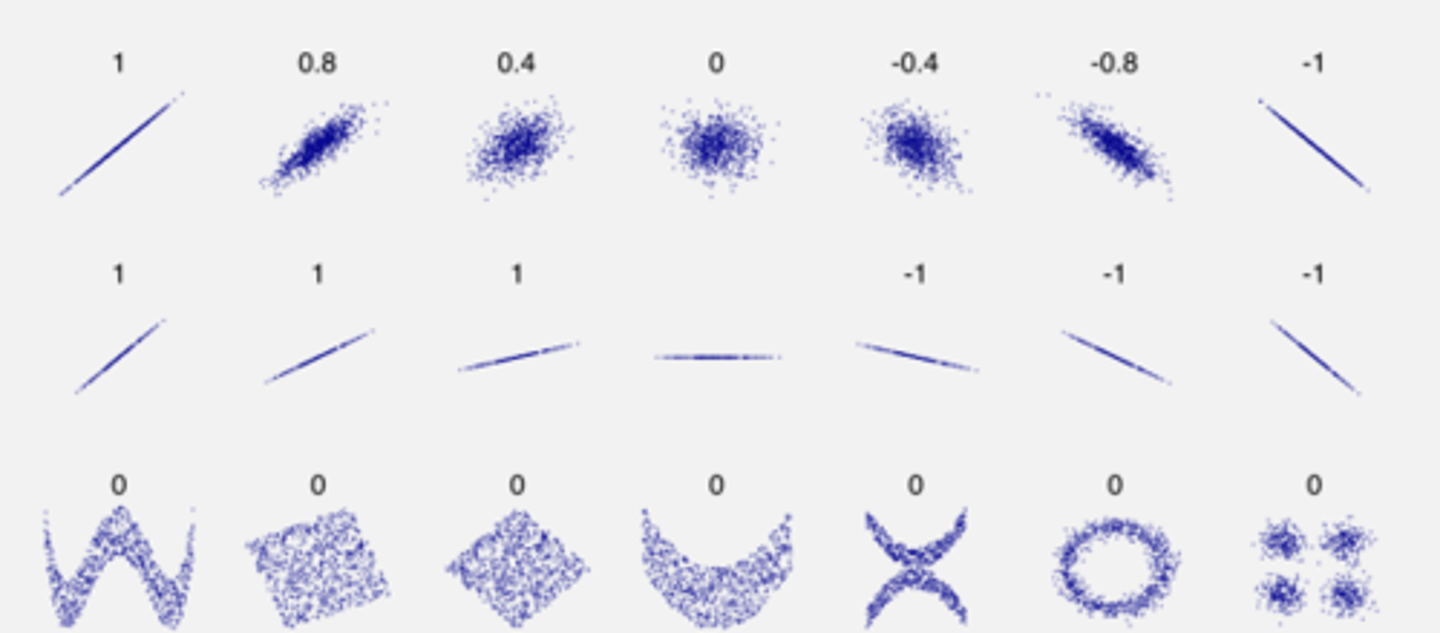
Scores should be: 0.0 when X and Y are completely independent of each other, 1.0 when they are identical to one another and -1.0 when they are exactly inverse to one another
One such score is called the Pearson correlation coefficient
What is the basic statistical question for correlation?
How strong is the association between X and Y?
What are some examples of Pearson's coefficients?
Slope is completely irrelevant for the strength of the correlation, there are also other more complex relations in nature
What are the measures of association?
Look at onenote 3 -correlations
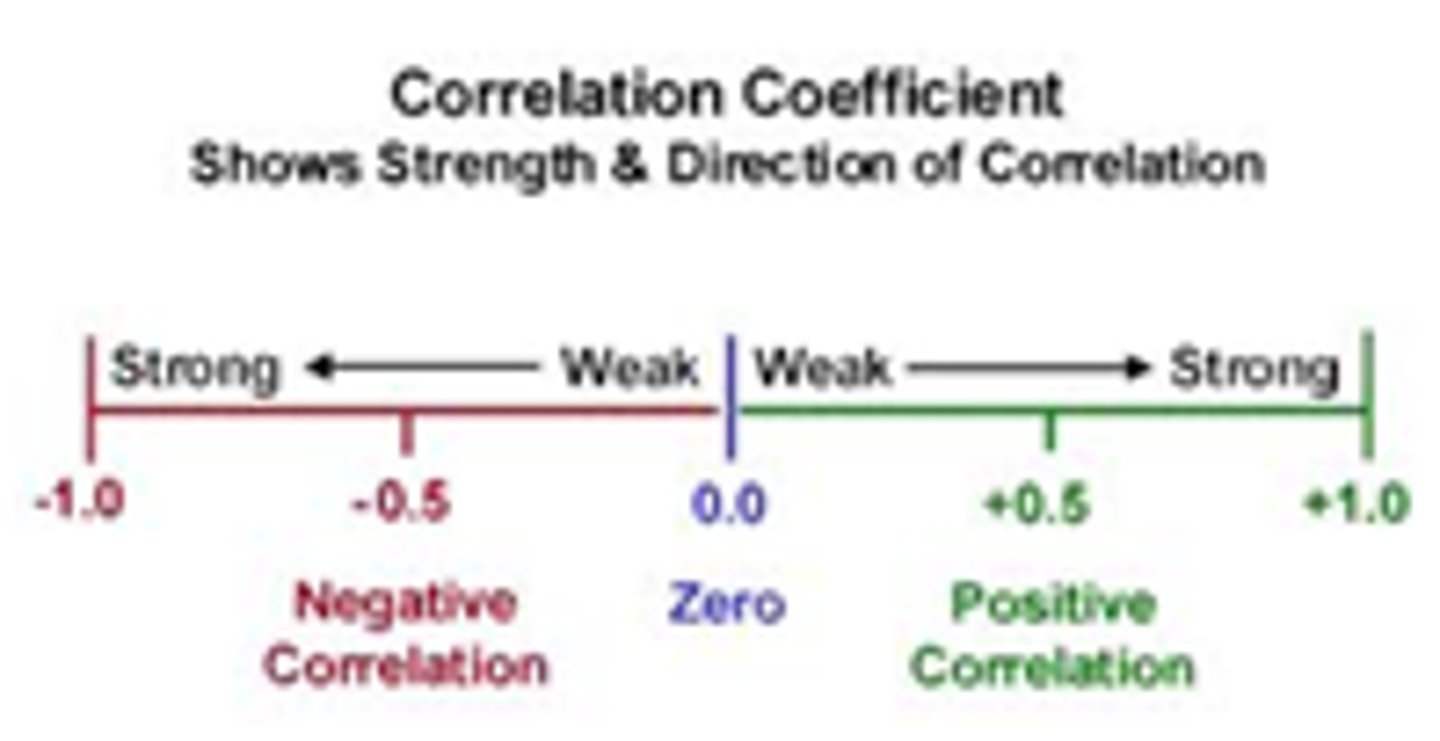
What is a correlation-coefficient?
Represents the strength of the statistical relationship between variables, does NOT represent the slop
What is regression-coefficient?
Represents the slope of the effect of one variable on the other, doesn't represent the statistical meaningfulness of the effect, Regression goes beyond correlation - allows the prediction of one variable based on the other
The slope also naturally depends on the relative scales of ear variable, whether they range e.g., from 0.1 to 0.6
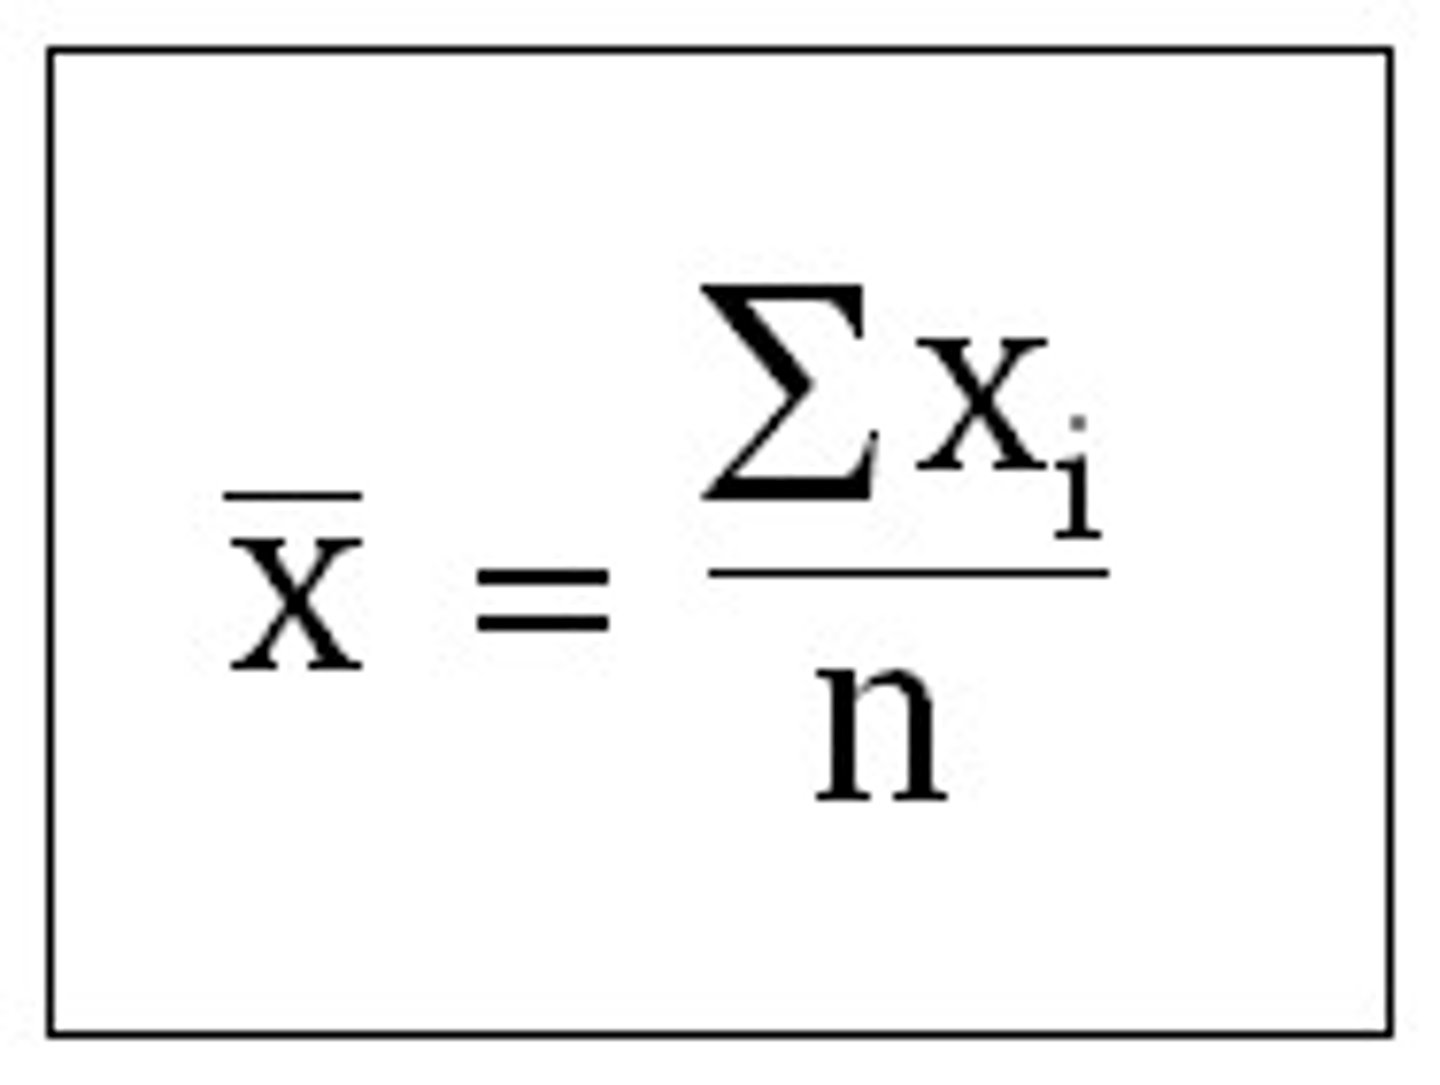
What is the arithmetic mean formula?
Sum up all the individual elements of the variable and divide them by the number of elements
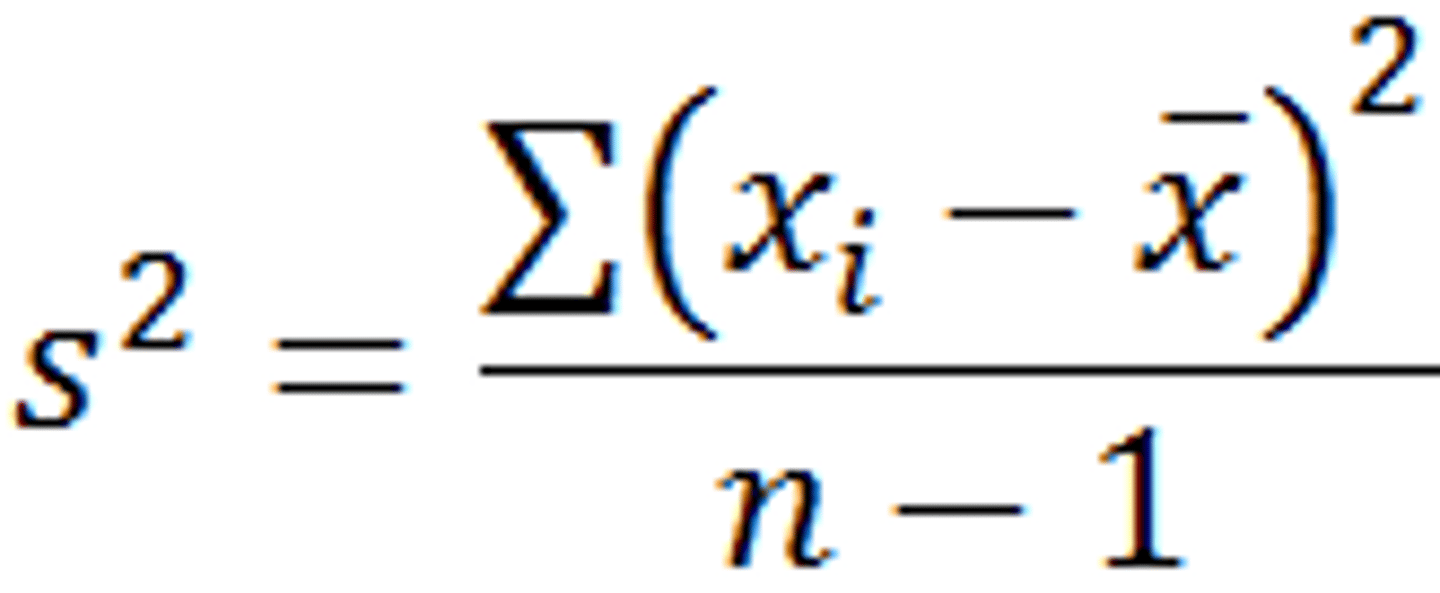
What is the variance formula?
subtracting the measurements of each observation of each participant in the sample from the sample mean, square it, sum it up and divide by the df
What is the standard deviation
formula?
S = √Σ (x-x̄)^2/(n-1)
x - data points
x̄ - mean
n - number of values
(square root of variance)
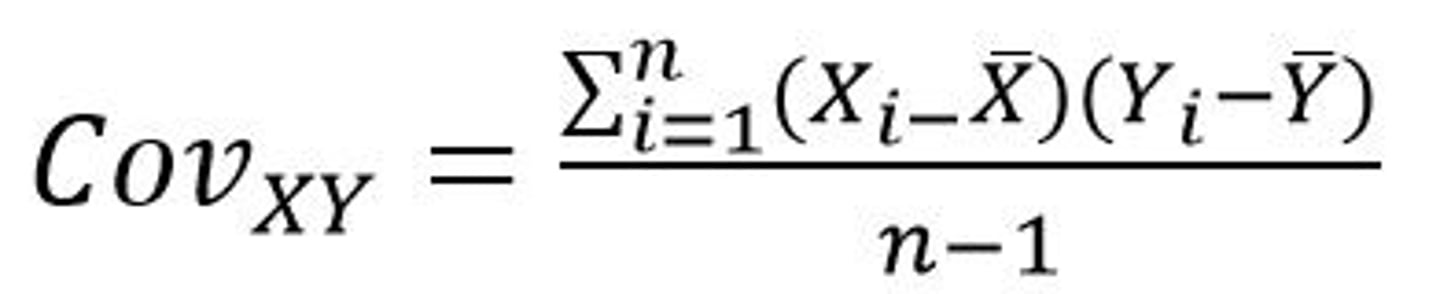
What is the covariance formula?
Change the square in variance formula and replace it with the other variable, multiply differences of each element from the mean of its own variable, sum it up and divide by df, the more similar the two elements are of the product the greater the variable, the more similar the values of variables x and y are the greater the covariance
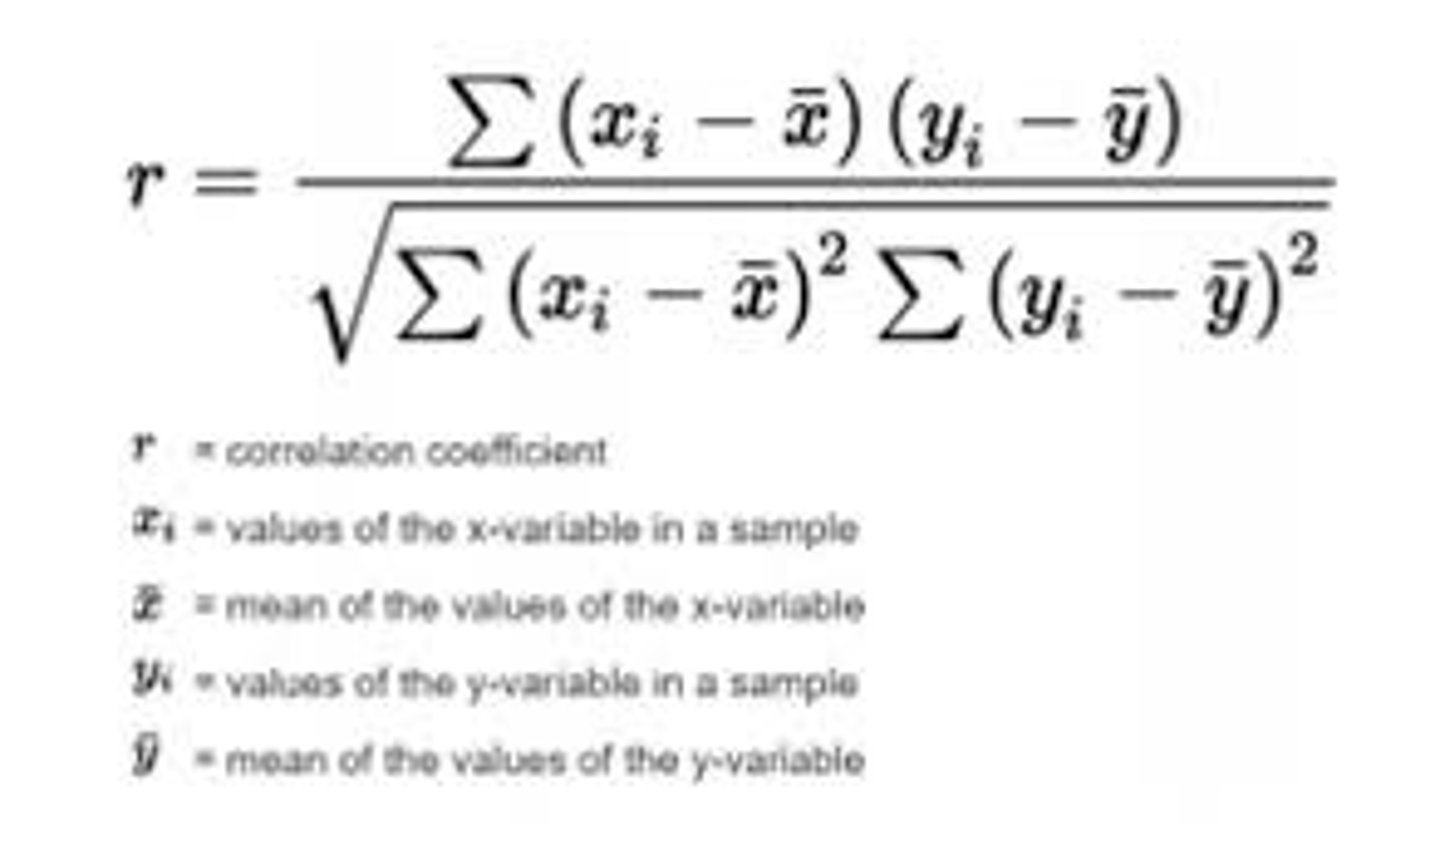
What is the correlation formula?
Divide the two sums of variables by their SD
Why linear regression?
When plotted the regression produces a line (the parameters to allow us to draw the regression line)
What is a simple line equation?
y = ax + b, where a is the slope and b is the y-intercept (where regression line cuts through Y)
Also equivalent to:
What is residual error?
Difference between observed and predicted values. (also prediction error) regression line is drawn so the distance between points and line is minimised
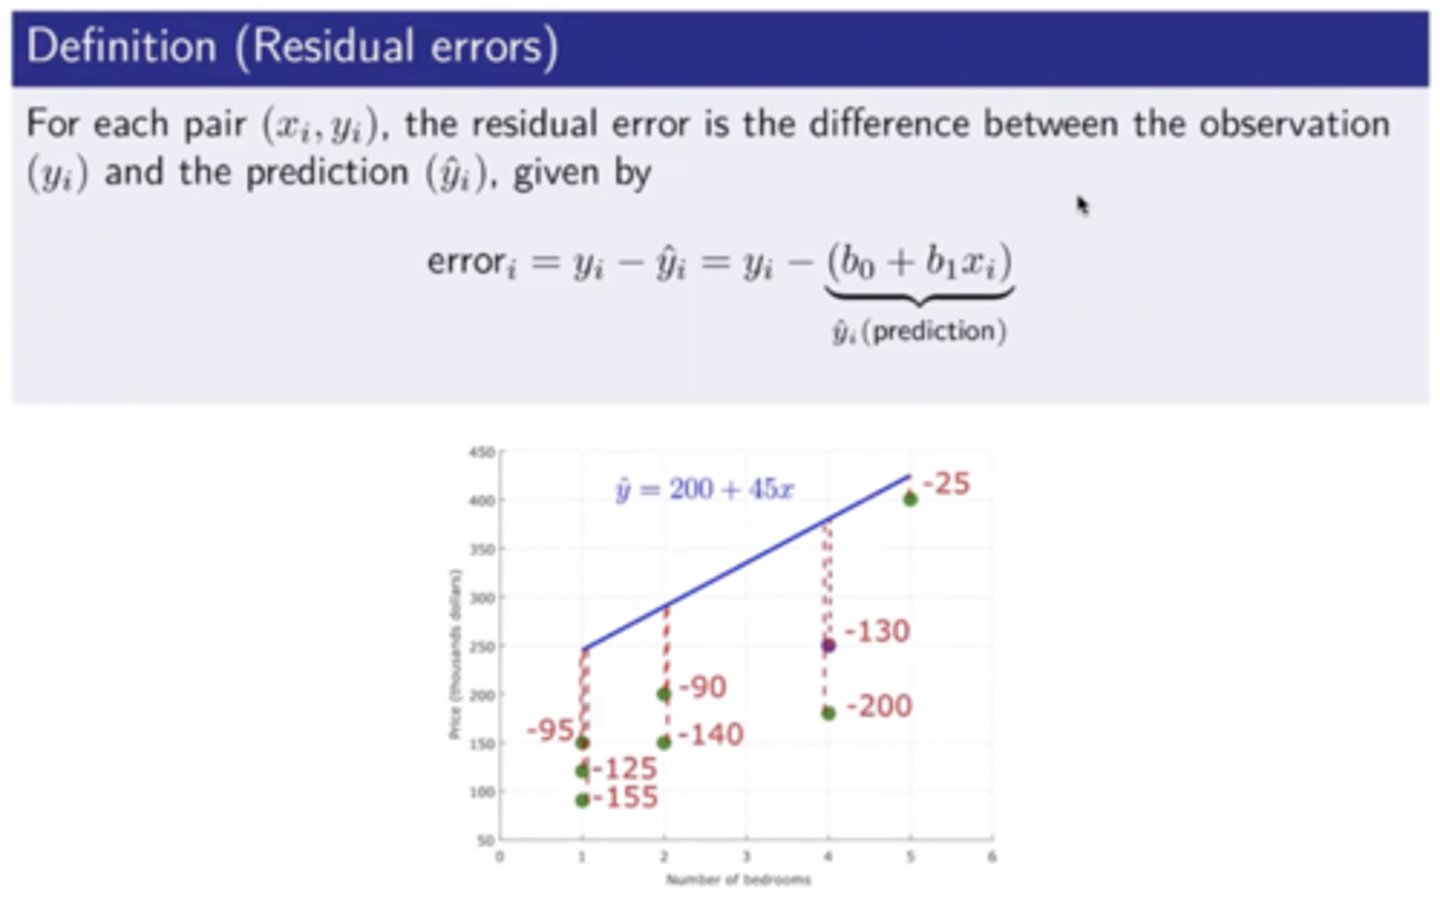
What is the goal of regression analysis?
To find parameters for the slope and intercept to minimise the sum of all of the errors
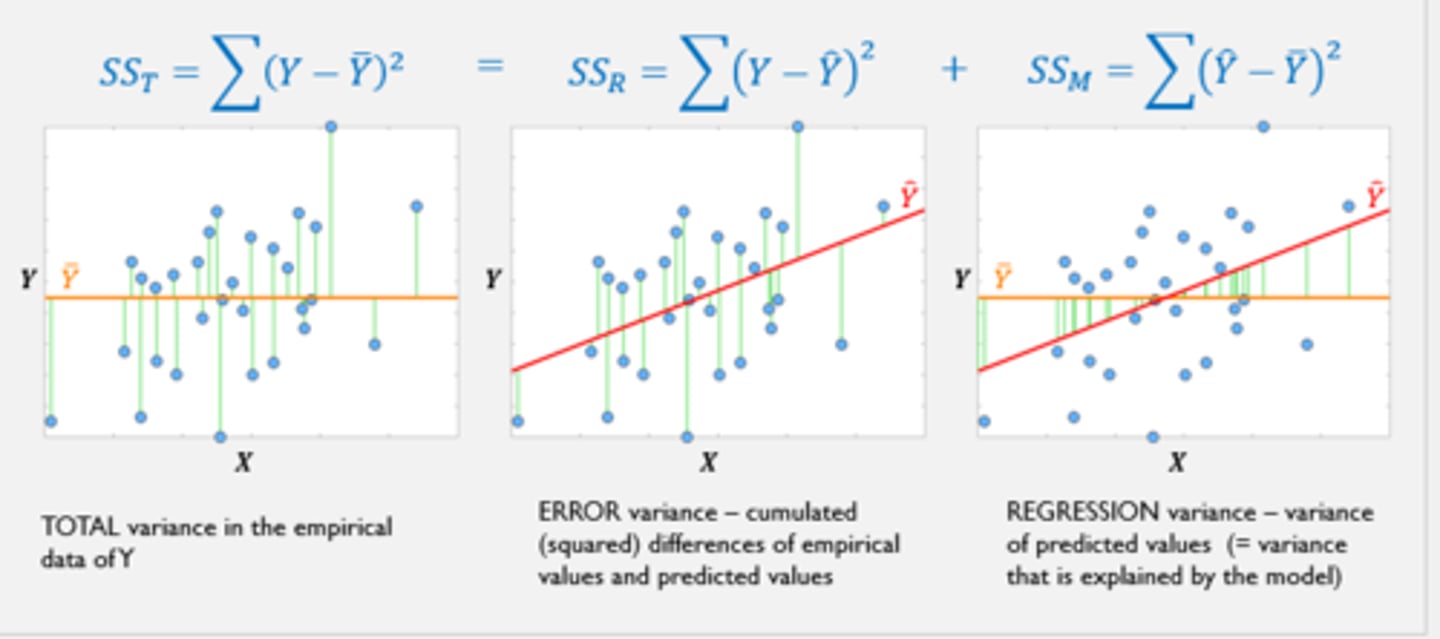
What is the total variance?
1. Orange line = mean of sample on the variable of Y Look at differences of all individual empirical values from this mean and square them and sum them up is the total variance in the empirical data of Y

What is the error variance?
Y-hat expresses the predicted values of y on the basis of our regression equation Look at each differences of empirical values and predicted values (empirical values - predicted values) Residual variance (or residual sum of squares)

What is the regression variance?
Model variance (explained variance/ regression variance) Variance of predicted values (= variance that is explained by the model) Looking at predicted individual values in the dataset and subtract from the empirical mean in the variable, and then square and sum it up
What is prediction error?
𝜺 is the difference between actual values Y and predicted values Y^
What is the objective for a regression model?
To find the best fit between the model and observation, by adjusting the values of B_i until the prediction is minimised, we can express this as a residual sum of squares
What is the residual sum-of-squares formula?
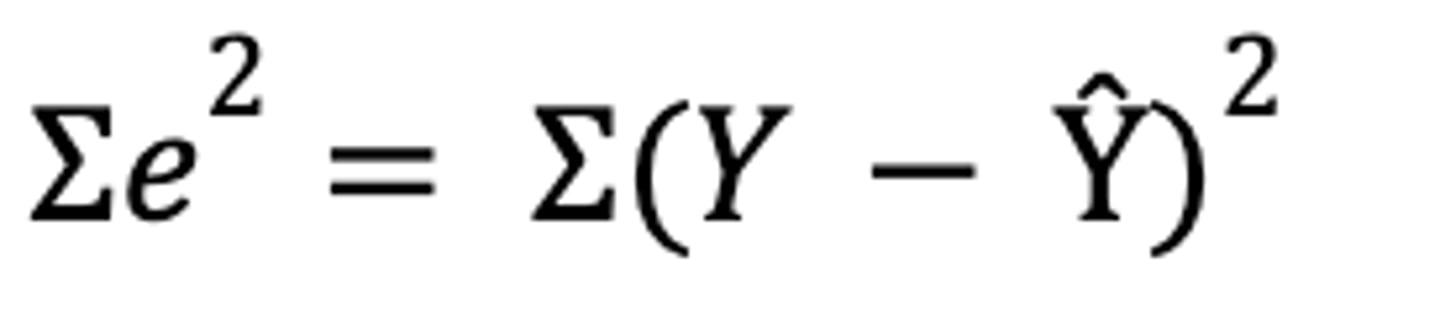
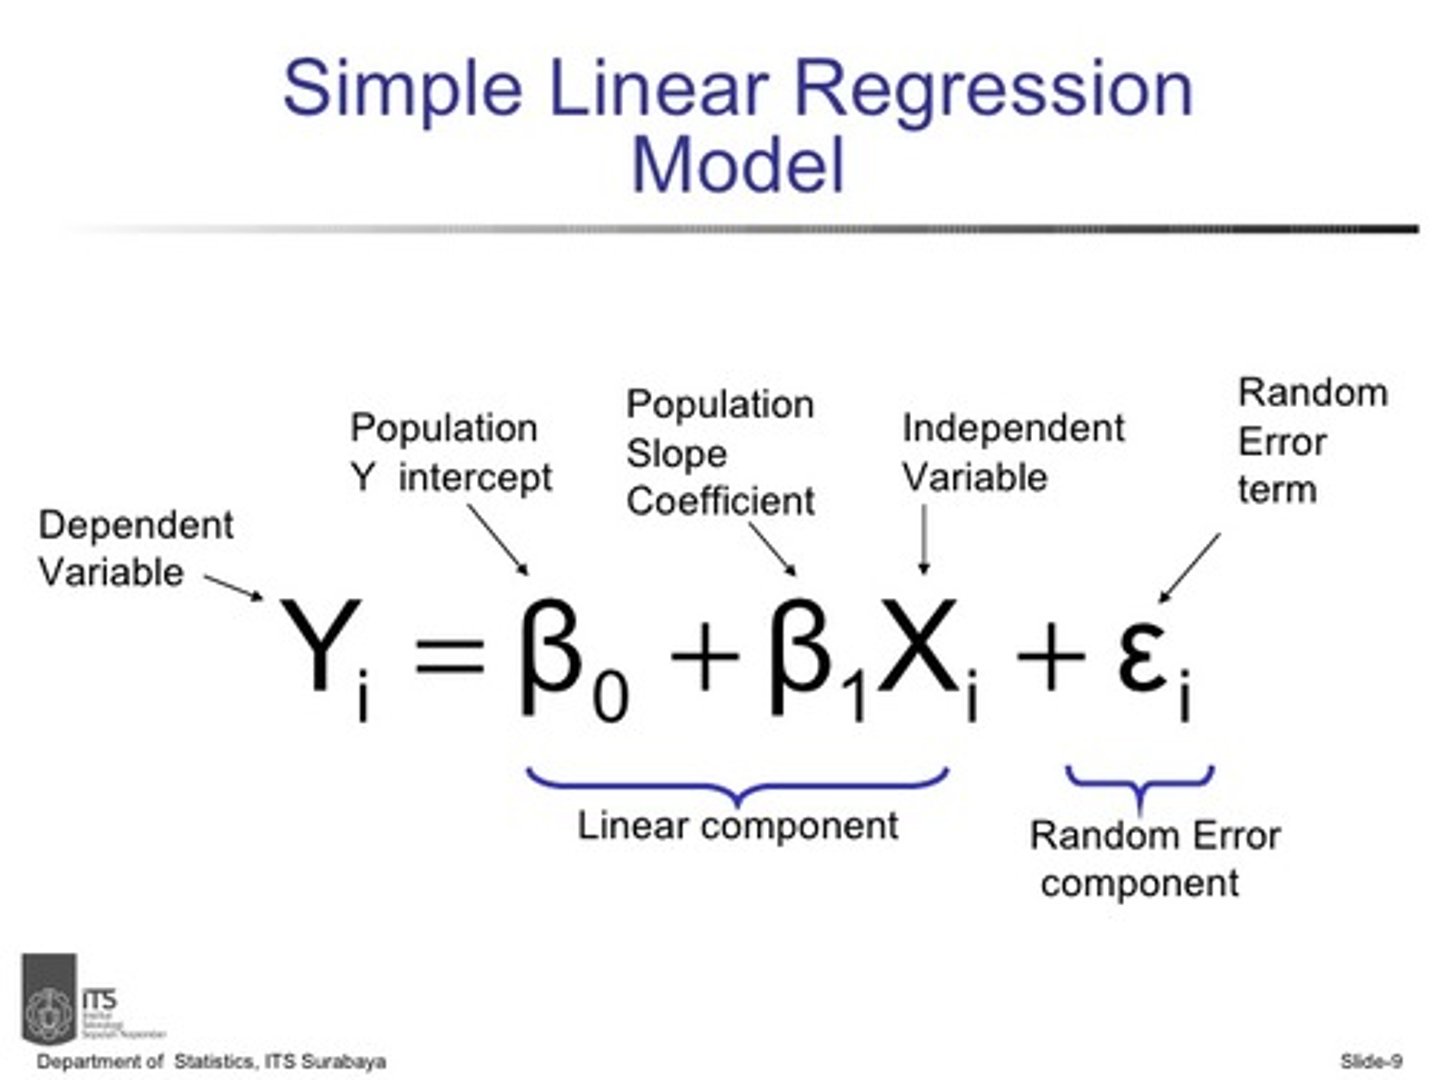
What is the simple linear (regression) model formula?
𝑦=𝑎+𝑏∙𝑥+ 𝜖
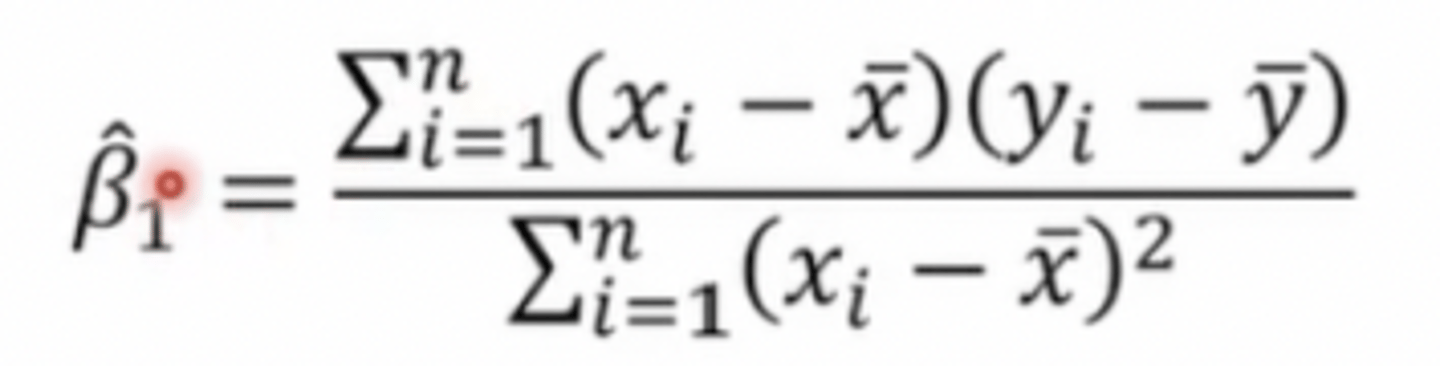
What is the regression coefficient formula?
Correlation coefficient multiplied by the ratio of the SD in x and SD in y
Regression allows prediction of the value of one based on other
Value of regression coefficient says nothing about statistical relation
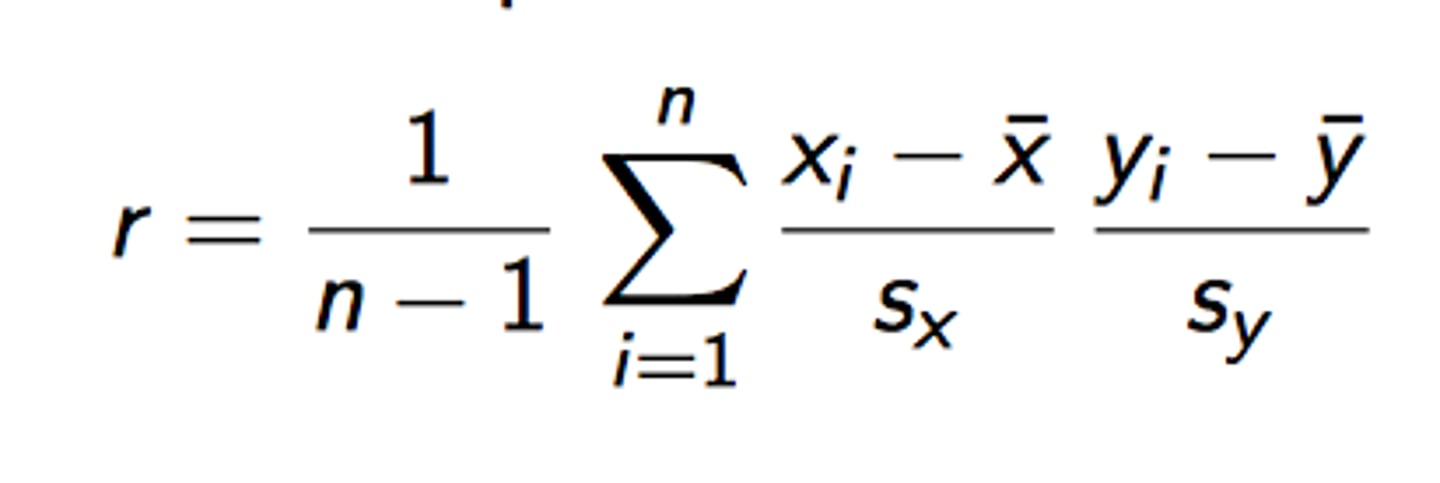
What is the (Pearson-Bravais) correlation coefficient formula?
Similar to the regression coefficient
Correlation expresses the reliability of relation of 2 vars
What can you not do in the regression coefficient model?
Regression of y on x is not the same as regression of x on y - asymmetrical, unless x and y have been z-normalised
What do you do if x and y have been z-normalised?
Take variable and subtract from each element of the variable the mean, and then divide it by SD of the variable
Then regression coefficient is informative of the strength of the statistical relation (and is identical to the correlation coefficient)
What's the the bivariate linear (regression) model?
y = a + b X x + 𝜖
What is the null hypothesis formula?
y = a + 0 X x + 𝜖
the slope b = 0
Although the null hypothesis is that b = 0 it doesn't mean that a large value of b means the regression is 'highly significant'
What is the standard error of regression estimation formula?
see onenote RM 3
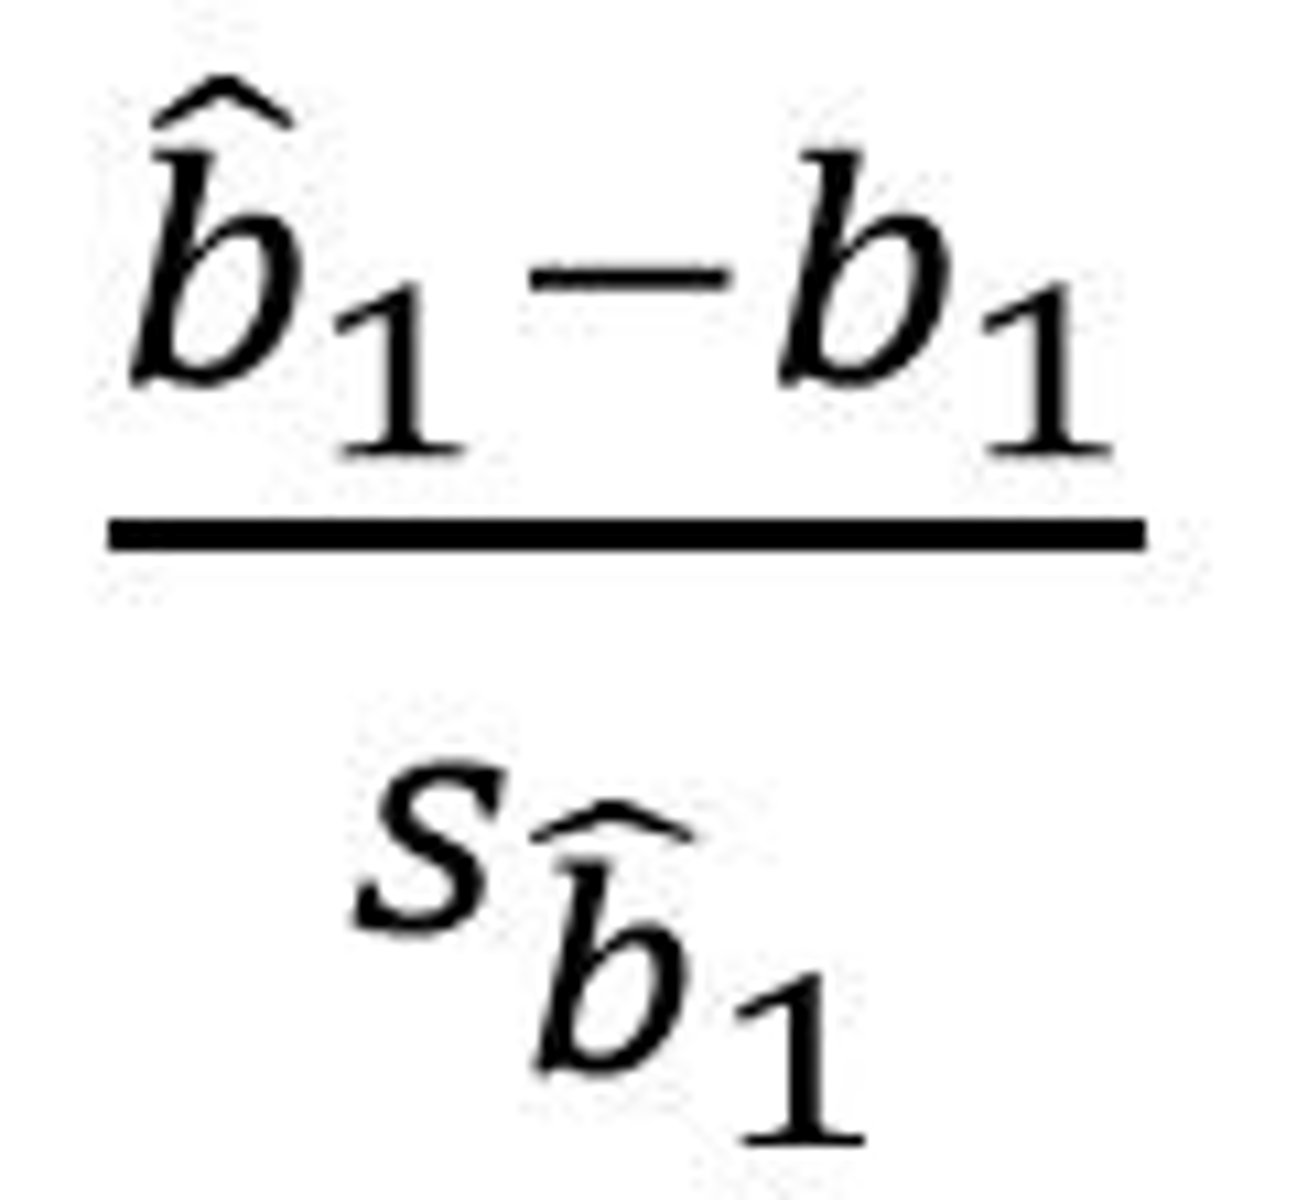
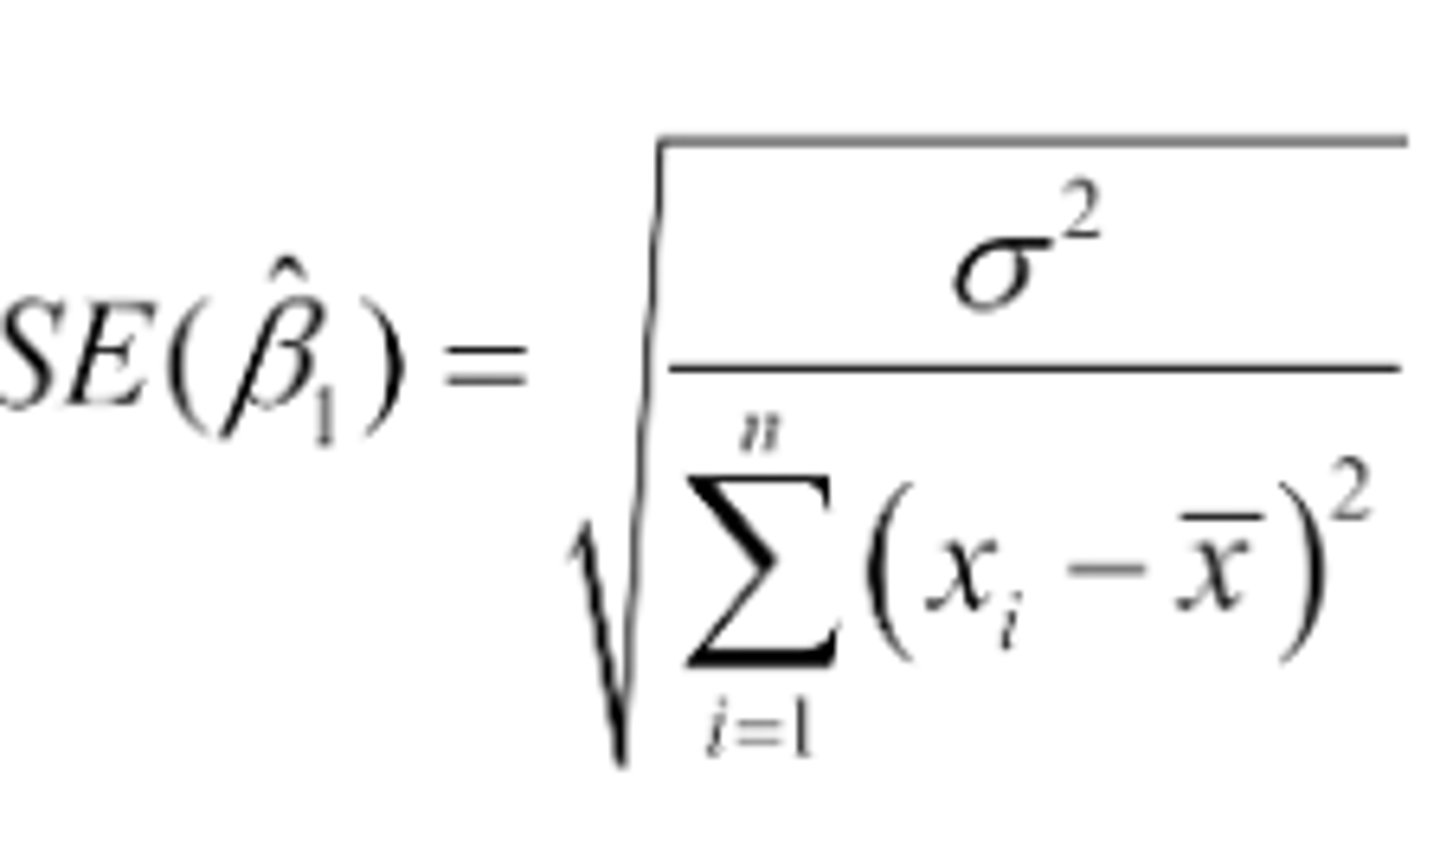
What is the standard error of the slope formula?
The 'error' against which the regression slope is tested
What do the regression slopes show?
A relatively strong correlation = there is a certain confidence inteval around the regression slope
Id moderate to strong - real regression slope
The better the goodness of fit the narrower, the 'confidence interval' of the slope of the regression line
Hence, the more confident we can be that it's different from zero This may also apply for a rather small b if the goodness of fit is great Conversely a large b does not imply statistical significant, if goodness of fit is poor
What is the Test statistic for individual regression coefficients?