MSIS 3223
1/78
Earn XP
Description and Tags
Oklahoma State University Business Data Analytics Exam 1
Name | Mastery | Learn | Test | Matching | Spaced |
|---|
No study sessions yet.
79 Terms
Relative address
just row & column label in cell reference ex) A4
absolute address
uses $ before either row or column or both to keep the reference fixed ex) $F$4 OR $F4 OR F$4
MIN(range)
excel function finding smallest value in range of cells
MAX(range)
finds largest value in range of cells
SUM(range)
finds sum of values in range of cells
AVERAGE(range)
finds average of values in range of cells, also known as mean
COUNT(range)
find # of cells in a range that contains numbers
COUNTIF(range, criteria)
finds # of cells within a range that meet a specified criterion ex) COUNTIF(A1:A20, >20) OR COUNTIF(A1:A20, “Jim”)
descriptive analytics
most commonly used, summarizes data into meaningful charts/reports
predictive analytics
seeks to predict future by examining historical data and detecting patterns/relationships then extrapolating relationships forward in time
prescriptive analytics
uses optimization to identify best alternatives to minimize or maximize an objective, to prescribe the best solution/ course of action in order to accomplish a goal
data reliability
data is accurate and consistent
data validity
data measures what it’s supposed to measure
Decision Models
3 Types of Input
Data (assumed constant for model purposes)
uncontrollable inputs
decision options
3 types
descriptive models
predictive models
prescriptive models
uncontrollable inputs
quantities that can change but can’t be directly controlled by decision maker ex) FED controls interest rates
decision options (decision variables)
controllable & can be selected at discretion of decision maker ex) how many employees needed to maximize profit
Descriptive decision model
explain behavior, allow users to evaluate potential decisions by asking “what-if?”
predictive decision model
focus on what’ll happen in the future
prescriptive decision model
help decision makers identify best solution to decision problems by using optimization
optimization
process of finding set of values for decision options that minimize/maximize some quantity of interest
phases in problem solving
1) recognizing the problem
2) defining the problem
3) structuring the problem
4) analyzing the problem
5) interpreting results & making decision
6) implementing solution
Recognizing the problem
problem exists when gap btwn what’s happening & what we think should be happening
defining the problem
important to involve all ppl who make decisions or who may be affected by them
structuring the problem
formal model often developed in this phase
analyzing the problem
experimentation/ solution process, evaluating diff scenarios or analyzing risks associated w various decision alternatives
interpreting results & making decision
models can’t capture every detail of the real problem & managers must understand the limitations
implementing solution
making solution work in the org or translating the results back to the real world
logical functions
depend on whether 1 or more conditions are true or false
=IF
=AND
=OR
condition
statement about the value of a cell (numeric or text)
IF(condition, value if true, value if false)
logical function that returns 1 value if condition true and another if value is false ex)=IF(A2>B2, “Over Budget”, “Within budget”)
AND(condition1, condition2…)
logical function that returns TRUE if all conditions are true and FALSE if not ex)=AND(B2>750, C2>750 would return true if both cells actually exceed 750
OR(condition 1, condition 2)
logical function that returns TRUE if any of the conditions is true (even if 1 is not true) and FALSE if not ex)=OR(1>2,1>0) returns TRUE but OR(1>2, 1>3) returns FALSE
Lookup functions
VLOOKUP
HLOOKUP
INDEX
MATCH
CHOOSE
VLOOKUP
looks up value in leftmost column of a table and returns value in same row from a column you specify
HLOOKUP
looks up value in top row of a table & returns a value in same column from a row you specify
INDEX
lookup function which returns value or reference of the cell at the intersection of a particular row & column in a given range
MATCH
lookup function which returns relative position of an item in an array that matches a specified value in a specified order
CHOOSE
lookup function which returns value from a list based on position in the list, specified by index_num
PivotTables
allows you to create custom summaries/charts of key info and drill down into data
dragging a field into filters area in a PivotTable field list allows you to add 3rd dimension
can express data in various % views ex) % of grand total, % of column total, etc.
excel charts
to create: highlight range of data, click insert tab, click chart type, click chart subtype you wanna use
distinguishes btwn vertical & horizontal charts (column & bar charts)
clustered column
stacked column
line charts
area chart
scatter chart
bubble chart
combo chart
radar chart
stock chart
clustered column chart
compares values across categories using vertical rectangles
stacked column chart
displays contribution of each value to the total by stacking the rectangles
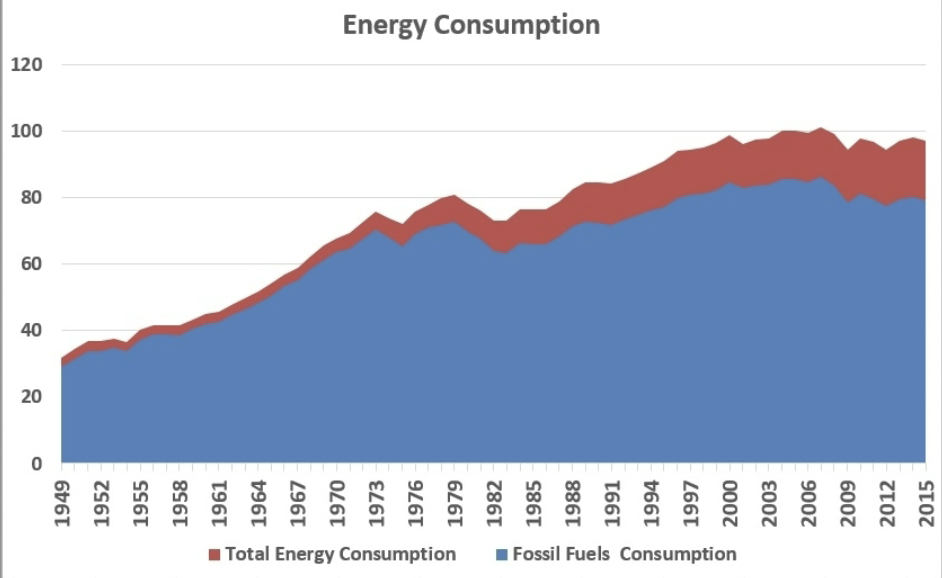
line charts
provide useful means for displaying data over time
pie chart
displays relative proportion of each data source by partitioning circle into pie-shaped areas
area chart
combines features of pie chart & line chart, useful for displaying proportions over time
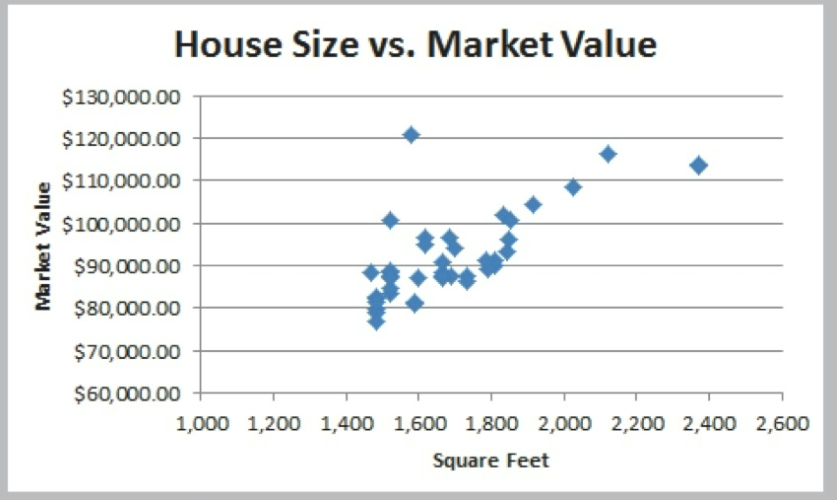
scatter chart
shows relationship btwn 2 variables and consists of observations of pairs of variable data
orbit chart: scatter chart where points are connected in sequence over time
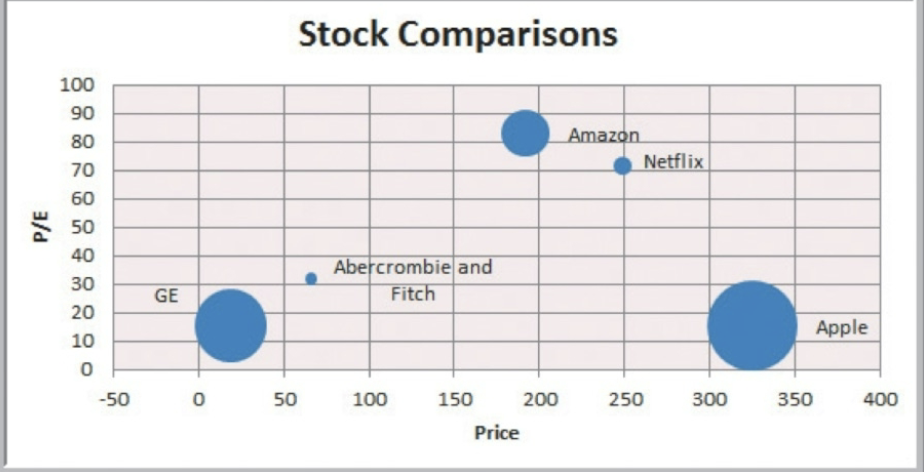
bubble chart
type of scatter chart in which size of data corresponds to value of a 3rd variable, a way to plot 3 variables in 2-D
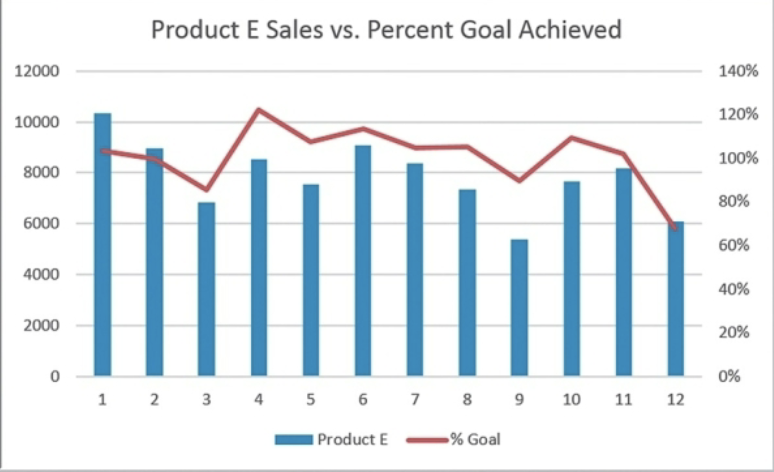
combo chart
displays multiple data series on the same chart using diff chart types such as a column chart & a line chart
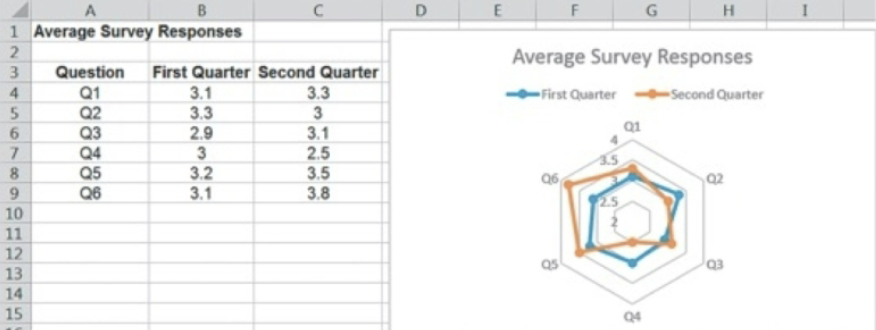
radar chart
shows multiple metrics on a spider web, allowing plotting of multiple dimensions of several data series
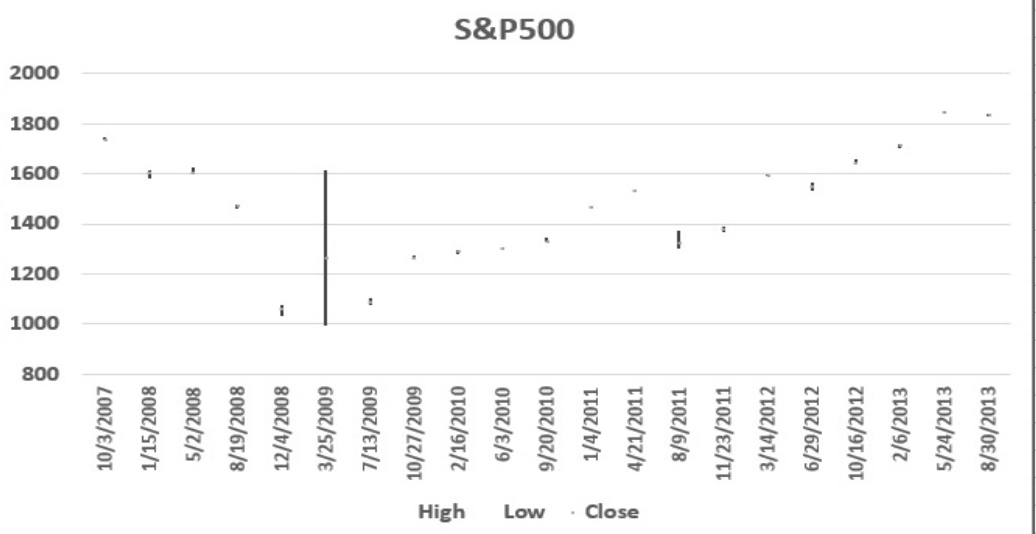
stock chart
allows you to plot stock prices ex) daily high, low, close values
dashboards
visual representation of set of key business measures, important summaries of key business info to help manage business process/function
categorical (nominal data)
sorted into categories according to specified characteristics
ordinal data
can be ordered or ranked according to some relationship to eachother
interval data
are ordinal but have constant differences btwn observations and have arbitrary zero points, allow meaningful comparison of ranges/averages & other stats
ratio data
continuous & have natural zero point, most business/ economic data ($ or time) fall into this category
frequency distribution
table showing # of observations in each of several non-overlapping groups
graphical depiction in form of a column chart is called a histogram
categorical data naturally define the groups
to make: use COUNTIF to count # of observations in each category
can be expressed as fraction or proportion of total (relative frequency)
relative frequency
frequencies expressed as fraction or proportion of total
to make: # of observations in each category divided by total # of observations in all categories
cross tabulation
tabular method displaying # of observations in a data set in diff subcategories of 2 categorical variables
often called a contingency table
subcategories of variables must be mutually exclusive & exhaustive (each observation only fit in 1 subcategory & all observations will be in a category)
population
all items of interest for a particular decision/investigation
sample/sampling
subset of population, is necessary as most populations are too large to deal with- this allows easier analyzing to obtain sufficient info to draw a valid inference about a population
measures of location
provide estimates of a single value that represents the “centering” of a set of data
average
median
mode
midrange
average/arithmetic mean
most common measure of location, sum of observations divided by # of observations
is affected by outliers
median
measure of location that specifies middle value when data arranged least-greatest
not affected by outliers
mode
measure of location, observation that occurs most frequently, useful for data sets which relatively small # of unique values
midrange
measure of location used occasionally, the average of the largest & smallest values
highly affected by outliers
dispersion
degree of variation in the data/ numerical spread (or compactness) of the data
range
interquartile range
variance
standard deviation
range
easiest to compute, difference btwn max value and min value of a data set
interquartile range (mid spread)
diff btwn first & third quartiles
variance
more commonly used, the larger the variance the more the data is spread out from the mean, average of the squared deviations of the observations from the mean
standard deviation
square root of the variance, popular measure of risk especially in financial analysis
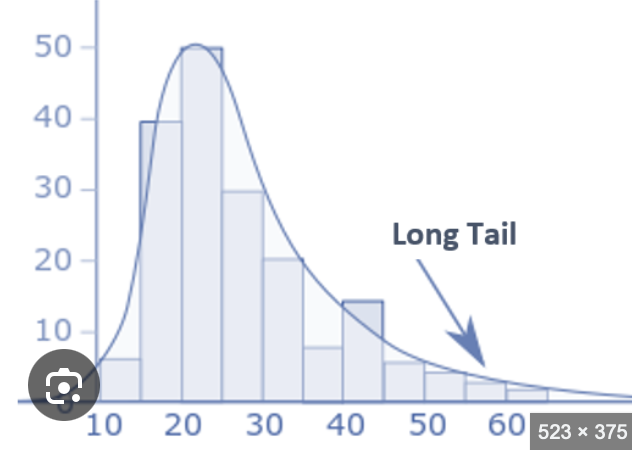
histogram
graphical form of frequency distribution, can take many diff shapes
skewness
coefficient of skewness
kurtosis
Skewness
lack of symmetry of data
Positively skewed (right-skewed)- mass of data on left with tail to right (picture)
negatively skewed (left-skewed)- mass of data on right and tail to left
used on histogram
coefficient of skewness
measures degree of asymmetry of observations around the mean of a histogram
kurtosis
peakedness or flatness of a histogram
proportion
formal statistical measure of a fraction of data that has certain characteristics
strong statistical relationship
when 2 variables appear to move together
covariance
measure of the linear association btwn 2 variables
correlation
measure of the linear relationship btwn 2 variables, not dependent on units of measurement, measured by correlation coefficient
correlation coefficient
scaled btwn -1 & 1, used to measure correlation
positive correlation coefficient (close to 1) indicates positive linear relationship btwn the variables
negative correlation coefficient (close to -1) indicates negative linear relationship exists btwn the variables
correlation coefficient close to 0 indicates no linear relationship btwn variables