MODULE 1.1: FORMULATING CAPITAL MARKET EXPECTATIONS
1/29
There's no tags or description
Looks like no tags are added yet.
Name | Mastery | Learn | Test | Matching | Spaced | Call with Kai |
|---|
No analytics yet
Send a link to your students to track their progress
30 Terms
Discuss the role of, and a framework for, capital market expectations in the portfolio management process.
Capital market expectations are risk and return expectations regarding classes of assets.
Capital market expectations are risk and return expectations regarding classes of assets.
Using a disciplined approach to set short- and long-term expectations leads to more effective security selection, asset allocation, and risk management.
Investors should ensure that portfolios are internally consistent
Cross-sectional consistency refers to consistency across asset classes regarding portfolio risk and return characteristics.
Intertemporal consistency refers to consistency over various investment horizons regarding portfolio decisions over time.
What makes a good forecast?
Good forecasts are unbiased, objective, well researched, efficient (small forecasting error), and internally consistent. A general guideline is that at least 30 observations are needed to test a hypothesis.
Poor forecasts can result in inappropriate asset allocations.
Discuss challenges in developing capital market forecasts.
Nine problems encountered in producing forecasts are
(1) limitations to using economic data,
(2) data measurement error and bias,
(3) limitations of historical estimates,
(4) the use of ex post risk and return measures,
(5) nonrepeating data patterns,
(6) failing to account for conditioning information,
(7) misinterpretation of correlations,
(8) psychological bias, and
(9) model uncertainty.
Limitations to using economic data
time lag between collection and distribution is often quite long
Data are often revised
Data indexes are often rebased over time
data measurement errors and biases
-Transcription errors are the misreporting or incorrect recording of information
-Survivorship bias commonly occurs if a manager or a security return series is deleted from the historical performance
-Appraisal data for illiquid and infrequently priced assets makes the path of returns appear smoother than it actually is.
Prudence bias
is the tendency to temper forecasts so that they do not appear extreme or the tendency to be overly cautious in forecastin
Anchoring bias
is the tendency of the mind to give disproportionate weight to the first information it receives on a topic: initial impressions, estimates, or data, anchor subsequent thoughts and judgments
Psychological biases:
– In the anchoring bias (cognitive), the first information received is overweighted. If, during a debate on the future of the economy, the first speaker forecasts a recession, that forecast is given greater credence.
– In the status quo bias (emotional), predictions are highly influenced by the recent past. If inflation is currently 4%, that becomes the forecast, rather than choosing to be different and potentially making an active error of commission.
– In the confirmation bias (cognitive), only information supporting the existing belief is considered, and such evidence may be actively sought while other evidence is ignored. To counter these tendencies, analysts should give all evidence equal scrutiny and seek out contrary opinions.
– In the overconfidence bias (emotional), past mistakes are ignored, the lack of comments from others is taken as agreement, and the accuracy of forecasts is overestimated. To counter this bias, consider a range of potential outcomes.
– In the prudence bias (cognitive), forecasts are overly conservative to avoid the regret from making extreme forecasts that could end up being incorrect. This bias can also be mitigated by considering a range of potential outcomes.
– In the availability bias (cognitive), what is easiest to remember (often an extreme event) is overweighted. Many believe that the U.S. stock market crash of 1929 may have depressed equity values in the subsequent 30 years. To counter this bias, base predictions on objective data rather than emotions or recollections of the past.
Explain how exogenous shocks may affect economic growth trends.
Changes in government policies.
Political events.
Technological progress.
Natural disasters.
Discovery of natural resources.
Financial crises.
Economic growth can be partitioned into cyclical variations and growth trends.
The former is more short-term focused; the latter is more relevant for determining long-term return expectations.
A basic model for forecasting the economic growth rate focuses on the following
Labor input, based on growth in the labor force and labor participation. Labor force growth depends on population growth and demographics. Labor participation refers to the percentage of the population working and is affected by real wages, work/leisure decisions, and social factors.
Capital per worker, which increases labor productivity.
Total factor productivity, which is reflected in technological progress and changes in government policies.
The trend rate of growth can also provide an estimate for long-term equity returns.
The market value of equity can be expressed as the product of three terms: nominal GDP, earnings/GDP (which is the share of profits in the economy), and the P/E ratio.
Over long periods, the share of profits in the economy (earnings/GDP) and the P/E ratio cannot continually increase or decrease. Thus, in the long term, the growth rate of the total value of equity in an economy is linked to the growth rate of GDP.
Compare major approaches to economic forecasting.
Econometric analysis: uses statistical methods to explain economic relationships and formulate forecasting models. Structural models are based on economic theory while reduced-form models are compact versions of structural approaches.
Economic indicators: published data, are available from governments, international organizations (e.g., the Organization of Economic Cooperation and Development), and private organizations (e.g., the Conference Board in the United States).
Advantages of Econometric Analysis
Here are advantages:
Modeling can incorporate many variables.
Once the model is specified, it can be reused.
Output is quantified and based on a consistent set of relationships.
Here are disadvantages:
Models are complex and time-consuming to construct.
The data may be difficult to forecast and the relationships can change.
Output may require interpretation or be unrealistic.
It does not work well to forecast turning points.
Advantages of Economic Indicators
Here are advantages:
Economic indicators are simple, intuitive, and easy to interpret.
Data are often readily available from third parties.
Indicator lists can be tailored to meet specific forecasting needs.
Here are disadvantages:
Forecasting results have been inconsistent.
Economic indicators have given false signals.
Indicators are revised frequently, which can make them appear to fit past business cycles better than they did when the data were first released.
Third, a checklist approach is more subjective. In this approach, an analyst considers a series of questions. Then, the analyst uses judgment and perhaps some statistical modeling to interpret the answers and formulate a forecast. Judgment is required both in determining which factors to consider and how to interpret them.
Here are advantages:
It is less complex than econometrics.
It is flexible in mixing objective statistical analysis with judgment to incorporate changing relationships.
Here are disadvantages:
It is subjective and time-consuming.
Complexity must be limited due to the manual process.
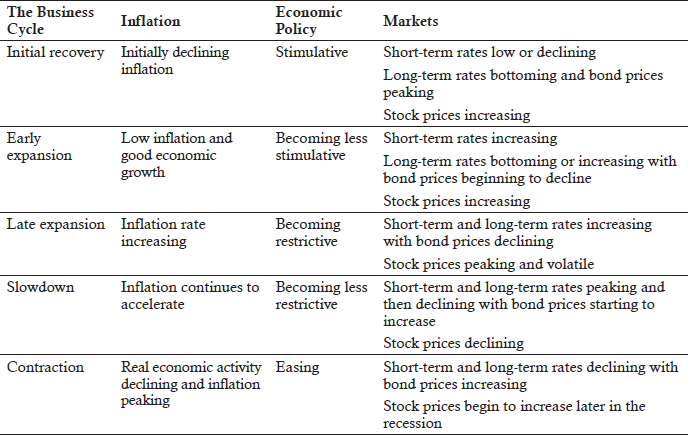
The Business Cycle
The business cycle can be subdivided into five phases:
(1) initial recovery,
(2) early expansion
(3) late expansion
(4) slowdown
(5) contraction
Initial Recovery
Duration of a few months
Business confidence rising
Government stimulus provided by low interest rates and/or budget deficits
Decelerating inflation
Large output gap
Low or falling short-term interest rates
Bond yields bottoming out
Rising stock prices
Cyclical, riskier assets such as small-cap stocks and high-yield bonds doing well
Early Expansion
Duration of a year to several years
Increasing growth with low inflation
Increasing confidence
Rising short-term interest rates
Output gap is narrowing
Stable or rising bond yields
Rising stock prices
Late Expansion
High confidence and employment
Output gap eliminated and economy at risk of overheating
Increasing inflation
Central bank limits the growth of the money supply
Rising short-term interest rates
Rising bond yields
Rising/peaking stock prices with increased risk and volatility
Slowdown
Duration of a few months to a year or longer
Declining confidence
Inflation still rising
Short-term interest rates at a peak
Bond yields peaking and possibly falling, resulting in rising bond prices
Possible inverting yield curve
Falling stock prices
Contraction
Duration of 12 to 18 months
Declining confidence and profits
Increase in unemployment and bankruptcies
Inflation topping out
Falling short-term interest rates
Falling bond yields, rising prices
Stock prices increasing during the latter stages, anticipating the end of the recession
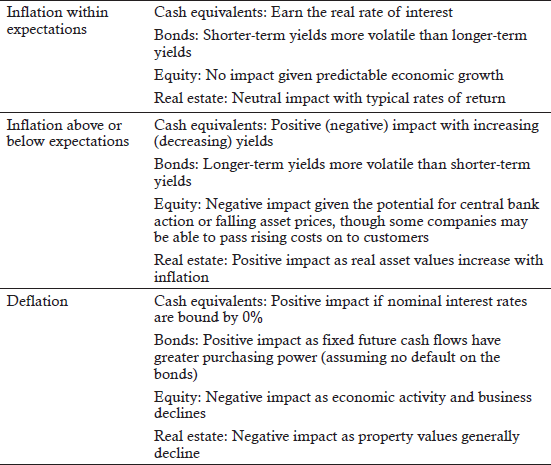
Inflation and the Business Cycle
Inflation Expectations and Asset Classes
LOS 1.h: Discuss the effects of monetary and fiscal policy on business cycles.
Most central banks strive to balance price stability against economic growth. The ultimate goal is to keep growth near its long-run sustainable rate, because growth faster than the long-run rate usually results in increased inflation.
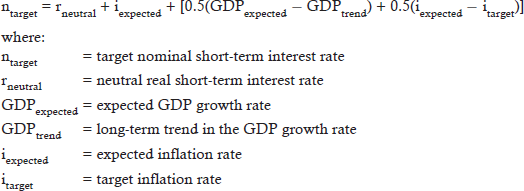
The neutral rate is the rate that most central banks strive to achieve as they attempt to balance the risks of inflation and recession. If inflation is too high, the central bank should increase short-term interest rates. If economic growth is too low, it should decrease interest rates. The Taylor rule embodies this concept.
Taylor Rule
The Taylor rule determines the target interest rate using the neutral rate, expected GDP relative to its long-term trend, and expected inflation relative to its targeted amount.
Fiscal Policy
If the government wants to stimulate the economy, it can implement loose fiscal policy by decreasing taxes or increasing spending, thereby increasing the budget deficit. If they want to rein in growth, the government does the opposite to implement fiscal tightening.
There are two important aspects to fiscal policy. First, it is not the level of the budget deficit that matters—it is the change in the deficit. For example, a deficit by itself does not stimulate the economy, but increases in the deficit are required to stimulate the economy. Second, changes in the deficit that occur naturally over the course of the business cycle are not stimulative or restrictive. In an expanding economy, deficits will decline because tax receipts increase and disbursements to the unemployed decrease. The opposite occurs during a recession. Only changes in the deficit directed by government policy will influence growth.
LOS 1.i: Interpret the shape of the yield curve as an economic predictor and discuss the relationship between the yield curve and fiscal and monetary policy.
If both policies are stimulative, the yield curve is steep and the economy is likely to grow.
If both policies are restrictive, the yield curve is inverted and the economy is likely to contract.
If monetary policy is restrictive and fiscal policy is stimulative, the yield curve is flat and the implications for the economy are less clear.
If monetary policy is stimulative and fiscal policy is restrictive, the yield curve is moderately steep and the implications for the economy are less clear.
Macroeconomic links
Macroeconomic links can produce convergence in business cycles among economies. International trade produces one such link, as a country’s exports and economy are depressed by a slowdown in a trading partner’s economy and level of imports. International capital flows produce another link if cross-border capital investing by a trading partner declines as its economy contracts.
A country’s current account and capital account are measures of macroeconomic linkages. The current account largely consists of a country’s net exports, while the capital account reflects net investment flows. The two accounts are opposites of each other in that a surplus in one account will produce a deficit in the other.
Interest rates and currency exchange rates can also create linkages. A strong link is created when a smaller economy “pegs” its currency to that of a larger and more developed economy. The peg is a unilateral declaration by the pegging country to maintain the exchange rate. In general, the linkage between the business cycles of the two economies will increase, as the pegged currency country must follow the economic policies of the country to which it has pegged its currency. If not, investors will favor one currency over the other and the peg will fail.