Clinical Investigation Final
1/152
There's no tags or description
Looks like no tags are added yet.
Name | Mastery | Learn | Test | Matching | Spaced | Call with Kai |
|---|
No analytics yet
Send a link to your students to track their progress
153 Terms
DEVELOPING GUIDELINES
......
What is a CPG?
statements informed by a systematic review of evidence and an assessment of benefit and harms
What are the steps used to develop evidence based CPGs (6)
1. Identify guideline objectives and scope (target population and questions)
2. convene an expert panel including clinicians, researchers, stakeholders
3. Assess the evidence (systematc reviews, benefit vs harm analysis)
4. Develop recommendations (strength and level of evidence)
5. Review (internal and external peer review)
6. Disseminate to clinicials, organizations, and stakeholders
Step 1
1. Identify target population and the specific outcomes to be addressed
- condition should be common
- have high morbidity and mortality
- poor patient outcomes
2. create specific questions to be answered
Step 2
convene subject matter experts and stakeholders
- can include clinicians, researchers, patients, caregivers
- have minimal conflicts of interest
Step 3
assess evidence
1. use hierarchy of evidence - meta analysis, systematic reviews, RCTs are best
- rating systems are used to assign:
1. level of confidence
2. strength of recommendation
Step 4
translate evidence
- provide rubric for grading level of evidence, strength of rec., and rationale
- Prepare evidence table that includes:
benefits, harms, burden of therapy
Step 5
review of guideline by internal and external processes
- content experts
- professional associations
- process experts
Step 6
Disseminate guideline to
- national orgs
-government
- providers
-payers
- patient advocates
What is a clinical practice guideline
systematically developed evidence based statements to guide healthcare decisions
they help translate research into real world effectiveness
What are the limitations of CGPs (8)
1. complex and length
2. lack of high quality RCTs for some topics
3. Timing - difficult to evolve rapidly changing evidence
4. limited applicability to underrepresented groups
5. lack of individualization to patient comorbidities
6. no independent body to oversee CPG development
7. many available guidelines on one topic
8. conflicting recommendations between guidelines from different organization
What is the purpose/rationale of CPGs (5)
1. reduce practice variability
2. increase percentages of patients with their condition Controlled
3. improve quality of care
4. improve patient outcomes
5. serve as educational tools
what is a key point of CPGs
several types of publications aim to translate research findings into recommendations for improving patient care, but that alone does not make it a cpg
Strength of recommendation ratings
Class I - strong benefit
Class IIa - moderate
Class IIb - weak
Class III - no benefit
Class IV - Harm
Level of evidence ratings
Level A - high quality evidece
Level B-R - moderate quality evidence
Level B-NR - non randomized
Level C-LD - limited data
Level C-EO - No evidence/ expert opinion
P< a
the null is rejected
the results are statistically significant
what does a p<0.05 mean?
there is a >95% chance that you correctly rejected the H0
the smaller the p value __________________
the harder it is to say the study results occurred just by chance alone
a statistically significant p value ______________
does NOT tell you anything about magnitide or clinical relevance
one sided hypothesis
specifies a direction
- more, greater, bigger, less, increased, etc
two sided hypothesis
specifies an effect exist, but does not predict what direction
type 1 error
false positive
you said there was a difference when actually there wasnt
alpha
type 2 error
false negative
you said there was no difference, when actually there was
beta
what is alpha
probability of making a type 1 error
"level of statistical significance"
statistical power
1-beta
liklihood you will observe an effect in your sample if one actually exists
- if not enough subjects are enrolled, the study is underpowered
what is effect size? ∆
statistical calculation that describes the size of a difference in outcomes between treatment groups
what does effect size tell us? (3)
1. magnitude
2. direction
3. practical significance / investigator determines if clinically meaningful
what is sample size?
describes the number of subjects necessary for the experimental and control groups
analyzing results - Intention to treat
includes data from every subject who was randomized
analyzing results - per protocol
only subjects with complete data sets are included
phase I of clinical trial
- low number of healthy volunteers
- unblinded, uncontrolled
- goal: test safety, PK, and max tolerable dose
Phase II of clinical trial
- hundreds of diseased patients
- can be single arm or comparative
phase III clinical trials
- thousands of patients
- large, randomized, controlled
- compare with the standard of care
Phase IV clinical trial
- post market surveillence
- evaluate side effects and additional therapeutic uses
hierarchy of evidence
1. meta analyses
2. systematic reviews
3. RCTs
4. cohort studies
5. case control studies
6. case series/case reports
what is a prospective study
- move forward in time
examples of interventional trials that are prospective
1. parallel
2. crossover
3. superiority
4. noninferiority
5. pragmatic
examples of observational studies that are prospective
prospective cohort studies
examples of observational retrospective studies
- retrospective cohort studies
- case control studies
RCTS are ______________, __________________
prospective, quantitative research studies
efficacy
- intervention under ideal, highly controlled conditions
-also known as explanatory studies
effectiveness
- intervention under real world conditions
- known as pragmatic studies
what factors are on the continuum of intervention studies
1. access to intervention
2. cost
3. patient adherence/acceptance
4. physician recommendation
populations in an efficacy study
highly specific study population that means all inclusion/exclusion critera
populations in an effectiveness study
broad, clinically relevant population
purpose of randomization
prevent, eliminate bias
types of randomization
1. simple
2. blocked
3. stratified
4. cluster
blocked randomization
evenly assign allocations in the blocks, randomly select blocks to fill the study
stratified randomization
stratify participants by confounding variables
cluster randomization
unit of randomization, not on the individual level
ex: all patients in a healthcare system
parallel RCT design
whole pop-> randomize -> treatment A or Treatment B
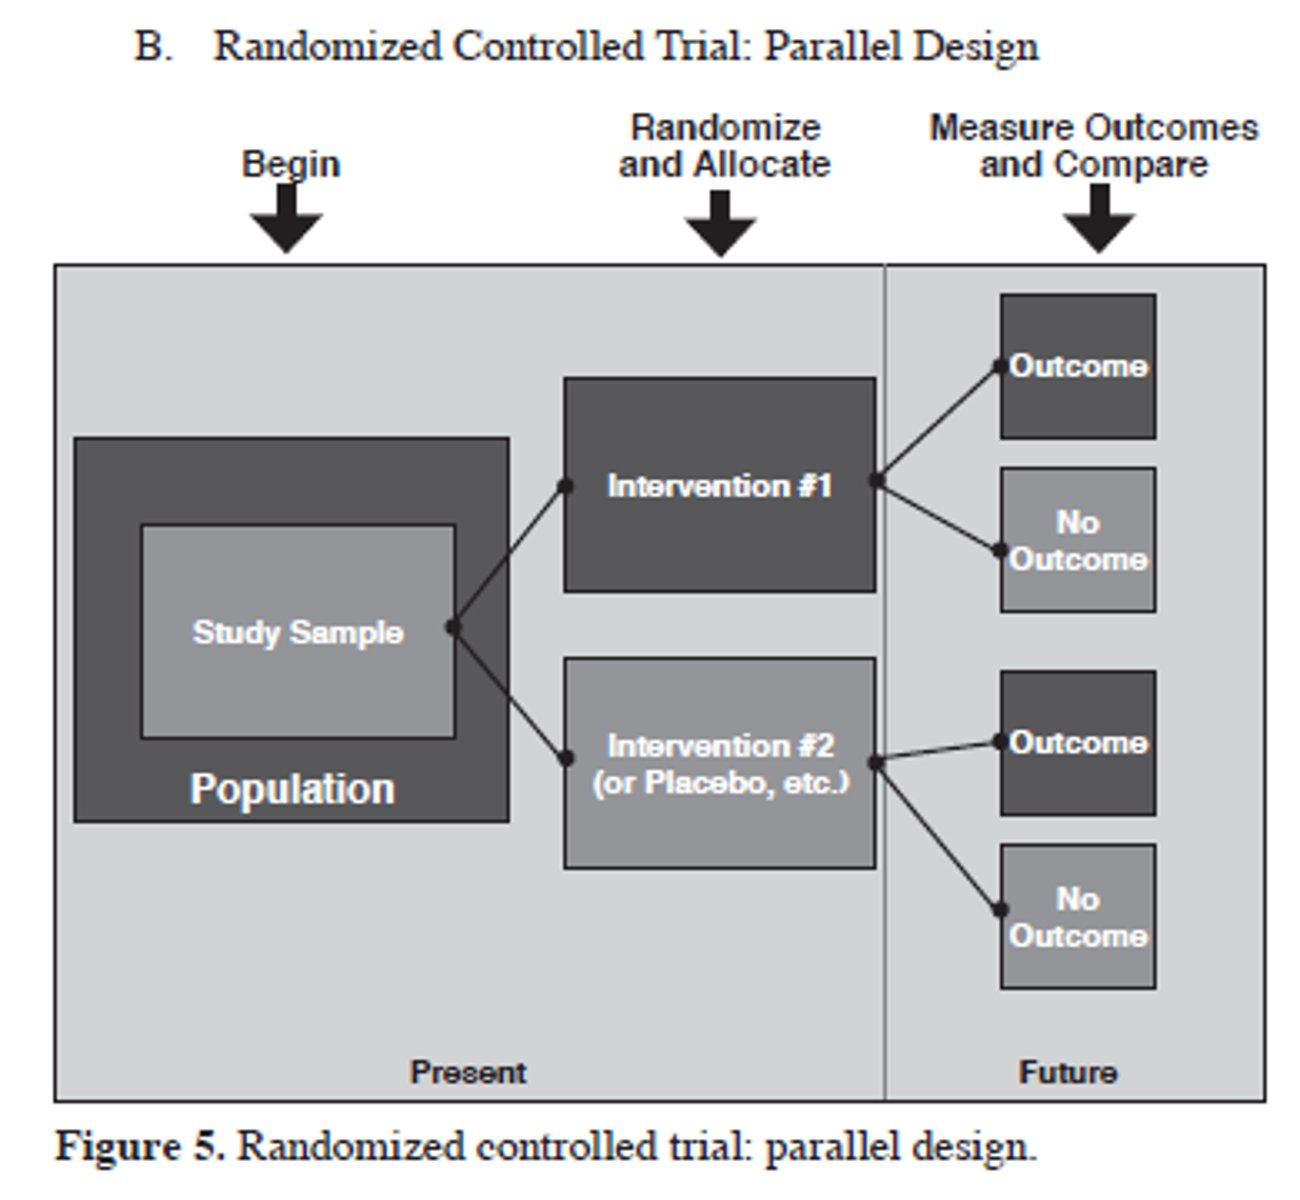
key elements of a parallel design
- groups are similar and treated identically except for intervention
- compare effects between treatments
- can examine magnitude of effect between groups
crossover rct design
population -> randomization -> treatment A or B -> washout -> treatment B or A
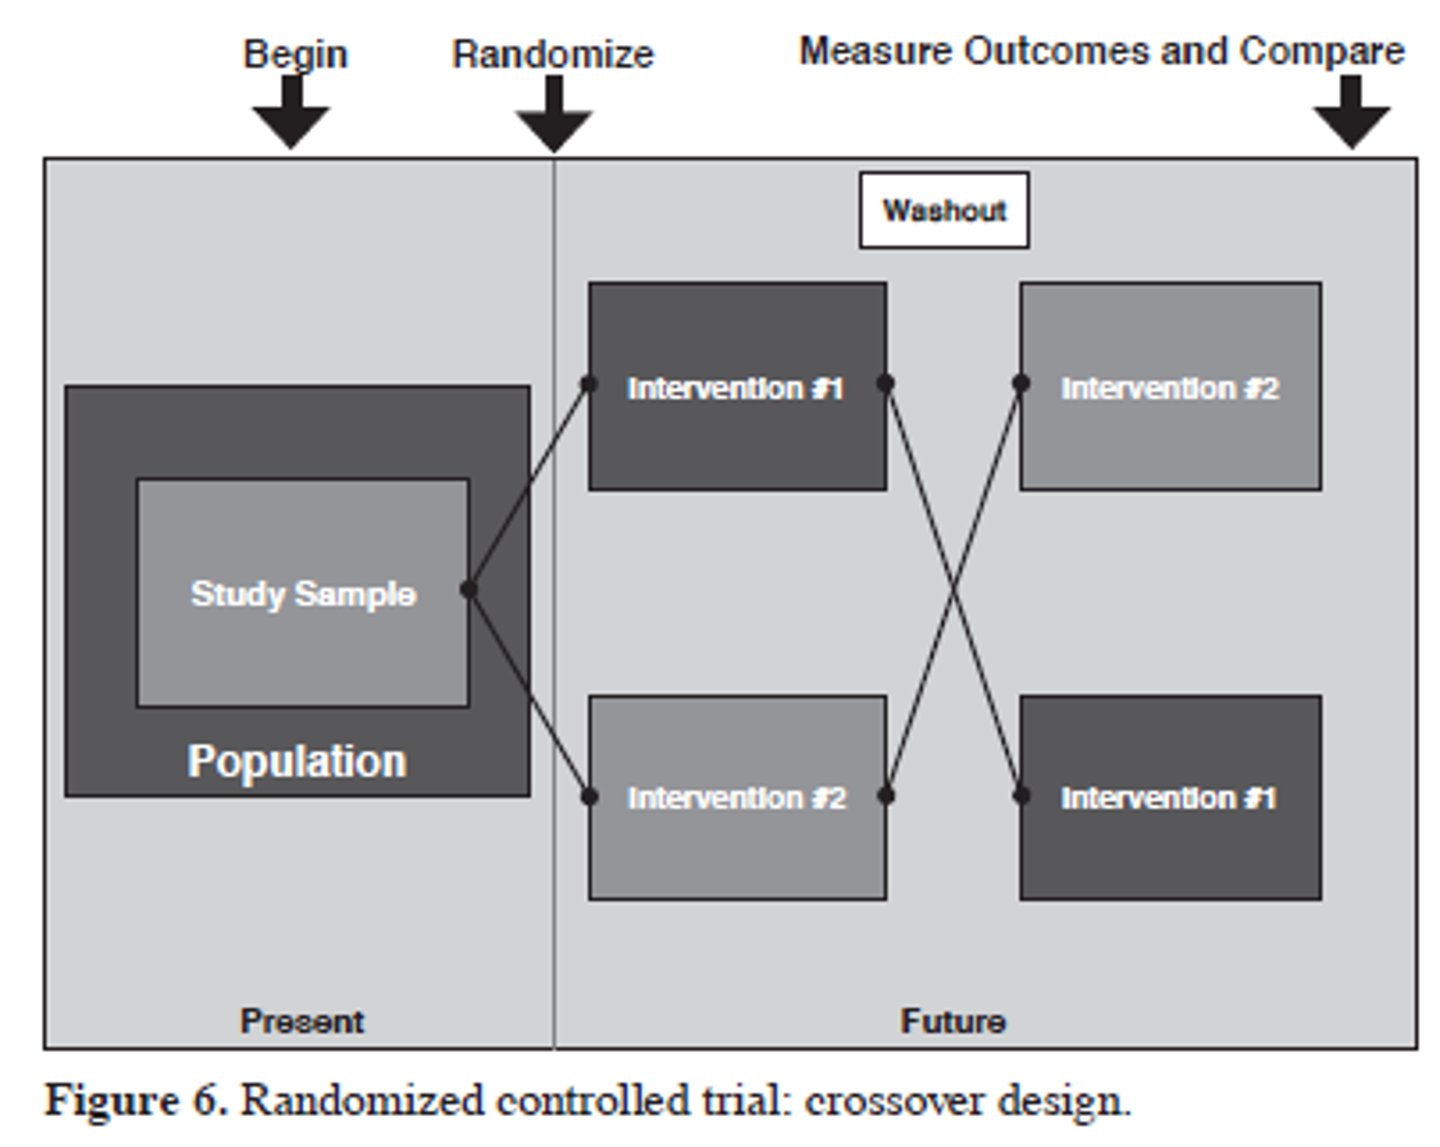
key elements of crossover design
- all subjects receive all interventions
- washout period to prevent carryover
- can compare between and within groups
overall goal of a superiority study
show a meaningful difference exists between treatments
Null hypothesis and statistical interpretation of a superiority study
no difference exists
p values
overall goal of a noninferiority study
show a meaningful difference does NOT exist between treatments
Null hypothesis and statistical interpretation of a noninferiroty study
difference exists
confidence intervals
noninferiority margin ∆
predefined unfavorable difference in outcomes between new intervention vs control
exposure
when variable is naturally determined and or not assigned
intervention
preferred term when researchers assign participants to receive a specific treatment
goal of a cohort study
determine if exposure to a risk factor is associated with an outcome of interest
cohort studies are_______________, they start with _____________
always observational,
exposure, and watch for outcome
key feature of a cohort study
participants do NOT have outcome of interest to begin with
Prevalence
number of people in a population that have disease AT A GIVEN TIME
- permanent conditions
- person counted once
Incidence
Number of new cases over time
- transient conditions
prospective cohort study
start in present, watch for the development of outcome
In prospective cohort studies can incidence be calculated?
yes
retrospective cohort study
everything has happened, look back at records to see any outcome based on exposure
case control studies
- observational
- always retrospective
- start with OUTCOME
- good for rare outcomes
- cannot calculate incidence
estimation of risk
-Prospective = RR or OR
-cohort = RR or OR
- case control = OR only
strategies to manage sampling bias in case control studies
1. clinic or hospital nased controls
2. population based controls
3. 2+ control groups
4. matching
Risk ratio
number of events/ TOTAl Number
odds ratio
number of events / number of events not of interest
what does an odds ratio of 0.7 tell us
the outcome is less likely with exposure
there is a 30% reduction in risk of outcome based on exposure
Meta analysis
a systemic review that uses quantitative statistica methods to combine results of the separate studies
- calculate a summary statistic
- primary literature
what does a funnel plot assess in meta anlayses
publication bias
What are the benefits of matching (3)
1. eliminate confounding variable influence
2. increase power
3. provide convenience when selecting controls
waht are the common biases in cohort studies
attrition, selection, confounding
what are the common biases in case control studies
recall, sampling, confounding
forest plots
- box= point of estimate of effect size
- 95% CI
- size = weight given
- diamond = pooled results
heterogeneity
differences between studies
clinical heterogeneity
- participants
- interventions
- outcomes studied
methodological heterogeneity
- study desing
- risk of bias
tests of heterogeneity
- Cochrans Q test
- I^2
for X^2 test interpretation
p> alpha = insignificant heterogeneity
p
0-40%
might not be important
30-60%
may be moderate heterogeneity
50-90%
may be substantial heterogeneity
75-100%
considerable heterogeneity
sensitivity analysis
repeat the meta analysis, substituting alternative decision ranges to prove the findings are not dependent on arbitrary or unclear decisions
EER
cases/ total subjects in experimental group
CER
cases / total subjects in control group
RR
EER/CER
ARR
CER-EER
- usually reported as a %
RRR
1-(EER/CER)
NNT
1/ARR
Number of patients that would need to be treated in order to observe a specific health benefit
NNH
1/ARI
Number of patients that would need to be treated before one person is harmed
RR < 1
experimental group had lower rate of primary outcome
RR>1
experimental group had a higher rate of primary outcome