Biostatistics exam
1/94
Earn XP
Description and Tags
this is from class
Name | Mastery | Learn | Test | Matching | Spaced | Call with Kai |
|---|
No analytics yet
Send a link to your students to track their progress
95 Terms
V2–Exercise1: Scenario: A group of researchers at a hospital in Denmark wanted to assess the differences in rates of vaccination between male and female patients presenting at their outpatient clinic for routine primary care checkup. For this, they administered a mini-survey to 330 patients (152 females and 178 males) and asked them if they had been vaccinated against COVID-19 (yes or no). Considering this scenario, they come to you for performing and interpretating the data they collected. You decide to keep the level of significance at P < 0.05.
Q1. What kind of variable is gender?
binary nominal variable
V2–Exercise1: Scenario: A group of researchers at a hospital in Denmark wanted to assess the differences in rates of vaccination between male and female patients presenting at their outpatient clinic for routine primary care checkup. For this, they administered a mini-survey to 330 patients (152 females and 178 males) and asked them if they had been vaccinated against COVID-19 (yes or no). Considering this scenario, they come to you for performing and interpretating the data they collected. You decide to keep the level of significance at P < 0.05.
Q2. What kind of variable is vaccination status?
binary nominal variable
V2–Exercise1: Scenario: A group of researchers at a hospital in Denmark wanted to assess the differences in rates of vaccination between male and female patients presenting at their outpatient clinic for routine primary care checkup. For this, they administered a mini-survey to 330 patients (152 females and 178 males) and asked them if they had been vaccinated against COVID-19 (yes or no). Considering this scenario, they come to you for performing and interpretating the data they collected. You decide to keep the level of significance at P < 0.05.
Q3. What kind of data is presented to you based on sampling type?
unpaired data
V2–Exercise1: Scenario: A group of researchers at a hospital in Denmark wanted to assess the differences in rates of vaccination between male and female patients presenting at their outpatient clinic for routine primary care checkup. For this, they administered a mini-survey to 330 patients (152 females and 178 males) and asked them if they had been vaccinated against COVID-19 (yes or no). Considering this scenario, they come to you for performing and interpretating the data they collected. You decide to keep the level of significance at P < 0.05.
Q4. Will you check for normality of the data (yes/no) and why?
no, not a scale variable
V2–Exercise1: Scenario: A group of researchers at a hospital in Denmark wanted to assess the differences in rates of vaccination between male and female patients presenting at their outpatient clinic for routine primary care checkup. For this, they administered a mini-survey to 330 patients (152 females and 178 males) and asked them if they had been vaccinated against COVID-19 (yes or no). Considering this scenario, they come to you for performing and interpretating the data they collected. You decide to keep the level of significance at P < 0.05.
Q5. What will be the most appropriate test(s) for analysing this data?
Chi-Square test: Unpaired, categorical (2×2 or R×C tables)
Fisher's Exact Test: Use if expected cell counts < 5
V2–Exercise1: Scenario: A group of researchers at a hospital in Denmark wanted to assess the differences in rates of vaccination between male and female patients presenting at their outpatient clinic for routine primary care checkup. For this, they administered a mini-survey to 330 patients (152 females and 178 males) and asked them if they had been vaccinated against COVID-19 (yes or no). Considering this scenario, they come to you for performing and interpretating the data they collected. You decide to keep the level of significance at P < 0.05.
Q6. Based on your choice of test, what NULL hypothesis can you make for the present scenario?
H₀ = No association between gender and vaccination
V2–Exercise1: Scenario: A group of researchers at a hospital in Denmark wanted to assess the differences in rates of vaccination between male and female patients presenting at their outpatient clinic for routine primary care checkup. For this, they administered a mini-survey to 330 patients (152 females and 178 males) and asked them if they had been vaccinated against COVID-19 (yes or no). Considering this scenario, they come to you for performing and interpretating the data they collected. You decide to keep the level of significance at P < 0.05.
Q7. Based on your choice of test, what ALTERNATIVE hypothesis can you make for the present scenario?
HA = There is an association between gender and vaccination
V2–Exercise1: Scenario: A group of researchers at a hospital in Denmark wanted to assess the differences in rates of vaccination between male and female patients presenting at their outpatient clinic for routine primary care checkup. For this, they administered a mini-survey to 330 patients (152 females and 178 males) and asked them if they had been vaccinated against COVID-19 (yes or no). Considering this scenario, they come to you for performing and interpretating the data they collected. You decide to keep the level of significance at P < 0.05.
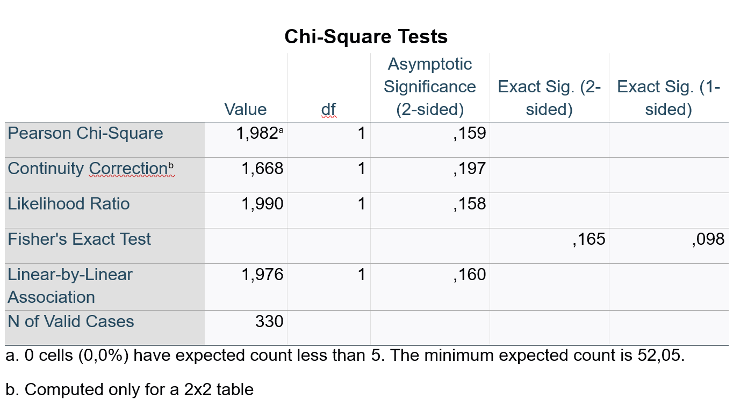
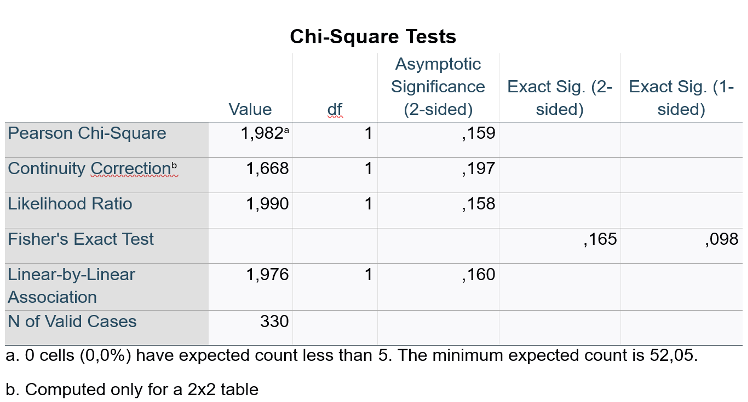
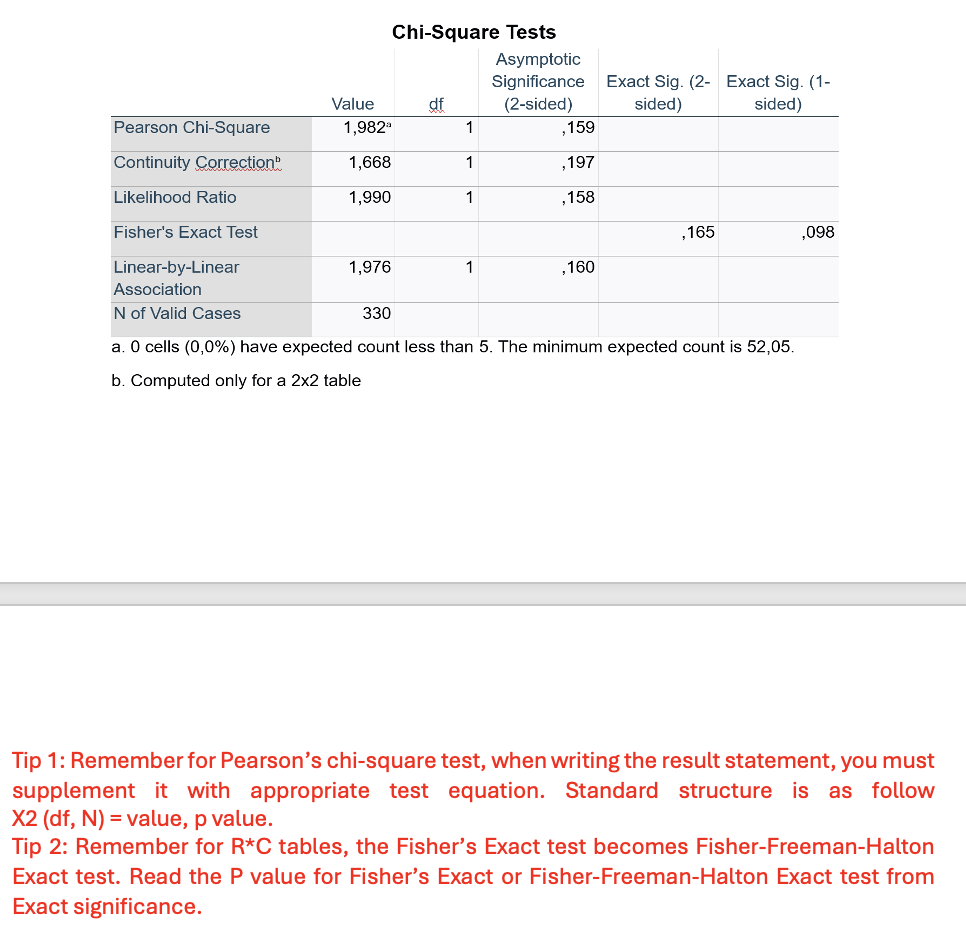
Q8. You now perform the appropriate test in SPSS and get the following output table. Write the assumptions.
Nominal 2*2 table
unpaireed
No more than 20% of expected counts < 5
V2–Exercise1: Scenario: A group of researchers at a hospital in Denmark wanted to assess the differences in rates of vaccination between male and female patients presenting at their outpatient clinic for routine primary care checkup. For this, they administered a mini-survey to 330 patients (152 females and 178 males) and asked them if they had been vaccinated against COVID-19 (yes or no). Considering this scenario, they come to you for performing and interpretating the data they collected. You decide to keep the level of significance at P < 0.05.
Q9. Which test do you choose based on the assumption check?
Pearson Chi-Square
V2–Exercise1: Scenario: A group of researchers at a hospital in Denmark wanted to assess the differences in rates of vaccination between male and female patients presenting at their outpatient clinic for routine primary care checkup. For this, they administered a mini-survey to 330 patients (152 females and 178 males) and asked them if they had been vaccinated against COVID-19 (yes or no). Considering this scenario, they come to you for performing and interpretating the data they collected. You decide to keep the level of significance at P < 0.05.
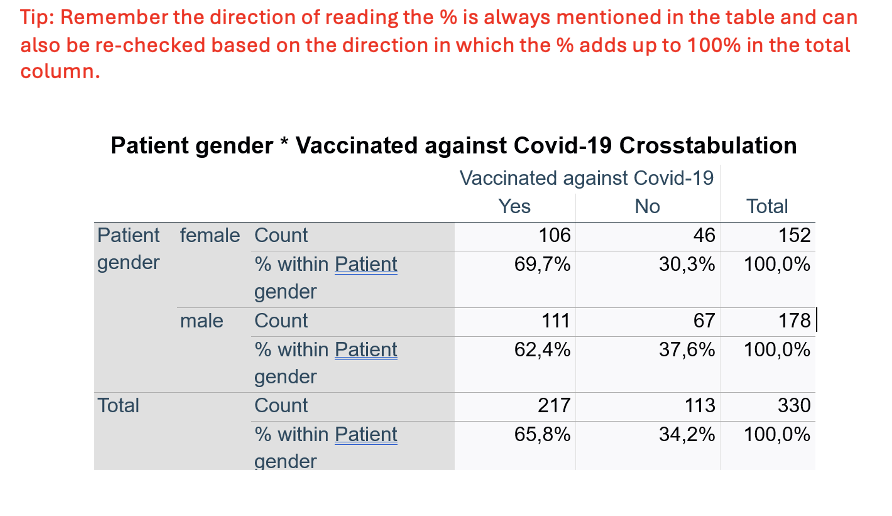
Q10. Interpret the tables and write the results (descriptive statistics).
out of 152 Females: 69.7% vaccinated, 30.3% unvaccinated.
out of 178 Males: 62.4% vaccinated, 37.6% unvaccinated.
V2 – Exercise1: Scenario: A group of researchers at a hospital in Denmark wanted to assess the differences in rates of vaccination between male and female patients presenting at their outpatient clinic for routine primary care checkup. For this, they administered a mini-survey to 330 patients (152 females and 178 males) and asked them if they had been vaccinated against COVID-19 (yes or no). Considering this scenario, they come to you for performing and interpretating the data they collected. You decide to keep the level of significance at P < 0.05.
Q11. Interpret the table and write the results (INFERENTIAL STATISTICS).
p=0.159 → P > 0.05 → Fail to reject H₀ (not significant, normal distribution)."
A Pearson’s chi-square test revealed not significant association between gender and vaccination status, χ²(1, N=330) = 1.98, p = 0.159."
V2 – Exercise1: Scenario: A group of researchers at a hospital in Denmark wanted to assess the differences in rates of vaccination between male and female patients presenting at their outpatient clinic for routine primary care checkup. For this, they administered a mini-survey to 330 patients (152 females and 178 males) and asked them if they had been vaccinated against COVID-19 (yes or no). Considering this scenario, they come to you for performing and interpretating the data they collected. You decide to keep the level of significance at P < 0.05.
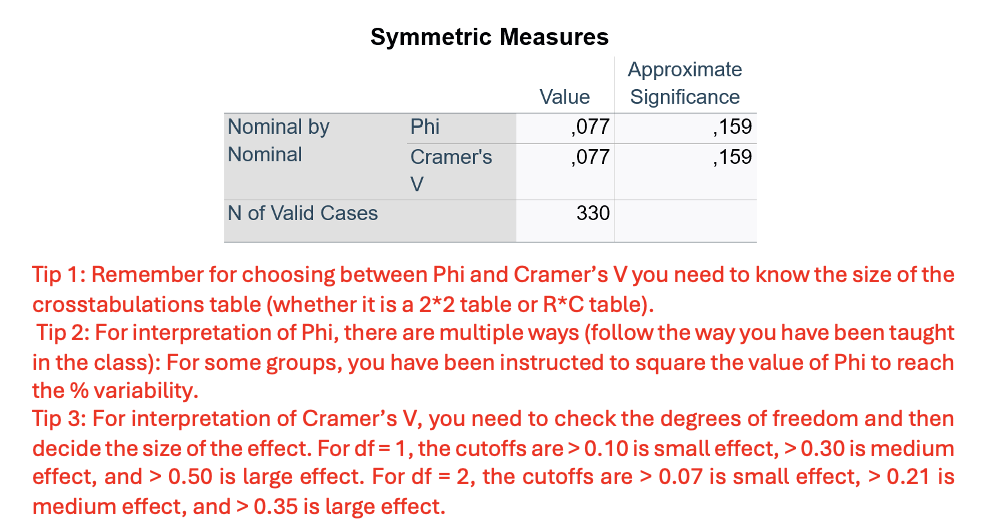
Q12. Interpret the table and write the results (EFFECT SIZE).
2×2 table → use Phi
Phi (φ) = 0.077
φ² = 0.0059 → 0.59% of variability in vaccination status is explained by gender, phi=0.077
V2 – Exercise1: Scenario: A group of researchers at a hospital in Denmark wanted to assess the differences in rates of vaccination between male and female patients presenting at their outpatient clinic for routine primary care checkup. For this, they administered a mini-survey to 330 patients (152 females and 178 males) and asked them if they had been vaccinated against COVID-19 (yes or no). Considering this scenario, they come to you for performing and interpretating the data they collected. You decide to keep the level of significance at P < 0.05.
Q13. Which graphical illustration would be best suited in this scenario?
bar chart
Version2 – Exercise 2: Scenario: A group of researchers at the surgery department in Edinburg, United Kingdom wanted to assess the differences in the risk of surgical complications in patients with acute cholecystitis when stratified based on co-morbidities. For this, they retrospectively reviewed and collected data from 330 medical records from 2010 to 2015. They specifically looked if the patient had developed any complications (yes or no) and if the patient had any major co-morbidities (diabetes, hypertension, or sepsis). Patients having multiple co-morbidities were excluded from the dataset. Considering this scenario, the surgeons came to you for performing and interpretating the data they collected. You decide to keep the level of significance at P < 0.05.
Q1. What kind of variable is risk of complications?
Binary nominal
Version2 – Exercise2: Scenario: A group of researchers at the surgery department in Edinburg, United Kingdom wanted to assess the differences in the risk of surgical complications in patients with acute cholecystitis when stratified based on co-morbidities. For this, they retrospectively reviewed and collected data from 330 medical records from 2010 to 2015. They specifically looked if the patient had developed any complications (yes or no) and if the patient had any major co-morbidities (diabetes, hypertension, or sepsis). Patients having multiple co-morbidities were excluded from the dataset. Considering this scenario, the surgeons came to you for performing and interpretating the data they collected. You decide to keep the level of significance at P < 0.05.
Q2. What kind of variable is co-morbidities?
Polynomial Nominal
Version2 – Exercise2: Scenario: A group of researchers at the surgery department in Edinburg, United Kingdom wanted to assess the differences in the risk of surgical complications in patients with acute cholecystitis when stratified based on co-morbidities. For this, they retrospectively reviewed and collected data from 330 medical records from 2010 to 2015. They specifically looked if the patient had developed any complications (yes or no) and if the patient had any major co-morbidities (diabetes, hypertension, or sepsis). Patients having multiple co-morbidities were excluded from the dataset. Considering this scenario, the surgeons came to you for performing and interpretating the data they collected. You decide to keep the level of significance at P < 0.05.
Q3. What kind of data is presented to you based on sampling type?
Unpaired
Version2 – Exercise2: Scenario: A group of researchers at the surgery department in Edinburg, United Kingdom wanted to assess the differences in the risk of surgical complications in patients with acute cholecystitis when stratified based on co-morbidities. For this, they retrospectively reviewed and collected data from 330 medical records from 2010 to 2015. They specifically looked if the patient had developed any complications (yes or no) and if the patient had any major co-morbidities (diabetes, hypertension, or sepsis). Patients having multiple co-morbidities were excluded from the dataset. Considering this scenario, the surgeons came to you for performing and interpretating the data they collected. You decide to keep the level of significance at P < 0.05.
Q4. Will you check for normality of the data (yes/no) and why?
No, no scale variable
Version 2– Exercise2: Scenario: A group of researchers at the surgery department in Edinburg, United Kingdom wanted to assess the differences in the risk of surgical complications in patients with acute cholecystitis when stratified based on co-morbidities. For this, they retrospectively reviewed and collected data from 330 medical records from 2010 to 2015. They specifically looked if the patient had developed any complications (yes or no) and if the patient had any major co-morbidities (diabetes, hypertension, or sepsis). Patients having multiple co-morbidities were excluded from the dataset. Considering this scenario, the surgeons came to you for performing and interpretating the data they collected. You decide to keep the level of significance at P < 0.05.
Q5. What will be the most appropriate test(s) for analysing this data?
Pearson’s chi-square test (3x2 table)
Fisher-Freeman-Halton exact test ( if ecpected counts <5)
Version 2– Exercise2: Scenario: A group of researchers at the surgery department in Edinburg, United Kingdom wanted to assess the differences in the risk of surgical complications in patients with acute cholecystitis when stratified based on co-morbidities. For this, they retrospectively reviewed and collected data from 330 medical records from 2010 to 2015. They specifically looked if the patient had developed any complications (yes or no) and if the patient had any major co-morbidities (diabetes, hypertension, or sepsis). Patients having multiple co-morbidities were excluded from the dataset. Considering this scenario, the surgeons came to you for performing and interpretating the data they collected. You decide to keep the level of significance at P < 0.05.
Q6. Based on your choice of test, what NULL hypothesis can you make for the present scenario?
H₀: There is no association between comorbidities and surgical complications.
Version 2– Exercise2: Scenario: A group of researchers at the surgery department in Edinburg, United Kingdom wanted to assess the differences in the risk of surgical complications in patients with acute cholecystitis when stratified based on co-morbidities. For this, they retrospectively reviewed and collected data from 330 medical records from 2010 to 2015. They specifically looked if the patient had developed any complications (yes or no) and if the patient had any major co-morbidities (diabetes, hypertension, or sepsis). Patients having multiple co-morbidities were excluded from the dataset. Considering this scenario, the surgeons came to you for performing and interpretating the data they collected. You decide to keep the level of significance at P < 0.05.
Q7. Based on your choice of test, what ALTERNATIVE hypothesis can you make for the present scenario?
HA: There is an association between comorbidities and surgical complications.

Version 2– Exercise2: Scenario: A group of researchers at the surgery department in Edinburg, United Kingdom wanted to assess the differences in the risk of surgical complications in patients with acute cholecystitis when stratified based on co-morbidities. For this, they retrospectively reviewed and collected data from 330 medical records from 2010 to 2015. They specifically looked if the patient had developed any complications (yes or no) and if the patient had any major co-morbidities (diabetes, hypertension, or sepsis). Patients having multiple co-morbidities were excluded from the dataset. Considering this scenario, the surgeons came to you for performing and interpretating the data they collected. You decide to keep the level of significance at P < 0.05.
Q8. You now perform the appropriate test in SPSS and get the following output table. Write the assumptions.
Unpaired, nominal (R*C), <20%
0% of cells have expected counts <5 (minimum expected count = 12.52).
Version 2– Exercise2: Scenario: A group of researchers at the surgery department in Edinburg, United Kingdom wanted to assess the differences in the risk of surgical complications in patients with acute cholecystitis when stratified based on co-morbidities. For this, they retrospectively reviewed and collected data from 330 medical records from 2010 to 2015. They specifically looked if the patient had developed any complications (yes or no) and if the patient had any major co-morbidities (diabetes, hypertension, or sepsis). Patients having multiple co-morbidities were excluded from the dataset. Considering this scenario, the surgeons came to you for performing and interpretating the data they collected. You decide to keep the level of significance at P < 0.05.
Q9. Which test do you choose based on the assumption check?
Pearson’s chi-square test
Assumptions are met (all expected counts ≥5).
Version 2– Exercise2: Scenario: A group of researchers at the surgery department in Edinburg, United Kingdom wanted to assess the differences in the risk of surgical complications in patients with acute cholecystitis when stratified based on co-morbidities. For this, they retrospectively reviewed and collected data from 330 medical records from 2010 to 2015. They specifically looked if the patient had developed any complications (yes or no) and if the patient had any major co-morbidities (diabetes, hypertension, or sepsis). Patients having multiple co-morbidities were excluded from the dataset. Considering this scenario, the surgeons came to you for performing and interpretating the data they collected. You decide to keep the level of significance at P < 0.05.
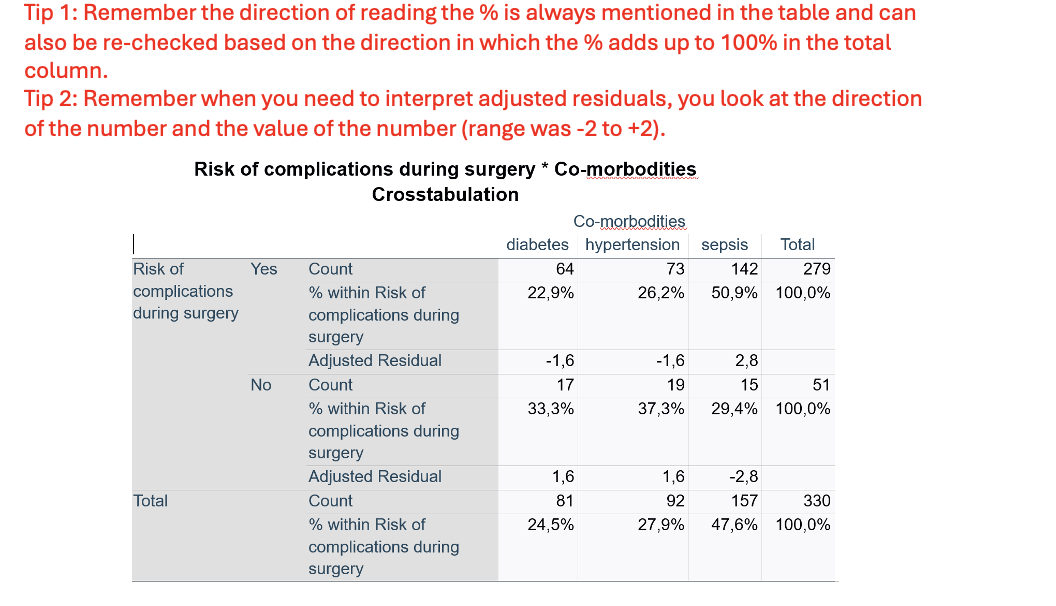
Q10. Interpret the tables and write the results (descriptive statistics including adjusted residuals).
Out of 279 patients who had complications:
22.9% had diabetes
26.2% had hypertension
50.9% had sepsis
Out of 51 patients who did not have complications:
33.3% had diabetes
37.3% had hypertension
29.4% had sepsis
— There is a significant over representation of people in risk of complications during surgery with sepsis (adj.res=2,8 )
— There is a no significant under representation of people in risk of complications during surgery with diabetes and hypertension (adj.res=-1.6 )
Version 2– Exercise2: Scenario: A group of researchers at the surgery department in Edinburg, United Kingdom wanted to assess the differences in the risk of surgical complications in patients with acute cholecystitis when stratified based on co-morbidities. For this, they retrospectively reviewed and collected data from 330 medical records from 2010 to 2015. They specifically looked if the patient had developed any complications (yes or no) and if the patient had any major co-morbidities (diabetes, hypertension, or sepsis). Patients having multiple co-morbidities were excluded from the dataset. Considering this scenario, the surgeons came to you for performing and interpretating the data they collected. You decide to keep the level of significance at P < 0.05.
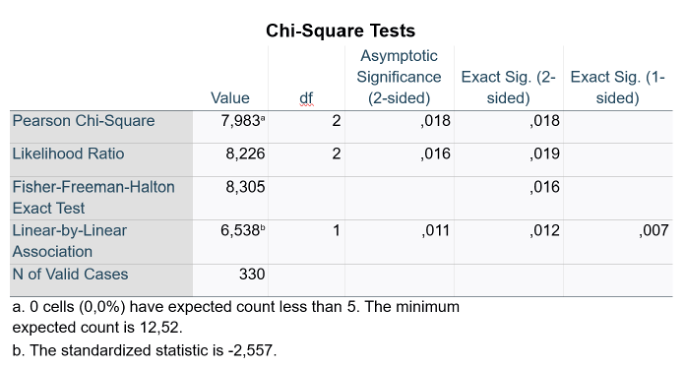
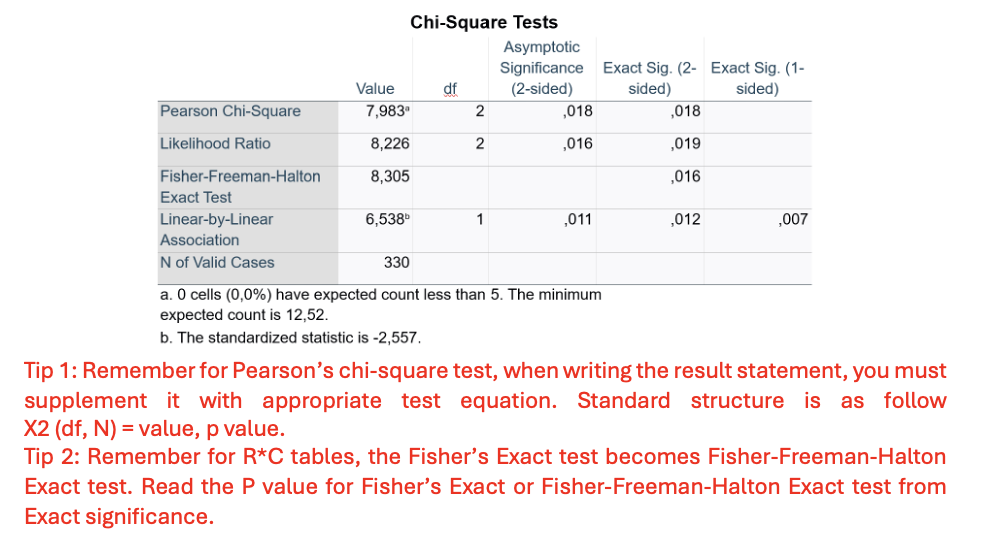
Q11. Interpret the table and write the results (INFERENTIAL STATISTICS).
p-value !! p=0.018
A Pearson’s chi-square test revealed a significant association between comorbidities and surgical complications, χ²(2, N=330) = 7.983, p = 0.018
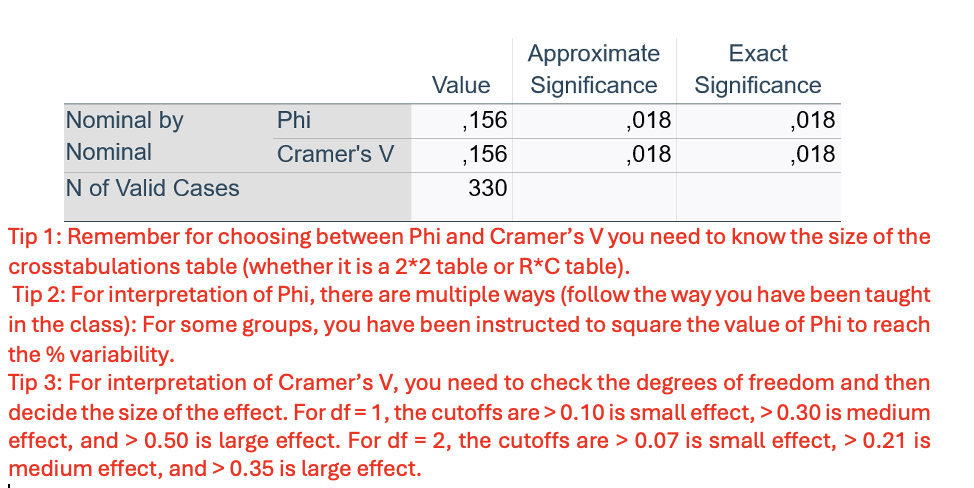
Version 2– Exercise2: Scenario: A group of researchers at the surgery department in Edinburg, United Kingdom wanted to assess the differences in the risk of surgical complications in patients with acute cholecystitis when stratified based on co-morbidities. For this, they retrospectively reviewed and collected data from 330 medical records from 2010 to 2015. They specifically looked if the patient had developed any complications (yes or no) and if the patient had any major co-morbidities (diabetes, hypertension, or sepsis). Patients having multiple co-morbidities were excluded from the dataset. Considering this scenario, the surgeons came to you for performing and interpretating the data they collected. You decide to keep the level of significance at P < 0.05.
Q12. Interpret the table and write the results (EFFECT SIZE
Cramer’s V =0,156, small effect
Version 2– Exercise2: Scenario: A group of researchers at the surgery department in Edinburg, United Kingdom wanted to assess the differences in the risk of surgical complications in patients with acute cholecystitis when stratified based on co-morbidities. For this, they retrospectively reviewed and collected data from 330 medical records from 2010 to 2015. They specifically looked if the patient had developed any complications (yes or no) and if the patient had any major co-morbidities (diabetes, hypertension, or sepsis). Patients having multiple co-morbidities were excluded from the dataset. Considering this scenario, the surgeons came to you for performing and interpretating the data they collected. You decide to keep the level of significance at P < 0.05
Q13. Which graphical illustration would be best suited in this scenario?.
bar chart
Version 1– Exercise 3: Scenario: The hospital manager at the Karolinska Clinic, Sweden wanted to assess the relationship between patient’s body mass index as a comorbidity and hospitalization expenses incurred on such patients. She believes analysing such data would help to better allocate hospital resources, funding, and enhance patient allocation and care in the departments. For this, she retrospectively analyses the data from 330 adult patients admitted to the clinic from Jan 2024 to April 2024, collecting data about BMI (kg/m2) and expenses (euros). Considering this scenario, they come to you for performing and interpretating the data they collected. You decide to keep the level of significance at P < 0.05.
Q1. What kind of variable is BMI (kg/m2)?
Continuous scale variable
Version 1– Exercise 3: Scenario: The hospital manager at the Karolinska Clinic, Sweden wanted to assess the relationship between patient’s body mass index as a comorbidity and hospitalization expenses incurred on such patients. She believes analysing such data would help to better allocate hospital resources, funding, and enhance patient allocation and care in the departments. For this, she retrospectively analyses the data from 330 adult patients admitted to the clinic from Jan 2024 to April 2024, collecting data about BMI (kg/m2) and expenses (euros). Considering this scenario, they come to you for performing and interpretating the data they collected. You decide to keep the level of significance at P < 0.05.
Q2. What kind of variable is expenses (euros)?
Continuous scale variable
Version1 – Exercise 3: Scenario: The hospital manager at the Karolinska Clinic, Sweden wanted to assess the relationship between patient’s body mass index as a comorbidity and hospitalization expenses incurred on such patients. She believes analysing such data would help to better allocate hospital resources, funding, and enhance patient allocation and care in the departments. For this, she retrospectively analyses the data from 330 adult patients admitted to the clinic from Jan 2024 to April 2024, collecting data about BMI (kg/m2) and expenses (euros). Considering this scenario, they come to you for performing and interpretating the data they collected. You decide to keep the level of significance at P < 0.05.
Q3. What kind of data is presented to you?
unpaired data
Version 1– Exercise 3: Scenario: The hospital manager at the Karolinska Clinic, Sweden wanted to assess the relationship between patient’s body mass index as a comorbidity and hospitalization expenses incurred on such patients. She believes analysing such data would help to better allocate hospital resources, funding, and enhance patient allocation and care in the departments. For this, she retrospectively analyses the data from 330 adult patients admitted to the clinic from Jan 2024 to April 2024, collecting data about BMI (kg/m2) and expenses (euros). Considering this scenario, they come to you for performing and interpretating the data they collected. You decide to keep the level of significance at P < 0.05.
Q4. What will be the most appropriate test(s) for analysing this data?
Spearman’s correlation
(non-parametric)
Pearson’s correlation (parametric).
Version 1– Exercise 3: Scenario: The hospital manager at the Karolinska Clinic, Sweden wanted to assess the relationship between patient’s body mass index as a comorbidity and hospitalization expenses incurred on such patients. She believes analysing such data would help to better allocate hospital resources, funding, and enhance patient allocation and care in the departments. For this, she retrospectively analyses the data from 330 adult patients admitted to the clinic from Jan 2024 to April 2024, collecting data about BMI (kg/m2) and expenses (euros). Considering this scenario, they come to you for performing and interpretating the data they collected. You decide to keep the level of significance at P < 0.05.
Q5. Based on your choice of test, what NULL hypothesis can you make for the present scenario?
H₀: There is no correlation between BMI and medical expenses
Version 1– Exercise 3: Scenario: The hospital manager at the Karolinska Clinic, Sweden wanted to assess the relationship between patient’s body mass index as a comorbidity and hospitalization expenses incurred on such patients. She believes analysing such data would help to better allocate hospital resources, funding, and enhance patient allocation and care in the departments. For this, she retrospectively analyses the data from 330 adult patients admitted to the clinic from Jan 2024 to April 2024, collecting data about BMI (kg/m2) and expenses (euros). Considering this scenario, they come to you for performing and interpretating the data they collected. You decide to keep the level of significance at P < 0.05.
Q6. Based on your choice of test, what ALTERNATIVE hypothesis can you make for the present scenario?
H₁: There is a correlation between BMI and medical expenses
Version 1– Exercise 3: Scenario: The hospital manager at the Karolinska Clinic, Sweden wanted to assess the relationship between patient’s body mass index as a comorbidity and hospitalization expenses incurred on such patients. She believes analysing such data would help to better allocate hospital resources, funding, and enhance patient allocation and care in the departments. For this, she retrospectively analyses the data from 330 adult patients admitted to the clinic from Jan 2024 to April 2024, collecting data about BMI (kg/m2) and expenses (euros). Considering this scenario, they come to you for performing and interpretating the data they collected. You decide to keep the level of significance at P < 0.05.
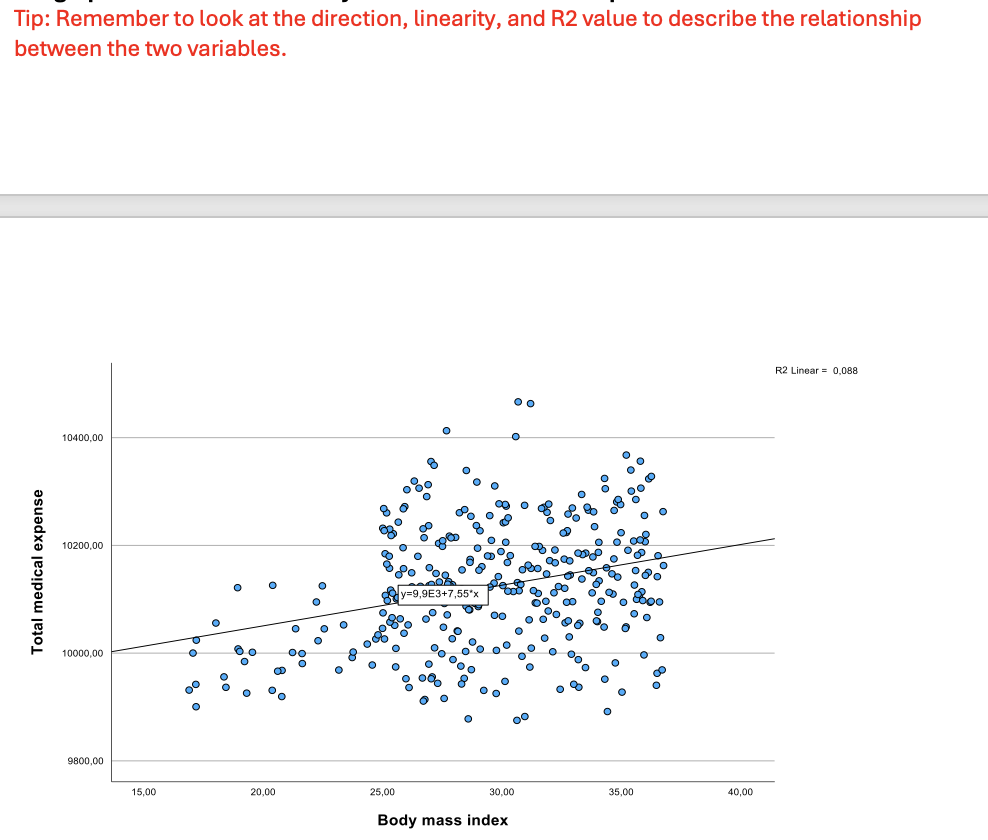
Q7. You now perform the appropriate test in SPSS and get the following graph. Analyse the graph and what does it tell you about the relationship between the variables.
R² = 0.088, <0,300; linear trendline; positive trendline, No-linear relationship.(non-parametric)
Version 1– Exercise 3: Scenario: The hospital manager at the Karolinska Clinic, Sweden wanted to assess the relationship between patient’s body mass index as a comorbidity and hospitalization expenses incurred on such patients. She believes analysing such data would help to better allocate hospital resources, funding, and enhance patient allocation and care in the departments. For this, she retrospectively analyses the data from 330 adult patients admitted to the clinic from Jan 2024 to April 2024, collecting data about BMI (kg/m2) and expenses (euros). Considering this scenario, they come to you for performing and interpretating the data they collected. You decide to keep the level of significance at P < 0.05.
Q8. Which test you choose and why?
Spearman’s correlation
R² = 0.088, <0,300
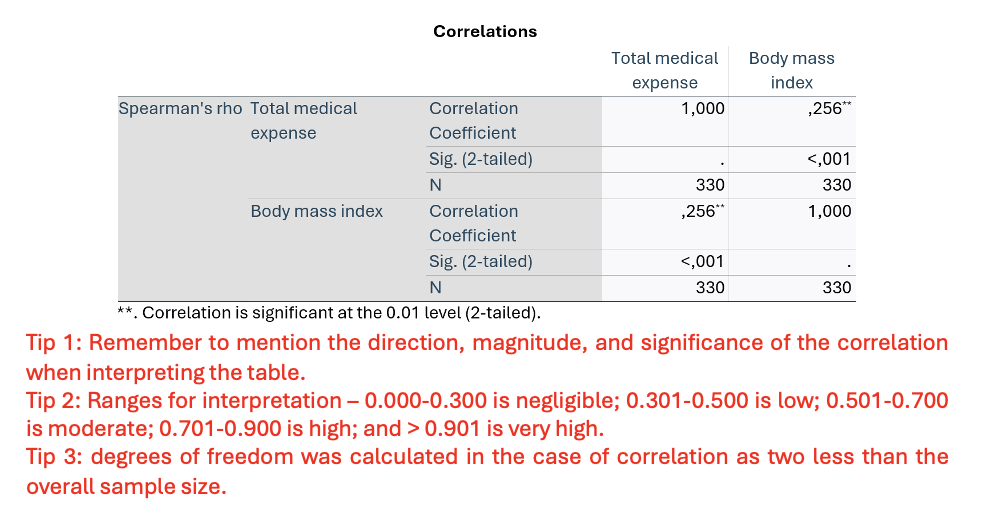
Version 1– Exercise 3: Scenario: The hospital manager at the Karolinska Clinic, Sweden wanted to assess the relationship between patient’s body mass index as a comorbidity and hospitalization expenses incurred on such patients. She believes analysing such data would help to better allocate hospital resources, funding, and enhance patient allocation and care in the departments. For this, she retrospectively analyses the data from 330 adult patients admitted to the clinic from Jan 2024 to April 2024, collecting data about BMI (kg/m2) and expenses (euros). Considering this scenario, they come to you for performing and interpretating the data they collected. You decide to keep the level of significance at P < 0.05.
Q9. Interpret the results from the correlation table (inferential statistics).
A Spearman’s correlation revealed a statistically significant, positive negligible correlation between BMI and medical expenses (rho (330-2=328) = 0.256, p < 0.001)."
statistically significant = <0.001
positive= ± correlation
negligible = 0.256 value
Version 1– Exercise 3: Scenario: The hospital manager at the Karolinska Clinic, Sweden wanted to assess the relationship between patient’s body mass index as a comorbidity and hospitalization expenses incurred on such patients. She believes analysing such data would help to better allocate hospital resources, funding, and enhance patient allocation and care in the departments. For this, she retrospectively analyses the data from 330 adult patients admitted to the clinic from Jan 2024 to April 2024, collecting data about BMI (kg/m2) and expenses (euros). Considering this scenario, they come to you for performing and interpretating the data they collected. You decide to keep the level of significance at P < 0.05.
Q10. Which graphical illustration would be best suited in this scenario?
Scatterplot with regression line
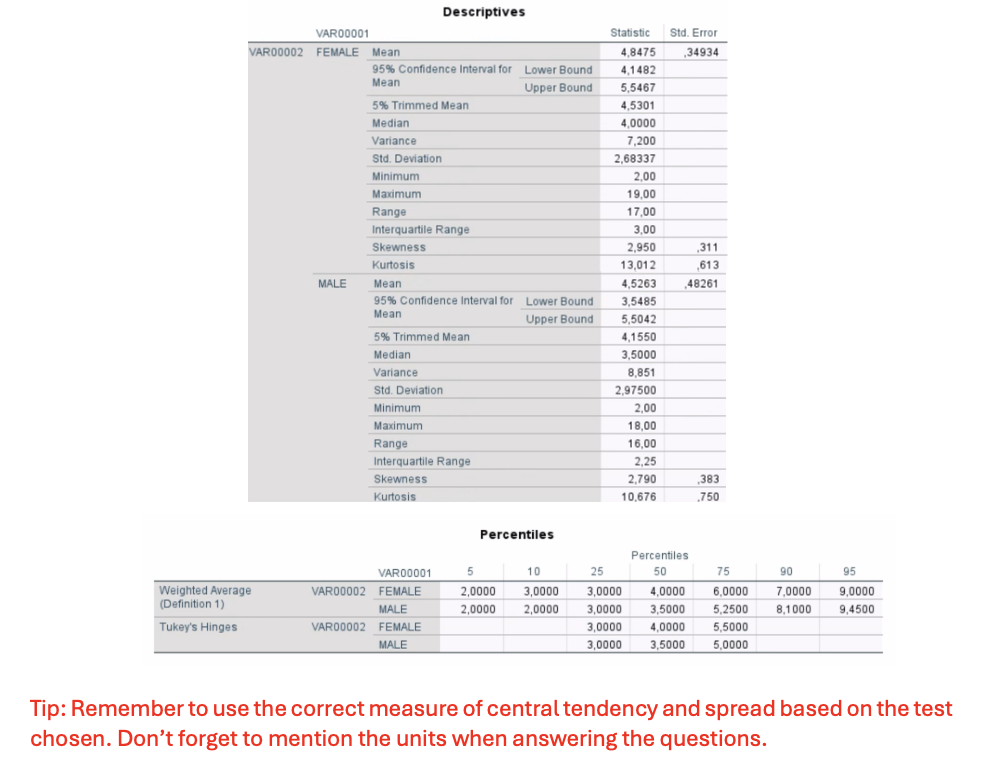
Version 1– Exercise 4: Scenario: A group of cardiac surgeons in Malta wanted to investigate the differences in the duration of hospitalization (number of days) between the two sexes (males and females). For this, they retrospectively collected 97 medical records from patients undergoing heart transplant surgery. Considering this scenario, they come to you for performing and interpretating the data they collected. You decide to keep the level of significance at P < 0.05.
Q1. What kind of variable is gender/sex?
binary Nominal
Version1 – Exercise 4: Scenario: A group of cardiac surgeons in Malta wanted to investigate the differences in the duration of hospitalization (number of days) between the two sexes (males and females). For this, they retrospectively collected 97 medical records from patients undergoing heart transplant surgery. Considering this scenario, they come to you for performing and interpretating the data they collected. You decide to keep the level of significance at P < 0.05.
Q2. What kind of variable is duration of hospitalization?
Continuous scale variable
Version 1– Exercise 4: Scenario: A group of cardiac surgeons in Malta wanted to investigate the differences in the duration of hospitalization (number of days) between the two sexes (males and females). For this, they retrospectively collected 97 medical records from patients undergoing heart transplant surgery. Considering this scenario, they come to you for performing and interpretating the data they collected. You decide to keep the level of significance at P < 0.05.'
Q3. What kind of data is presented to you?
Unpaired
Version 1– Exercise 4: Scenario: A group of cardiac surgeons in Malta wanted to investigate the differences in the duration of hospitalization (number of days) between the two sexes (males and females). For this, they retrospectively collected 97 medical records from patients undergoing heart transplant surgery. Considering this scenario, they come to you for performing and interpretating the data they collected. You decide to keep the level of significance at P < 0.05.
Q4. How many groups do the authors have (how many options are there for the factoring variable)?
2 groups
Version 1– Exercise 4: Scenario: A group of cardiac surgeons in Malta wanted to investigate the differences in the duration of hospitalization (number of days) between the two sexes (males and females). For this, they retrospectively collected 97 medical records from patients undergoing heart transplant surgery. Considering this scenario, they come to you for performing and interpretating the data they collected. You decide to keep the level of significance at P < 0.05.
Q5. What will be the most appropriate test(s) for analysing this data?
Independent samples t-test (if normal)
Mann-Whitney U test (if non-normal).
Version 1– Exercise 4: Scenario: A group of cardiac surgeons in Malta wanted to investigate the differences in the duration of hospitalization (number of days) between the two sexes (males and females). For this, they retrospectively collected 97 medical records from patients undergoing heart transplant surgery. Considering this scenario, they come to you for performing and interpretating the data they collected. You decide to keep the level of significance at P < 0.05.
Q6. Will you check for normality of the data (yes/no) and why?
Yes, because we have a scale variable
Version 1– Exercise 4: Scenario: A group of cardiac surgeons in Malta wanted to investigate the differences in the duration of hospitalization (number of days) between the two sexes (males and females). For this, they retrospectively collected 97 medical records from patients undergoing heart transplant surgery. Considering this scenario, they come to you for performing and interpretating the data they collected. You decide to keep the level of significance at P < 0.05.
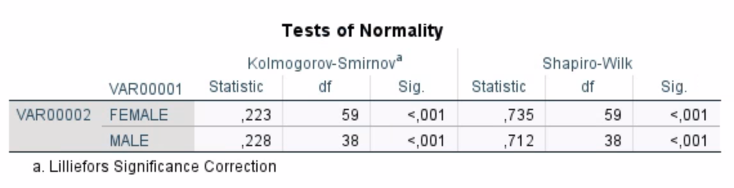
Q7. Please analyse the following output from normality check. What is the distribution of duration of hospitalization for (a) males; and (b) females. Explain your reasoning.
Females (n=59):
Shapiro-Wilk:
p < .001 → statistically significant, reject H0 → not normally distributed
Males (n=38)
Shapiro-Wilk:
p < .001 → statistically significant, reject H0 → not normally distributed
Version 1– Exercise 4: Scenario: A group of cardiac surgeons in Malta wanted to investigate the differences in the duration of hospitalization (number of days) between the two sexes (males and females). For this, they retrospectively collected 97 medical records from patients undergoing heart transplant surgery. Considering this scenario, they come to you for performing and interpretating the data they collected. You decide to keep the level of significance at P < 0.05.
Q8. Based on the normality check, which test you will choose?
Mann-Whitney U test
Data are non-normal for both groups
Version 1– Exercise 4: Scenario: A group of cardiac surgeons in Malta wanted to investigate the differences in the duration of hospitalization (number of days) between the two sexes (males and females). For this, they retrospectively collected 97 medical records from patients undergoing heart transplant surgery. Considering this scenario, they come to you for performing and interpretating the data they collected. You decide to keep the level of significance at P < 0.05.
Q9. Based on your choice of test, what NULL hypothesis can you make for the present scenario?
H₀: There is no difference in hospitalization duration between males and females.
Version 1– Exercise 4: Scenario: A group of cardiac surgeons in Malta wanted to investigate the differences in the duration of hospitalization (number of days) between the two sexes (males and females). For this, they retrospectively collected 97 medical records from patients undergoing heart transplant surgery. Considering this scenario, they come to you for performing and interpretating the data they collected. You decide to keep the level of significance at P < 0.05.
Q10. Based on your choice of test, what ALTERNATIVE hypothesis can you make for the present scenario?
H₁: There is a difference in hospitalization duration between males and females.
Version 1– Exercise 4: Scenario: A group of cardiac surgeons in Malta wanted to investigate the differences in the duration of hospitalization (number of days) between the two sexes (males and females). For this, they retrospectively collected 97 medical records from patients undergoing heart transplant surgery. Considering this scenario, they come to you for performing and interpretating the data they collected. You decide to keep the level of significance at P < 0.05.
Q11. You now perform the appropriate test in SPSS. Write the descriptive statistics for the test.
Females:
Median = 4.0 days (Q1:Q3: 3–6 day).
Males:
Median = 3.5 days (Q1:Q3 3-5.25 day).
Version 1– Exercise 4: Scenario: A group of cardiac surgeons in Malta wanted to investigate the differences in the duration of hospitalization (number of days) between the two sexes (males and females). For this, they retrospectively collected 97 medical records from patients undergoing heart transplant surgery. Considering this scenario, they come to you for performing and interpretating the data they collected. You decide to keep the level of significance at P < 0.05.
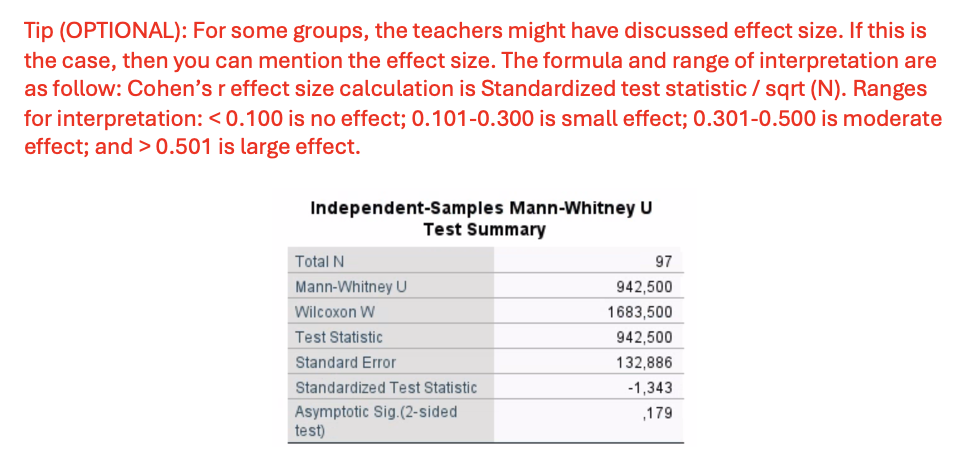
Q12. Interpret the results and write the inferential results.
U = 942.5
standardizized z = -1.343
p=0.179, not significant
Effect size (Cohen’s r):
r =-1.34397 /square root (97) =0.137 → Small effect.
A Mann-Whitney U test showed no significant difference in hospitalization duration between males and females (U = 942.5, p = 0,179). There is small effect using Cohen’s r = 0.137.
Version 1– Exercise 4: Scenario: A group of cardiac surgeons in Malta wanted to investigate the differences in the duration of hospitalization (number of days) between the two sexes (males and females). For this, they retrospectively collected 97 medical records from patients undergoing heart transplant surgery. Considering this scenario, they come to you for performing and interpretating the data they collected. You decide to keep the level of significance at P < 0.05.
Q13. Which graphical illustration would be best suited in this scenario?
Boxplot:
Version 1– Exercise 5: Scenario: A group of researchers at an occupational health service clinic in South Korea enrolled 36 food delivery workers in their region. The researchers wanted to assess the differences in opinion of food delivery workers (agree and disagree) about the harmful effects of e-cigarettes based on whether they had attended a community education workshop (yes or no). Considering this scenario, they come to you for performing and interpretating the data they collected. You decide to keep the level of significance at P < 0.05.
Q1. What kind of variable is opinion?
binary nominal
Version1 – Exercise 5: Scenario: A group of researchers at an occupational health service clinic in South Korea enrolled 36 food delivery workers in their region. The researchers wanted to assess the differences in opinion of food delivery workers (agree and disagree) about the harmful effects of e-cigarettes based on whether they had attended a community education workshop (yes or no). Considering this scenario, they come to you for performing and interpretating the data they collected. You decide to keep the level of significance at P < 0.05.
Q2. What kind of variable is workshop attendance?
binary nominal
Version 1– Exercise 5: Scenario: A group of researchers at an occupational health service clinic in South Korea enrolled 36 food delivery workers in their region. The researchers wanted to assess the differences in opinion of food delivery workers (agree and disagree) about the harmful effects of e-cigarettes based on whether they had attended a community education workshop (yes or no). Considering this scenario, they come to you for performing and interpretating the data they collected. You decide to keep the level of significance at P < 0.05.
Q3. What kind of data is presented to you based on sampling type?
unpaired
Version 1– Exercise 5: Scenario: A group of researchers at an occupational health service clinic in South Korea enrolled 36 food delivery workers in their region. The researchers wanted to assess the differences in opinion of food delivery workers (agree and disagree) about the harmful effects of e-cigarettes based on whether they had attended a community education workshop (yes or no). Considering this scenario, they come to you for performing and interpretating the data they collected. You decide to keep the level of significance at P < 0.05.
Q4. Will you check for normality of the data (yes/no) and why?
No, no scale variable
Version 1– Exercise 5: Scenario: A group of researchers at an occupational health service clinic in South Korea enrolled 36 food delivery workers in their region. The researchers wanted to assess the differences in opinion of food delivery workers (agree and disagree) about the harmful effects of e-cigarettes based on whether they had attended a community education workshop (yes or no). Considering this scenario, they come to you for performing and interpretating the data they collected. You decide to keep the level of significance at P < 0.05.
Q5. What will be the most appropriate test(s) for analysing this data?
Chi-square test (if assumptions are met)
Fisher’s Exact test (if >20% of expected cell counts < 5)
Version 1– Exercise 5: Scenario: A group of researchers at an occupational health service clinic in South Korea enrolled 36 food delivery workers in their region. The researchers wanted to assess the differences in opinion of food delivery workers (agree and disagree) about the harmful effects of e-cigarettes based on whether they had attended a community education workshop (yes or no). Considering this scenario, they come to you for performing and interpretating the data they collected. You decide to keep the level of significance at P < 0.05.
Q6. Based on your choice of test, what NULL hypothesis can you make for the present scenario?
H₀: There is no association between workshop attendance and opinion on e-cigarettes.
Version 1– Exercise 5: Scenario: A group of researchers at an occupational health service clinic in South Korea enrolled 36 food delivery workers in their region. The researchers wanted to assess the differences in opinion of food delivery workers (agree and disagree) about the harmful effects of e-cigarettes based on whether they had attended a community education workshop (yes or no). Considering this scenario, they come to you for performing and interpretating the data they collected. You decide to keep the level of significance at P < 0.05.
Q7. Based on your choice of test, what ALTERNATIVE hypothesis can you make for the present scenario?
Ha=There is an association between workshop attendance and opinion on e-cigarettes.
Version 1– Exercise 5: Scenario: A group of researchers at an occupational health service clinic in South Korea enrolled 36 food delivery workers in their region. The researchers wanted to assess the differences in opinion of food delivery workers (agree and disagree) about the harmful effects of e-cigarettes based on whether they had attended a community education workshop (yes or no). Considering this scenario, they come to you for performing and interpretating the data they collected. You decide to keep the level of significance at P < 0.05.
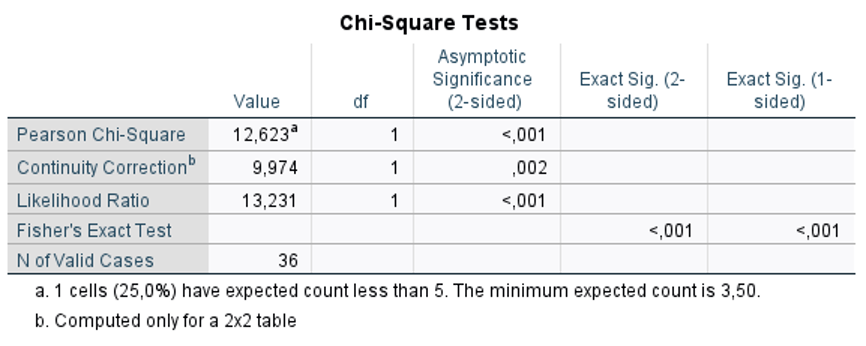
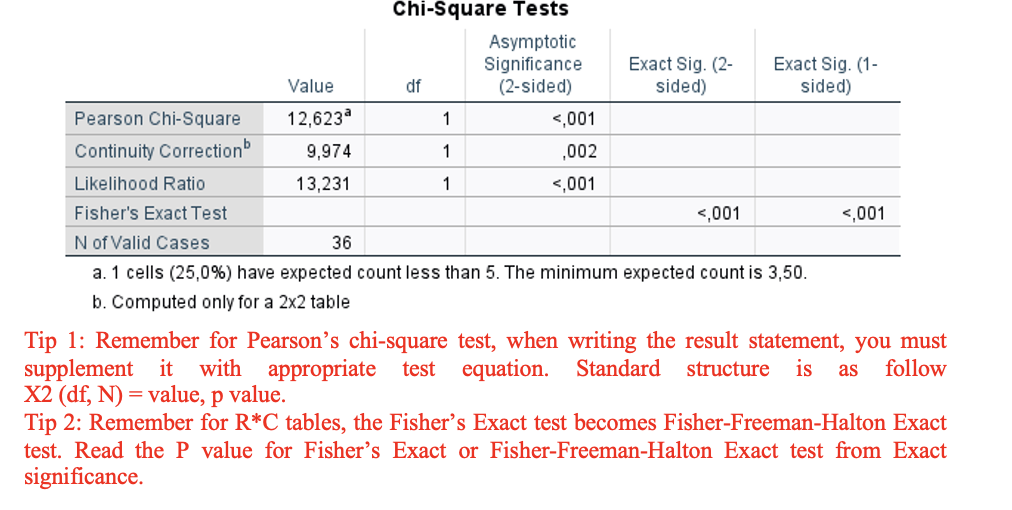
Q8. You now perform the appropriate test in SPSS and get the following output table. Write the assumptions.
1 cell (25%) has expected count <5
2x2 table
unpaired

Version 1– Exercise 5: Scenario: A group of researchers at an occupational health service clinic in South Korea enrolled 36 food delivery workers in their region. The researchers wanted to assess the differences in opinion of food delivery workers (agree and disagree) about the harmful effects of e-cigarettes based on whether they had attended a community education workshop (yes or no). Considering this scenario, they come to you for performing and interpretating the data they collected. You decide to keep the level of significance at P < 0.05.
Q9. Which test do you choose based on the assumption check?
Fisher’s Exact Test
Because 25% of cells have expected count < 5
Version 1– Exercise 5: Scenario: A group of researchers at an occupational health service clinic in South Korea enrolled 36 food delivery workers in their region. The researchers wanted to assess the differences in opinion of food delivery workers (agree and disagree) about the harmful effects of e-cigarettes based on whether they had attended a community education workshop (yes or no). Considering this scenario, they come to you for performing and interpretating the data they collected. You decide to keep the level of significance at P < 0.05.
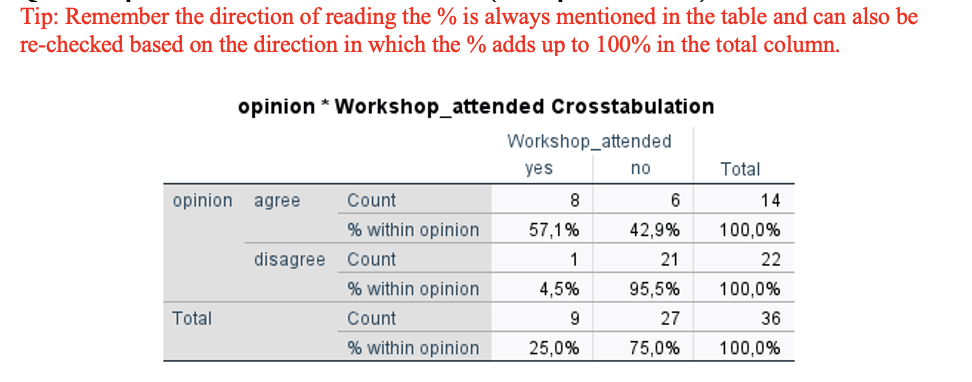
Q10. Interpret the tables and write the results (descriptive statistics).
Out of 14 workers who agreed that e-cigarettes are harmful
57,1% attended workshop
42,9% didn’t attende workshop
Out of 22 workers who disagreed that e-cigarettes are harmful
4,5% attended workshop
95,5% didn’t attende workshop
Version 1– Exercise 5: Scenario: A group of researchers at an occupational health service clinic in South Korea enrolled 36 food delivery workers in their region. The researchers wanted to assess the differences in opinion of food delivery workers (agree and disagree) about the harmful effects of e-cigarettes based on whether they had attended a community education workshop (yes or no). Considering this scenario, they come to you for performing and interpretating the data they collected. You decide to keep the level of significance at P < 0.05.
Q11. Interpret the table and write the results (INFERENTIAL STATISTICS).
Fisher’s Exact Test
p < 0.001 → Statistically significant, Reject Ho, not normally distributed
“Fisher’s Exact Test showed a statistically significant association between workshop attendance and opinion on e-cigarettes (p < 0.001).
Version 1– Exercise 5: Scenario: A group of researchers at an occupational health service clinic in South Korea enrolled 36 food delivery workers in their region. The researchers wanted to assess the differences in opinion of food delivery workers (agree and disagree) about the harmful effects of e-cigarettes based on whether they had attended a community education workshop (yes or no). Considering this scenario, they come to you for performing and interpretating the data they collected. You decide to keep the level of significance at P < 0.05.
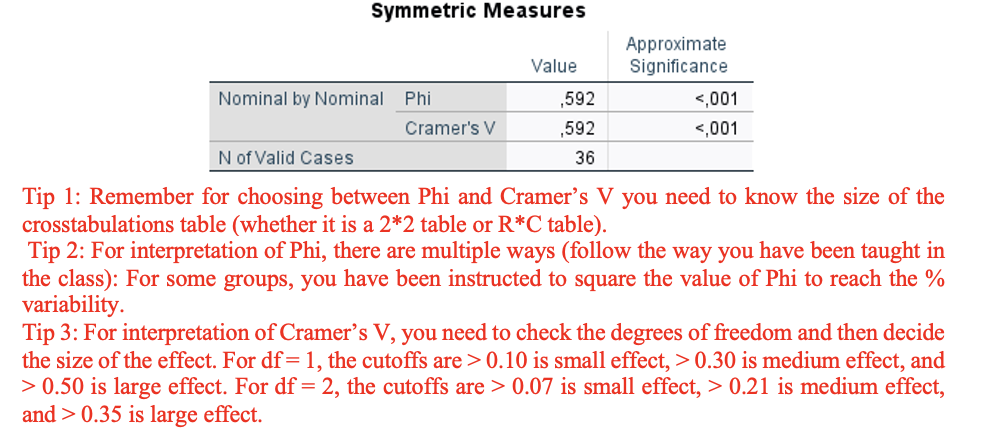
Q12. Interpret the table and write the results (EFFECT SIZE).
2x2 table use Phi
Phi (φ)=0.592 , 0.592^2=0,350=35%
Phi^2 =φ² 0,350 = 35% of variability in opinion is due to its association with workshop attendance, phi=0.592
Version 1– Exercise 5: Scenario: A group of researchers at an occupational health service clinic in South Korea enrolled 36 food delivery workers in their region. The researchers wanted to assess the differences in opinion of food delivery workers (agree and disagree) about the harmful effects of e-cigarettes based on whether they had attended a community education workshop (yes or no). Considering this scenario, they come to you for performing and interpretating the data they collected. You decide to keep the level of significance at P < 0.05.
Q13. Which graphical illustration would be best suited in this scenario?
bar chart
Version – Exercise 6: Scenario: A group of researchers at a Midwestern University in Australia measured blood pressure for 120 patients and coded the data as “normal” and “hypertension”. They first took the measurements at enrolment (baseline) and then made the participants complete a 2-hour medication and aromatherapy session. At the end of the session, blood pressure measurements were repeated. Considering this scenario, they come to you for performing and interpretating the data they collected. You decide to keep the level of significance at P < 0.05.
Q1. What kind of variable is blood pressure before session?
binary Nominal
Version – Exercise 6: Scenario: A group of researchers at a Midwestern University in Australia measured blood pressure for 120 patients and coded the data as “normal” and “hypertension”. They first took the measurements at enrolment (baseline) and then made the participants complete a 2-hour medication and aromatherapy session. At the end of the session, blood pressure measurements were repeated. Considering this scenario, they come to you for performing and interpretating the data they collected. You decide to keep the level of significance at P < 0.05.
Q2. What kind of variable is blood pressure after session?
binary Nominal
Version – Exercise 6: Scenario: A group of researchers at a Midwestern University in Australia measured blood pressure for 120 patients and coded the data as “normal” and “hypertension”. They first took the measurements at enrolment (baseline) and then made the participants complete a 2-hour medication and aromatherapy session. At the end of the session, blood pressure measurements were repeated. Considering this scenario, they come to you for performing and interpretating the data they collected. You decide to keep the level of significance at P < 0.05
Q3. What kind of data is presented to you based on sampling type?.
Paired data
Version – Exercise 6: Scenario: A group of researchers at a Midwestern University in Australia measured blood pressure for 120 patients and coded the data as “normal” and “hypertension”. They first took the measurements at enrolment (baseline) and then made the participants complete a 2-hour medication and aromatherapy session. At the end of the session, blood pressure measurements were repeated. Considering this scenario, they come to you for performing and interpretating the data they collected. You decide to keep the level of significance at P < 0.05.
Q4. Will you check for normality of the data (yes/no) and why?
No, no scale variable
Version – Exercise 6: Scenario: A group of researchers at a Midwestern University in Australia measured blood pressure for 120 patients and coded the data as “normal” and “hypertension”. They first took the measurements at enrolment (baseline) and then made the participants complete a 2-hour medication and aromatherapy session. At the end of the session, blood pressure measurements were repeated. Considering this scenario, they come to you for performing and interpretating the data they collected. You decide to keep the level of significance at P < 0.05.
Q5. What will be the most appropriate test(s) for analysing this data?
McNemar Test
Version – Exercise 6: Scenario: A group of researchers at a Midwestern University in Australia measured blood pressure for 120 patients and coded the data as “normal” and “hypertension”. They first took the measurements at enrolment (baseline) and then made the participants complete a 2-hour medication and aromatherapy session. At the end of the session, blood pressure measurements were repeated. Considering this scenario, they come to you for performing and interpretating the data they collected. You decide to keep the level of significance at P < 0.05.
Q6. Based on your choice of test, what NULL hypothesis can you make for the present scenario?
H₀: There is no difference in the proportion in blood pressure classification before and after the intervention.
Version – Exercise 6: Scenario: A group of researchers at a Midwestern University in Australia measured blood pressure for 120 patients and coded the data as “normal” and “hypertension”. They first took the measurements at enrolment (baseline) and then made the participants complete a 2-hour medication and aromatherapy session. At the end of the session, blood pressure measurements were repeated. Considering this scenario, they come to you for performing and interpretating the data they collected. You decide to keep the level of significance at P < 0.05.
Q7. Based on your choice of test, what ALTERNATIVE hypothesis can you make for the present scenario?
H₁: There is a difference in the proportion in blood pressure classification after the intervention.
Version – Exercise 6: Scenario: A group of researchers at a Midwestern University in Australia measured blood pressure for 120 patients and coded the data as “normal” and “hypertension”. They first took the measurements at enrolment (baseline) and then made the participants complete a 2-hour medication and aromatherapy session. At the end of the session, blood pressure measurements were repeated. Considering this scenario, they come to you for performing and interpretating the data they collected. You decide to keep the level of significance at P < 0.05.
Q8. You now perform the appropriate test in SPSS and get the following output table. Write the assumptions.
2x2, paired, binary nominal
Version – Exercise 6: Scenario: A group of researchers at a Midwestern University in Australia measured blood pressure for 120 patients and coded the data as “normal” and “hypertension”. They first took the measurements at enrolment (baseline) and then made the participants complete a 2-hour medication and aromatherapy session. At the end of the session, blood pressure measurements were repeated. Considering this scenario, they come to you for performing and interpretating the data they collected. You decide to keep the level of significance at P < 0.05.
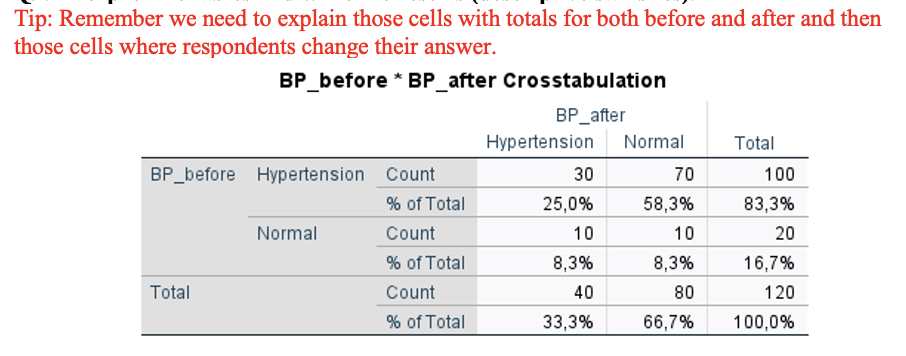
Q9. Interpret the tables and write the results (descriptive statistics).
Before the session, 83.3% (100 out of 120) of participants had hypertension, and 16.7% (20 out of 120) had normal blood pressure.
After the session, 66.7% (80 out of 120) had normal blood pressure, while 33.3% (40 out of 120) had hypertension.
70 people when from hypertension to normal and 10 people when from normal to hypertension
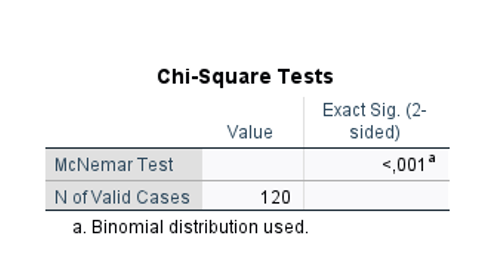
Version – Exercise 6: Scenario: A group of researchers at a Midwestern University in Australia measured blood pressure for 120 patients and coded the data as “normal” and “hypertension”. They first took the measurements at enrolment (baseline) and then made the participants complete a 2-hour medication and aromatherapy session. At the end of the session, blood pressure measurements were repeated. Considering this scenario, they come to you for performing and interpretating the data they collected. You decide to keep the level of significance at P < 0.05.
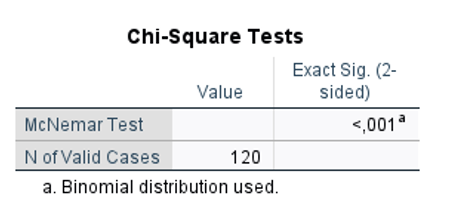
Q10. Interpret the table and write the results (INFERENTIAL STATISTICS).
A McNemar test showed a significant change in blood pressure classification after the intervention, p < 0.001.
Version – Exercise 6: Scenario: A group of researchers at a Midwestern University in Australia measured blood pressure for 120 patients and coded the data as “normal” and “hypertension”. They first took the measurements at enrolment (baseline) and then made the participants complete a 2-hour medication and aromatherapy session. At the end of the session, blood pressure measurements were repeated. Considering this scenario, they come to you for performing and interpretating the data they collected. You decide to keep the level of significance at P < 0.05.
Q11. Which graphical illustration would be best suited in this scenario?
bar chart
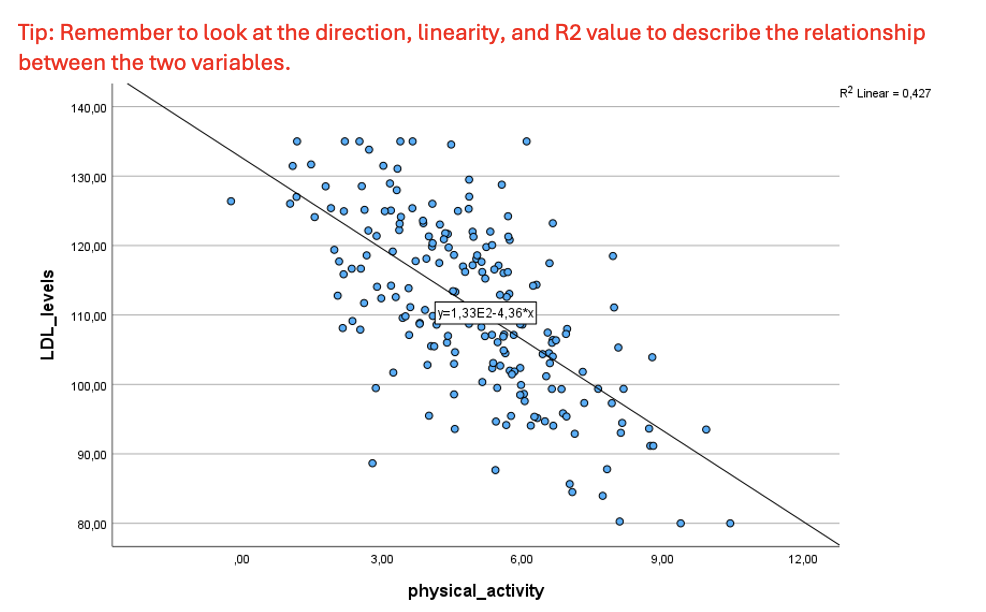
Version – Exercise 7: Scenario: A cardiology research team at Mass General Hospital, Boston, US is studying the effects of physical activity (hours/day) on lipid profiles, specifically focusing on low-density lipoprotein cholesterol (LDL; mg/dl) levels, also known as the "bad cholesterol." The team hypothesizes that there should be a relationship between these two variables, especially in preventing cardiovascular diseases. They enroll 200 patients and take their measurements for physical activity and LDL levels. Considering this scenario, they come to you to perform and interpret the data they collected. You decide to keep the level of significance at P < 0.05.
Q1. What kind of variable is physical activity (hours/day)?
Continuous scale variable
Version – Exercise 6: Scenario: A cardiology research team at Mass General Hospital, Boston, US is studying the effects of physical activity (hours/day) on lipid profiles, specifically focusing on low-density lipoprotein cholesterol (LDL; mg/dl) levels, also known as the "bad cholesterol." The team hypothesizes that there should be a relationship between these two variables, especially in preventing cardiovascular diseases. They enroll 200 patients and take their measurements for physical activity and LDL levels. Considering this scenario, they come to you to perform and interpret the data they collected. You decide to keep the level of significance at P < 0.05.
Q2. What kind of variable is LDL levels (mg/dl)?
Continuous scale variable
Version 2 – Exercise 7: Scenario: A cardiology research team at Mass General Hospital, Boston, US is studying the effects of physical activity (hours/day) on lipid profiles, specifically focusing on low-density lipoprotein cholesterol (LDL; mg/dl) levels, also known as the "bad cholesterol." The team hypothesizes that there should be a relationship between these two variables, especially in preventing cardiovascular diseases. They enroll 200 patients and take their measurements for physical activity and LDL levels. Considering this scenario, they come to you to perform and interpret the data they collected. You decide to keep the level of significance at P < 0.05.
Q3. What kind of data is presented to you?
unpaired data
Version 2– Exercise 7: Scenario: A cardiology research team at Mass General Hospital, Boston, US is studying the effects of physical activity (hours/day) on lipid profiles, specifically focusing on low-density lipoprotein cholesterol (LDL; mg/dl) levels, also known as the "bad cholesterol." The team hypothesizes that there should be a relationship between these two variables, especially in preventing cardiovascular diseases. They enroll 200 patients and take their measurements for physical activity and LDL levels. Considering this scenario, they come to you to perform and interpret the data they collected. You decide to keep the level of significance at P < 0.05.
Q4. What will be the most appropriate test(s) for analysing this data?
Spearman’s correlation
(non-parametric)
Pearson’s correlation (parametric).
Version 2– Exercise 7: Scenario: A cardiology research team at Mass General Hospital, Boston, US is studying the effects of physical activity (hours/day) on lipid profiles, specifically focusing on low-density lipoprotein cholesterol (LDL; mg/dl) levels, also known as the "bad cholesterol." The team hypothesizes that there should be a relationship between these two variables, especially in preventing cardiovascular diseases. They enroll 200 patients and take their measurements for physical activity and LDL levels. Considering this scenario, they come to you to perform and interpret the data they collected. You decide to keep the level of significance at P < 0.05.
Q5. Based on your choice of test, what NULL hypothesis can you make for the present scenario?
H₀: There is no correlation between physical activity and LDL levels
Version 2– Exercise 7: Scenario: A cardiology research team at Mass General Hospital, Boston, US is studying the effects of physical activity (hours/day) on lipid profiles, specifically focusing on low-density lipoprotein cholesterol (LDL; mg/dl) levels, also known as the "bad cholesterol." The team hypothesizes that there should be a relationship between these two variables, especially in preventing cardiovascular diseases. They enroll 200 patients and take their measurements for physical activity and LDL levels. Considering this scenario, they come to you to perform and interpret the data they collected. You decide to keep the level of significance at P < 0.05.
Q6. Based on your choice of test, what ALTERNATIVE hypothesis can you make for the present scenario?
H₁: There is a correlation between physical activity and LDL
Version2 – Exercise 7: Scenario: A cardiology research team at Mass General Hospital, Boston, US is studying the effects of physical activity (hours/day) on lipid profiles, specifically focusing on low-density lipoprotein cholesterol (LDL; mg/dl) levels, also known as the "bad cholesterol." The team hypothesizes that there should be a relationship between these two variables, especially in preventing cardiovascular diseases. They enroll 200 patients and take their measurements for physical activity and LDL levels. Considering this scenario, they come to you to perform and interpret the data they collected. You decide to keep the level of significance at P < 0.05.
Q7. You now perform the appropriate test in SPSS and get the following graph. Analyse the graph and what does it tell you about the relationship between the variables.
R² =0.427, >0,300; linear trendline; negative trendline
—> linear relationship.(parametric)
Version 2– Exercise 7: Scenario: A cardiology research team at Mass General Hospital, Boston, US is studying the effects of physical activity (hours/day) on lipid profiles, specifically focusing on low-density lipoprotein cholesterol (LDL; mg/dl) levels, also known as the "bad cholesterol." The team hypothesizes that there should be a relationship between these two variables, especially in preventing cardiovascular diseases. They enroll 200 patients and take their measurements for physical activity and LDL levels. Considering this scenario, they come to you to perform and interpret the data they collected. You decide to keep the level of significance at P < 0.05.
Q8. Which test you choose and why?
Pearson’s correlation, >0,300 linear relationship
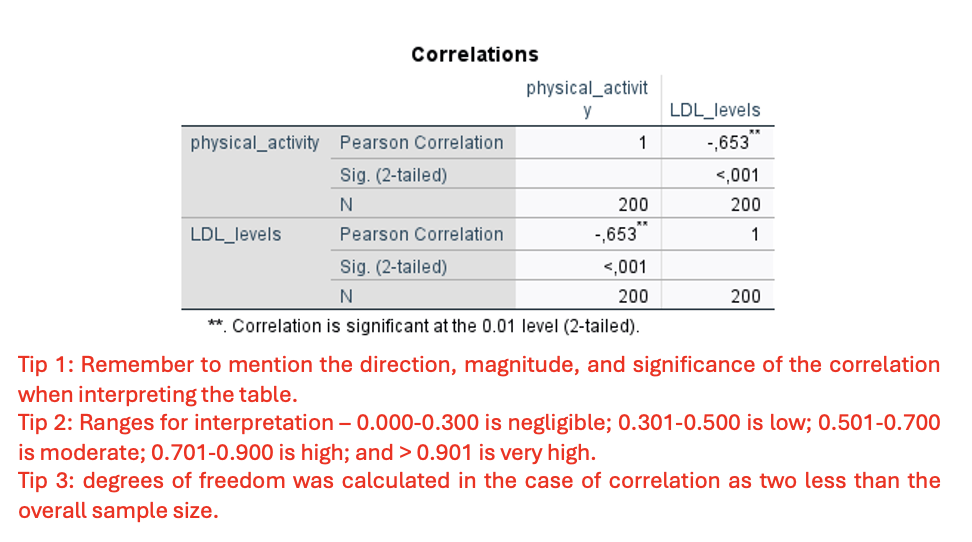
Version 2– Exercise 7: Scenario: A cardiology research team at Mass General Hospital, Boston, US is studying the effects of physical activity (hours/day) on lipid profiles, specifically focusing on low-density lipoprotein cholesterol (LDL; mg/dl) levels, also known as the "bad cholesterol." The team hypothesizes that there should be a relationship between these two variables, especially in preventing cardiovascular diseases. They enroll 200 patients and take their measurements for physical activity and LDL levels. Considering this scenario, they come to you to perform and interpret the data they collected. You decide to keep the level of significance at P < 0.05.
Q9. Interpret the results from the correlation table (inferential statistics).
Direction: Negative; Pearson Correlation r= -0,653
Magnitude: Moderate to strong 0.653 (falls in 0.501–0.700 range)
Significance: Statistically significant (p < 0.001), reject Ho, not normally distribution
A Pearson correlation showed a statistically significant, moderate negative correlation between physical activity and LDL levels (rho (200-2=198) = -0.653, p < 0.001).
Version 1&2 – Exercise 8: Scenario: A group of occupation medicine specialists wanted to explore sleep status and hypertension among oil workers in Xinjiang, China. They interviewed 3,040 workers in six oil field bases in Karamay City to analyse the association between hypertension and sleep quality and gender. Considering their aim, they asked you to construct a regression model to predict hypertension (yes or no) from gender (male or female) and sleep quality (poor or good). You decided to keep the level of significance at P < 0.05.
Q1. Which of these variables would you put on the Y axis of the model?
Hypertension
y=k+x
It is the dependent (outcome) variable being predicted (yes/no =1/0).
Version 1&2 – Exercise 8: Scenario: A group of occupation medicine specialists wanted to explore sleep status and hypertension among oil workers in Xinjiang, China. They interviewed 3,040 workers in six oil field bases in Karamay City to analyse the association between hypertension and sleep quality and gender. Considering their aim, they asked you to construct a regression model to predict hypertension (yes or no) from gender (male or female) and sleep quality (poor or good). You decided to keep the level of significance at P < 0.05.
Q2. Which of these variables would you put on the X axis of the model?
Gender and Sleep Quality
Version 1&2 – Exercise 8: Scenario: A group of occupation medicine specialists wanted to explore sleep status and hypertension among oil workers in Xinjiang, China. They interviewed 3,040 workers in six oil field bases in Karamay City to analyse the association between hypertension and sleep quality and gender. Considering their aim, they asked you to construct a regression model to predict hypertension (yes or no) from gender (male or female) and sleep quality (poor or good). You decided to keep the level of significance at P < 0.05.
Q3. Based on the independent X axis variables, what is the minimum sample size required to run the model?
200
2 predictor variables (gender, sleep quality).
Requiring 50 cases + 50 controls per variable
Version 1&2– Exercise 8: Scenario: A group of occupation medicine specialists wanted to explore sleep status and hypertension among oil workers in Xinjiang, China. They interviewed 3,040 workers in six oil field bases in Karamay City to analyse the association between hypertension and sleep quality and gender. Considering their aim, they asked you to construct a regression model to predict hypertension (yes or no) from gender (male or female) and sleep quality (poor or good). You decided to keep the level of significance at P < 0.05.
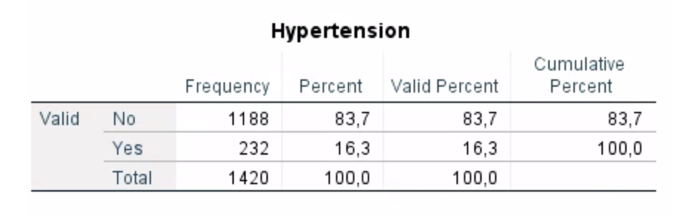
Q4. Look at the descriptive box below and describe (a) whether minimum sample size criteria is met; (b) whether we have enough % of Y axis responses that indicate the event of interest?
a) Criteria for minimum sample size is met, because we have 1420 and we need minimal 200.
b) We needed 15% and we have 16.3% of responses are “Yes”, so it’s met
Version 1&2– Exercise 8: Scenario: A group of occupation medicine specialists wanted to explore sleep status and hypertension among oil workers in Xinjiang, China. They interviewed 3,040 workers in six oil field bases in Karamay City to analyse the association between hypertension and sleep quality and gender. Considering their aim, they asked you to construct a regression model to predict hypertension (yes or no) from gender (male or female) and sleep quality (poor or good). You decided to keep the level of significance at P < 0.05.
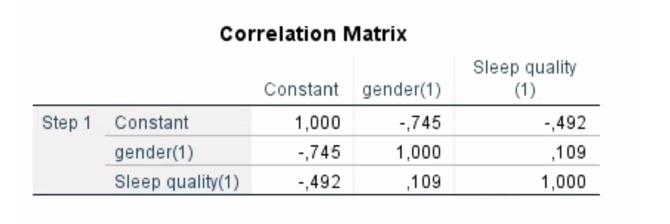
Q5. Look at the results from correlation matrix. Assess whether you have violated the conditions of multi-collinearity or not.
The correlation between predictors is r=0,109, which is <0.8, no multicollinearity
Version 1&2– Exercise 8: Scenario: A group of occupation medicine specialists wanted to explore sleep status and hypertension among oil workers in Xinjiang, China. They interviewed 3,040 workers in six oil field bases in Karamay City to analyse the association between hypertension and sleep quality and gender. Considering their aim, they asked you to construct a regression model to predict hypertension (yes or no) from gender (male or female) and sleep quality (poor or good). You decided to keep the level of significance at P < 0.05.
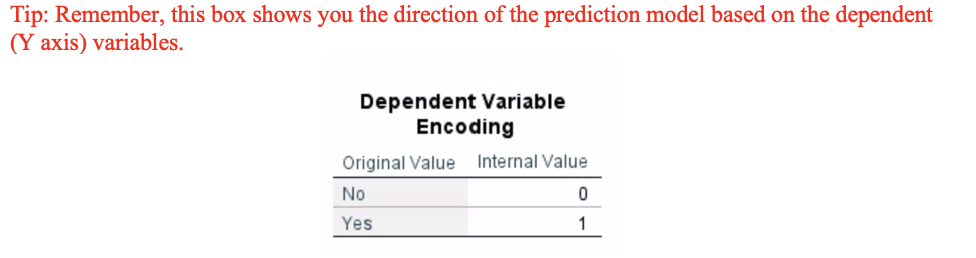
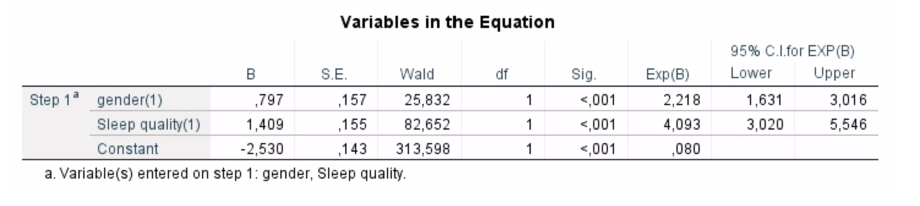
Q6. Look at the dependent encoding box and describe the direction of prediction model.
Odd on having hypertension in comaprison not having hypertesnion (Yes=1)
Version 1&2– Exercise 8: Scenario: A group of occupation medicine specialists wanted to explore sleep status and hypertension among oil workers in Xinjiang, China. They interviewed 3,040 workers in six oil field bases in Karamay City to analyse the association between hypertension and sleep quality and gender. Considering their aim, they asked you to construct a regression model to predict hypertension (yes or no) from gender (male or female) and sleep quality (poor or good). You decided to keep the level of significance at P < 0.05.
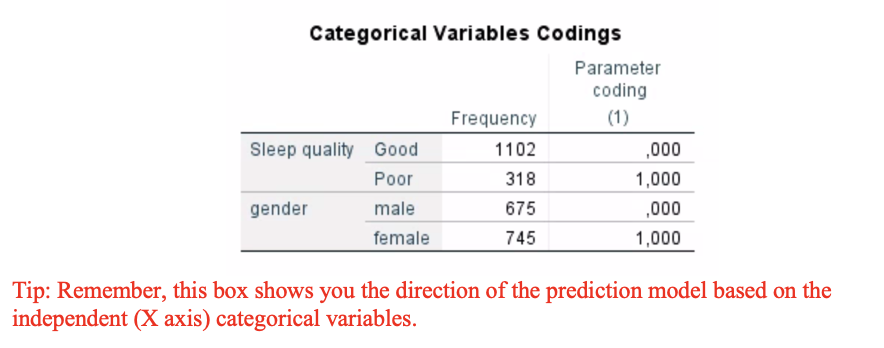
Q7. Look at the categorical encoding box and describe the direction of prediction model for (a) sleep quality; and (b) gender.
a) Sleep quality:
Good = 0 (reference), Poor = 1
Odd on having hypertension for poor sleep quality comparison to good sleep quality
b) Gender:
Male = 0 (reference), Female = 1
Odd of hypertension for females compared to males.
Version 1&2– Exercise 8: Scenario: A group of occupation medicine specialists wanted to explore sleep status and hypertension among oil workers in Xinjiang, China. They interviewed 3,040 workers in six oil field bases in Karamay City to analyse the association between hypertension and sleep quality and gender. Considering their aim, they asked you to construct a regression model to predict hypertension (yes or no) from gender (male or female) and sleep quality (poor or good). You decided to keep the level of significance at P < 0.05.
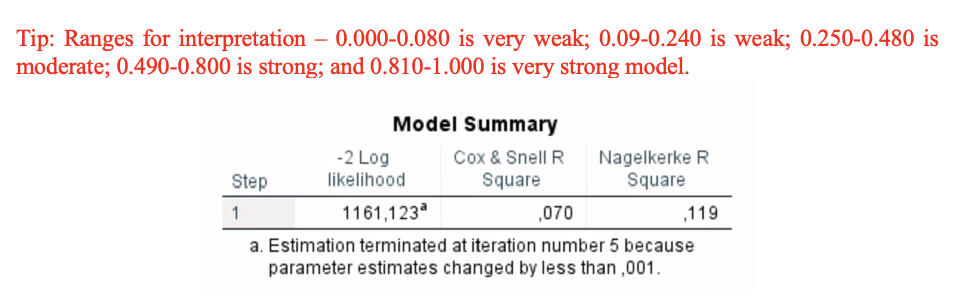
Q8. Assess the strength of the model. How much % of variability is explained in our model?
11.9% of variability in having hyperstension is explained by our model using Nagelkerke R² which is a weak model

Version 1&2– Exercise 8: Scenario: A group of occupation medicine specialists wanted to explore sleep status and hypertension among oil workers in Xinjiang, China. They interviewed 3,040 workers in six oil field bases in Karamay City to analyse the association between hypertension and sleep quality and gender. Considering their aim, they asked you to construct a regression model to predict hypertension (yes or no) from gender (male or female) and sleep quality (poor or good). You decided to keep the level of significance at P < 0.05.
Q9. Check the following tests for assessment of model performance over the null model.
Our model is significant different from the H0 model using Omnibus Chi sqare test χ² (2) = 103.34, p < 0.001
Our Ho model has no predictive power using Hosmer-Lemeshow test χ²(7) = 12.35, p = 0.090
Version 1&2– Exercise 8: Scenario: A group of occupation medicine specialists wanted to explore sleep status and hypertension among oil workers in Xinjiang, China. They interviewed 3,040 workers in six oil field bases in Karamay City to analyse the association between hypertension and sleep quality and gender. Considering their aim, they asked you to construct a regression model to predict hypertension (yes or no) from gender (male or female) and sleep quality (poor or good). You decided to keep the level of significance at P < 0.05.
Q10. Which is the stronger predictor for having hypertension and why?
Sleep quality is the stronger predictor than gender using Wald statistic (82.652)
Version 1&2– Exercise 8: Scenario: A group of occupation medicine specialists wanted to explore sleep status and hypertension among oil workers in Xinjiang, China. They interviewed 3,040 workers in six oil field bases in Karamay City to analyse the association between hypertension and sleep quality and gender. Considering their aim, they asked you to construct a regression model to predict hypertension (yes or no) from gender (male or female) and sleep quality (poor or good). You decided to keep the level of significance at P < 0.05.
Q11. Explain the odd’s ratio for (a) poor sleep quality; and (b) female gender.
(a) Poor sleep quality increases the odds of having hypertension by a factor of 4.093 times (95% CI: 3.020–5.546), p>0,001 than good sleep quality
(b) Being female increases the odds of having hypertension by a factor of 2.218 times (95% CI: 1.631–3.016), p>0,001 than males.
Version 1&2– Exercise 8: Scenario: A group of occupation medicine specialists wanted to explore sleep status and hypertension among oil workers in Xinjiang, China. They interviewed 3,040 workers in six oil field bases in Karamay City to analyse the association between hypertension and sleep quality and gender. Considering their aim, they asked you to construct a regression model to predict hypertension (yes or no) from gender (male or female) and sleep quality (poor or good). You decided to keep the level of significance at P < 0.05.
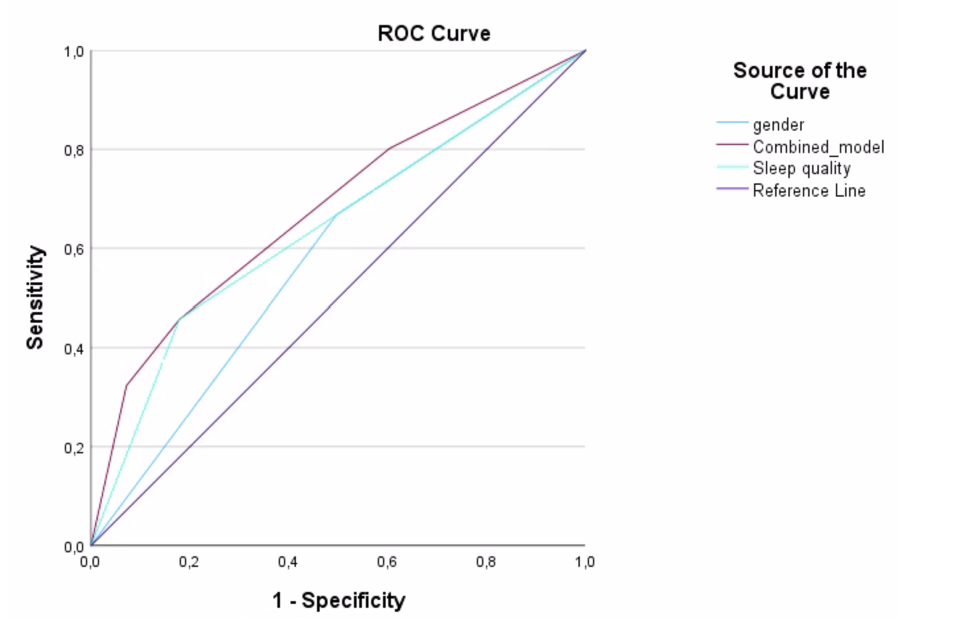
Q12. Visually analyse the ROC curves for the gender alone, sleep quality alone, and combined model for predicting hypertension. Rate the 3 models in order from best to worst in predictive power and justify your choice?
Combined model>Sleep quality>Gender (best to worst)
sleep quality is closer to upper left corner and higher area under graph
Version 1&2– Exercise 8: Scenario: A group of occupation medicine specialists wanted to explore sleep status and hypertension among oil workers in Xinjiang, China. They interviewed 3,040 workers in six oil field bases in Karamay City to analyse the association between hypertension and sleep quality and gender. Considering their aim, they asked you to construct a regression model to predict hypertension (yes or no) from gender (male or female) and sleep quality (poor or good). You decided to keep the level of significance at P < 0.05.
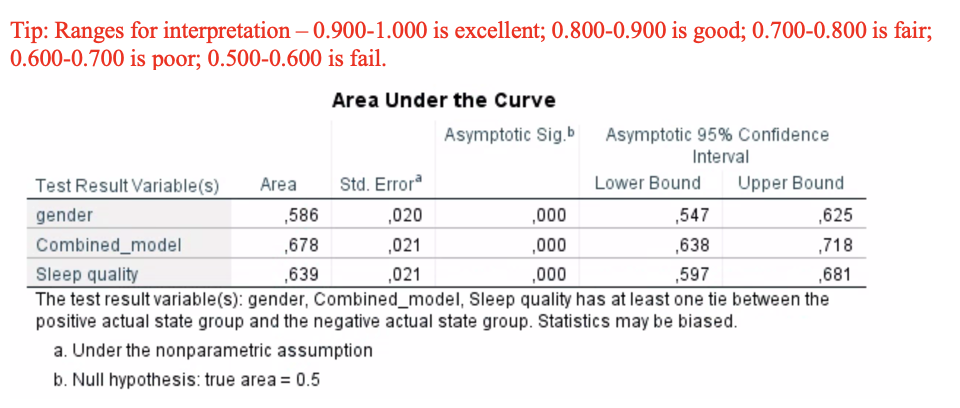
Q13. Use this Area under the curve (AUC) table to further explain the model accuracy.
Gender fails as a predictor for hypertension, AUC= 0,586 (95% CI: 0,547-0,625), p<0,001.
Combined model is a poor predictor for hypertension, AUC=0,678 (95% CI: 0,638-0,718),p<0,001.
Sleep quality is a poor predictor for hypertension, AUC=0,639 (95% CI: 0,597-0,681),p<0,001.