Inferential statistics
1/22
There's no tags or description
Looks like no tags are added yet.
Name | Mastery | Learn | Test | Matching | Spaced | Call with Kai |
|---|
No study sessions yet.
23 Terms
Significance:
means probably true (not due to chance)
Power:
increase chances of rejecting a false null hypothesis
What is probability:
Likelihood of something occurring
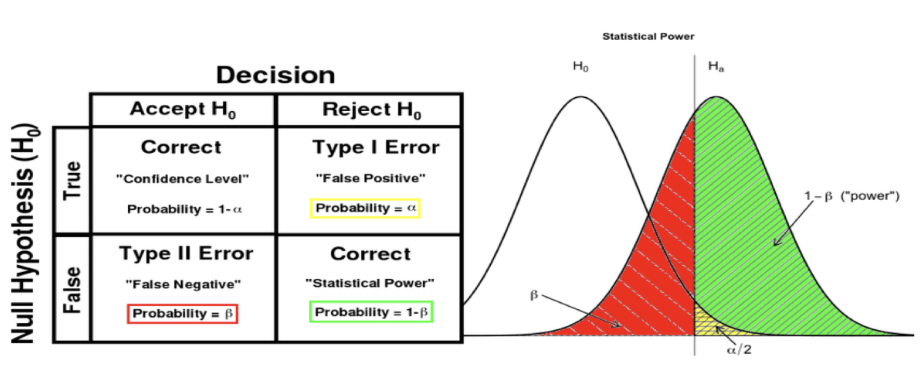
Type I error:
we reject the null hypothesis in our sample, even though the null hypothesis is true for the population
By reducing risk of type I error, we increase chance of type II error
Type II error:
we retain the null hypothesis in our sample, even through the null hypothesis is false for the population (worse)
Decrease type II error by: increasing treatment effects, decreasing measurement error, using a more sensitive design
P<.05:
we are making a type I error less than 5 times out of 100
What is done to control error:
Reduce type I error by reducing significance level
Trade off is increasing risk of type II error and losing power
General Linear Model : basis for most statistical analyses in social research:
A system of equations that is used as the mathematical framework for most the statistical analyses used in applied social research
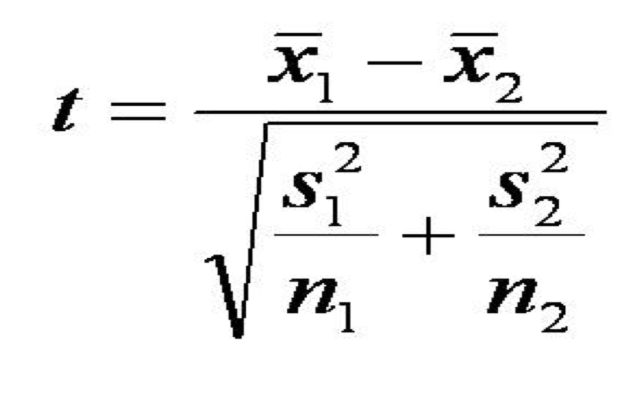
T-test:
good statistical procedure to see if means of two groups are significantly different
**How to test for significance:
Statement of the null hypothesis: assumption is there is nothing going on
Establishing the level of risk associated with the null hypothesis
Selection of the appropriate statistical test
Computation of the test statistic value
Determination of the value needed for rejection of the null hypothesis using the appropriate table of critical values for the particular statistic
Comparison of the obtained value to the critical value
If the obtained value is more extreme than the critical value, the null hypothesis cannot be accepted
If the obtained value does not exceed the critical value, the null hypothesis is the most attractive explanation
Explain how to increase the power of a t-test:
Power: increasing probability of rejecting null hypothesis when null hypothesis is actually false
**Increasing power in a t-test:
Show a greater difference in the means of the two groups by using a better and stronger treatment
Reduce variance in groups by applying treatments and using control variables to reduce difference between participants
Increase number of subjects in study
When T is found to be significant, we are saying that the true variance exceeds the error variance
Check to see if a correlation is significant:
Choose desired significance level .05 or .01
Determine degrees of freedom (number of subjects corrected for sample bias) N-2
**10 subjects at significance of .05 level and you find a correlation of .54
Now check Critical value table: Df(8)= .6319
**Since correlation is less than critical value, your correlation is not significant
Factors in using correlations to infer (sample size, p level, coefficient of determination):
Sample size – Larger samples provide more stable and reliable correlation estimates.
p-level (statistical significance) – Indicates whether the correlation is likely due to chance.
Coefficient of determination (r²) – Shows how much variance in one variable is explained by the other.
ANOVA:
analysis of variance (the ANOVA helps keep the significance level)
A large treatment effect + within group variability = > 1.0
F values and rejecting the null:
If the null hypothesis is true, we expect an F value of 1.0
If the null hypothesis is rejected, it is because the F value is significantly larger than 1.0
Do a Chi-square calculation and determine significance of the research:
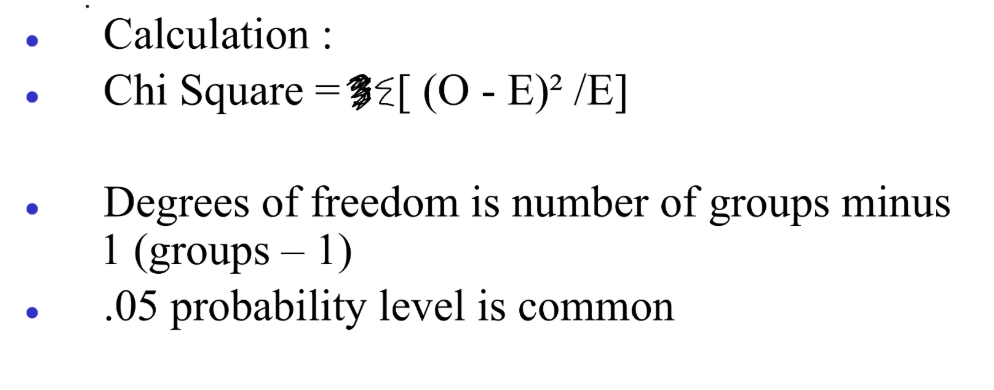
Restrictions in using the Chi-Square test:
Requirement / Restriction | Explanation |
Data must be frequencies | Cannot use means or percentages |
Independent observations | No one counted twice; no paired samples |
Minimum expected cell size | ≥ 1 for all cells; ≥ 5 for most cells |
Sufficiently large sample | Needed to approximate Chi-Square distribution |
Mutually exclusive categories | Each observation belongs to only one category |
Cannot infer strength or direction | Only tests association or difference |
Concept of significance versus meaningfulness:
Statistical significance in and of itself is not very meaningful unless the study has a sound conceptual base that lends some meaning to the significance of the outcome
Statistical significance cannot be interpreted independently of the context within which it occurs
While statistical significance is important as a concept, it is not the end-all. This is why we test hypotheses, not try to prove them
Explain concept of why we use .05 significance level:
A Type I error = rejecting the null hypothesis when it is actually true.
Setting α = .05 means:
We accept a 5% chance of falsely concluding that there is an effect or difference when there really isn’t.
In the long run, if we repeated the study many times, only 5% of tests would incorrectly show significance when H₀ is true.
So α = .05 is a balance between being too strict and too lenient.
Explain concept of degrees of freedom:
Total participants in investigation minus number of groups in study
N-2
Explain what we can and cannot conclude from a significance test:
A significance test CAN tell us… | A significance test CANNOT tell us… |
Whether to reject H₀ | Whether H₀ is true |
Whether the result is unlikely by chance | If the effect is large or meaningful |
If evidence supports an effect/relationship | If the result proves causation |
Direction of the effect (one-tailed) | The probability H₁ is true |
Conclusions beyond the sampled population |