Intro to T-scores
1/13
There's no tags or description
Looks like no tags are added yet.
Name | Mastery | Learn | Test | Matching | Spaced | Call with Kai |
|---|
No analytics yet
Send a link to your students to track their progress
14 Terms
what are the assumptions for hypothesis tests with z-scores
random sampling, independent observations, variability is unchanged by experimental manipulation even if mean is changed, normal distribution of sample means
what is the problem with z-scores
in most cases when we collect a sample, we don’t know the parameters of the population from which it came
what does calculating a z score of a sample rely on
knowing the population standard deviation
what are t scores used for
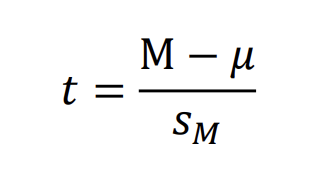
used to test hypotheses when the population standard deviation is unknown, has the same structured as the z score but uses the estimated Standard error instead of the standard error
what is the formula for t scores
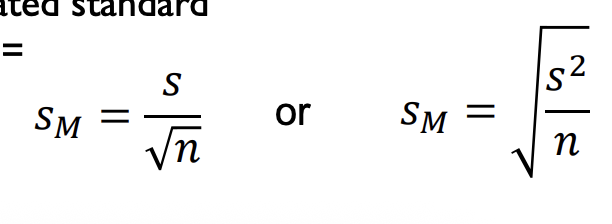
what is the estimated standard error
what are the characteristics of t-distribution
bell shaped, symmetrical, NOT normal, mean of 0, flatter and more spread out tails than normal distribution
what happens when n gets larger in a t distribution
df gets larger and the t distribution gets more normal
what are the two major differences between hypothesis testing with zscores and t-scores
1. The t statistic is used when we don’t know the population variance/standard deviation: We must use the sample variance/standard deviation to estimate 2. The shape of the t distribution is not normal: It changes depending on degrees of freedom and We must use the t-statistic table and the df to determine the critical values
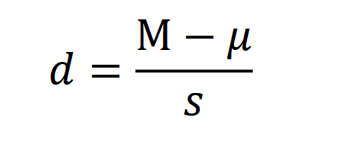
what is the formula for Cohen’s d
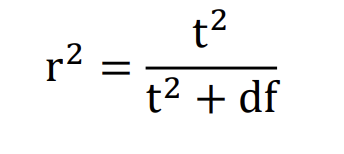
what is the effect size r²
it describes the “percentage of variance explained” by the effect
what is the range of effect size r²
Ranges from 0 to 1.0
• 0 < r² < 0.09 = small
• 0.09 < r² < 0.25 = medium
• 0.25 < r² = large
what are the Two methods for calculating r²
Brute Force and Simple Method
what is the formula for calculating r² using the simpler method