Fin300 Chapter 10
1/13
There's no tags or description
Looks like no tags are added yet.
Name | Mastery | Learn | Test | Matching | Spaced |
|---|
No study sessions yet.
14 Terms
How to measure risk
Use the forward-looking variance of the returns as an initial measure of an asset’s volatility. It gives you the squared percent volatility, so take the square root to get the standard deviation and get the actual percent volatility.
The variance and standard deviation measure the total risk, both systematic and unsystematic, of a stock.
Portfolio
A collection of assets.
Portfolio weights
The fractions of the total investment you allocate to each asset class.
wi = dollars invested in asset i / total dollars invested in the portfolio
Portfolio weights must all sum to 1.
Calculating portfolio state contingent returns
Multiply the portfolio weights of each stock by the expected return of each stock. You will get 2 values, one for state 1 and one for state 2. Those are the expected returns of the portfolio.
Market Portfolio
The maximally diversified portfolio. It’s only a theory because no one can hold it in real life. Holding the true market portfolio is impossible because many private risky assets do not have tradeable claims that the general public can hold.
Portfolios like the S&P 500 and NASDAQ serve as proxies for the market portfolio.
Investors holding the market don’t care about individual company or even industry risks because they have no average impact on the portfolio’s value (you have thousands of other uncorrelated stocks). These diversifiable risks are called: asset-specific, unique, idiosyncratic, unsystematic risks because they do not change values beyond a single or a small number of assets.
Risks like tax changes, geopolitical risks, inflation, etc. are changes that affect almost every business in the economy. They are nondiversifiable. These risks are called market/systematic risks.
The market variance and standard deviation reflect only systematic risk as there is no unsystematic risk in the market portfolio.
Dow-Jones Industrial Average
A portfolio of 30 companies considered market leaders in their respective industries.
It’s price weighted instead of value-weighted, meaning the company with the highest stock price gets the most weight. If it used value weighting, NVIDIA would be at the top with a $5 trillion market cap instead of ranking 23rd on price.
Prestige of NYSE vs Nasdaq companies
Generally, companies listed on the NYSE are more prestigious than those on Nasdaq (Apple and Microsoft are the big exceptions).
Systematic Risk Principle
The market rewards investors for bearing the risks they can’t avoid through diversification and not for the ones they can.
Investors earn basis points for accepting systematic risk and not a penny for any asset-specific risk they take on.
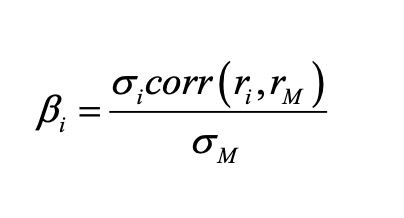
Beta coefficient
A measure of an asset’s sensitivity to systematic risks.
Beta measures asset i’s sensitivity to market risk in the numerator and that of the average asset (represented by the market) in the denominator. So the beta coefficient is a unitless measure of relative systematic risk. If an asset moves more than the average because of a market event, its beta will be greater than one. If an asset is less sensitive to market shocks, its beta will be less than one.
A riskless security has beta of 0.
The beta of the market portfolio and its proxies is 1.
Theoretically, the beta coefficient is forward-looking but we usually estimate it with an OLS regression using past data.
Regression and Beta
An asset’s systematic risk coefficient is the same beta as the regression’s slope coefficient (that’s why it’s also called beta).
The R² value tells us how much of the variation in a specific stock is explained by market variation (how much risk is systematic).
As data becomes more densely packed around the line, the regression’s R-square will increase, as will the proportion of a stock’s total risk due to systemic events.
Calculating the Beta of a portfolio
A portfolio’s beta is the value-weighted average of the asset betas inside of it. So just multiply the beta for each asset by their portfolio weight and add together.
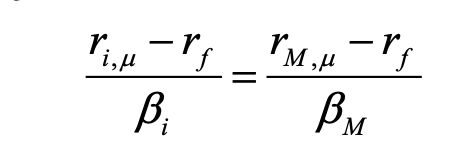
Reward-to-risk ratio
In equilibrium, all assets have the same reward-to-risk ratio in a semi strong efficient market.
Mu subscript denotes an expected value.
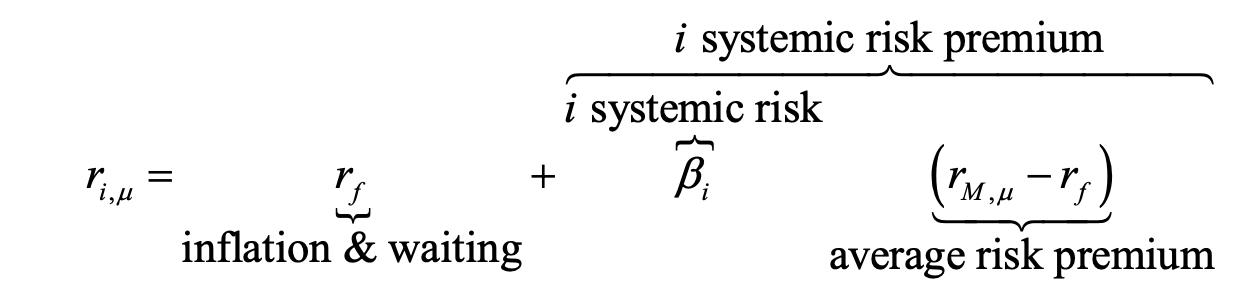
Capital Asset Pricing Model (CAPM)
CAPM measures the risk through beta and predicts the reward as the expected risk premium beyond what an asset pays for expected inflation and waiting.
Any asset’s expected return is a function of three factors:
The riskless rate
The market risk premium: the economy’s average compensation to bear systematic risk
The asset’s beta coefficient
Aka the Security Market Line (SML) because the asset’s expected return is a linear function of its beta.
Security Market Line
Assets that lie above the SML are positive NPV because they are priced too low. That’s why their expected return is higher than it should be given the same reward-to-risk ratio.
Assets that lie below the SML are negative NPV because they are priced too high. That’s why their expected return is lower than it should be given the same reward-to-risk ratio.
Assets that lie on the SML are 0 NPV and therefore also represent the internal rate of return.