AP Stats - Unit 1
0.0(0)
Studied by 40 peopleCard Sorting
1/44
There's no tags or description
Looks like no tags are added yet.
Last updated 5:21 AM on 9/21/22
Name | Mastery | Learn | Test | Matching | Spaced | Call with Kai |
|---|
No analytics yet
Send a link to your students to track their progress
45 Terms
1
New cards
frequency
count
2
New cards
relative frequency
Percentage or proportion of the whole number of data.
3
New cards
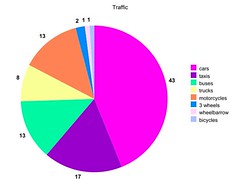
pie chart
a circular chart divided into triangular areas proportional to the percentages of the whole
4
New cards
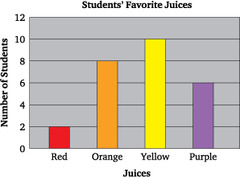
bar graph
a graph that uses vertical or horizontal bars to show comparisons among two or more items
spaces between the bars
categorical variables on the x-axis
spaces between the bars
categorical variables on the x-axis
5
New cards
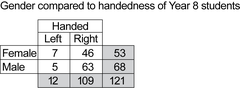
two-way table
A table containing counts for two categorical variables. It has r rows and c columns.
6
New cards
marginal relative frequency
Gives the percent or proportion of individuals that have a specific value for one categorical variable on a two-way table
7
New cards
joint relative frequency
gives the percent or proportion of individuals that have a specific value for one categorical variable and a specific value for another categorical variable on a two-way table
8
New cards
conditional relative frequency
gives the percent or proportion of individuals that have a specific value for one categorical variable among individuals who share the same value of another categorical variable (the condition)
9
New cards
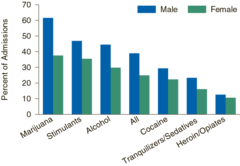
side-by-side bar graph
Used to compare the distribution of a categorical variable in each of several groups. For each value of the categorical variable, there is a bar corresponding to each group. The height of each bar is determined by the count or percent of individuals in the group with that value.
10
New cards
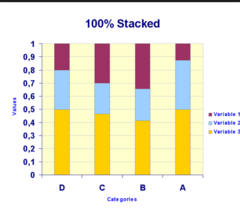
segmented bar graph
a bar graph stacked on top of another bar graph (not mosaic)
11
New cards
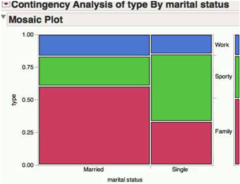
mosaic plot
a modified segmented bar graph in which the width of each rectangle is proportional to the number of individuals in the corresponding category
12
New cards
association
between two variables if knowing the value of one variable helps predict the value of another
13
New cards
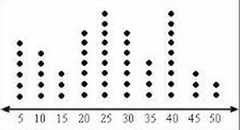
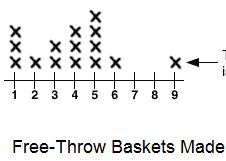
Dot Plot
a graphical device that summarizes data by the number of dots above each data value on the horizontal axis
14
New cards
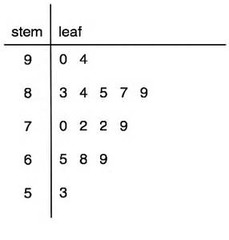
stem plot
A graphical display of quantitative data that involves splitting the individual values into two components
represents frequency of data points
represents frequency of data points
15
New cards
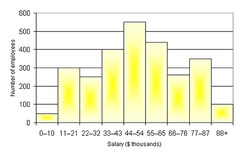
histogram
A graph of vertical bars representing the frequency distribution of a set of data.
16
New cards
symmetric
Being equal or the same in size, shape, and relative position

17
New cards
skewed left
the tail to the left of the peak is longer than the tail to the right of the peak

18
New cards
skewed right
the tail to the right of the peak is longer than the tail to the left of the peak

19
New cards
shape
distribution of data (skew)
20
New cards
center
median/middle
21
New cards
variability
in a set of numbers, how widely dispersed the values are from each other and from the mean (range)
22
New cards
outliers
Numbers that are much greater or much less than the other numbers in the set
23
New cards
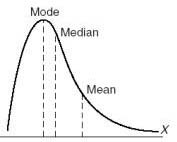
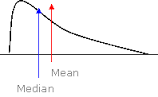
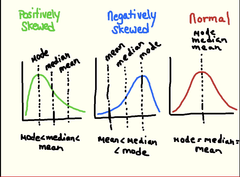
mean > median
skewed right
24
New cards
mean = median
symmetric
25
New cards
mean < median
skewed left
26
New cards
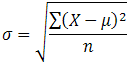
standard deviation
a measure of variability that describes an average distance of every score from the mean
27
New cards
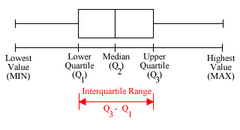
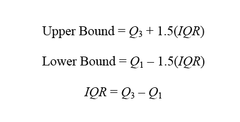
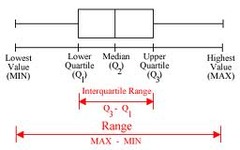
Interquartile Range (IQR)
A measure of variability, defined to be the difference between the third and first quartiles.
28
New cards
first quartile
the median of the lower half of the data set

29
New cards
third quartile
the median of the upper half of the data set
30
New cards
resistant
relatively unaffected by extreme observations
median and IQR
median and IQR
31
New cards
1.5 x IQR rule
identifies outliers as an individual value that falls more than 1.5 x IQR above the 3rd quartile or below the 1st quartile.
32
New cards
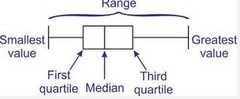
box plots
A data display that shows the five-number summary. The whiskers, stretching outward from the first quartile and third quartile as shown below, are no longer than 1.5 times the interquartile range (IQR). Outliers beyond that are marked separately.
33
New cards
five-number summary
minimum, 1st quartile, median, 3rd quartile, maximum

34
New cards
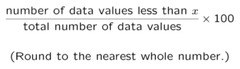
percentiles
# values ( = or < ) the given value / total values
35
New cards
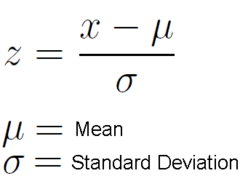
standardized scores (z score)
Known population standard deviation or variance?
The Z score give you the exact location of the score within the distribution
Z scores can be positive or negative
The Z score give you the exact location of the score within the distribution
Z scores can be positive or negative
36
New cards
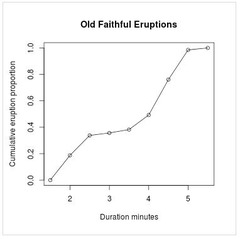
cumulative relative frequency
The term applies to an ordered set of observations from smallest to largest.
The sum of the relative frequencies for all values that are less than or equal to the given value.
The sum of the relative frequencies for all values that are less than or equal to the given value.
37
New cards
transform data
add and subtract:
- mean, 5#, percentiles change
- range, IQR, SD dont
multiply and divide
- center, location, variability change
shape never changes
- mean, 5#, percentiles change
- range, IQR, SD dont
multiply and divide
- center, location, variability change
shape never changes
38
New cards
density curve
a curve that is always on or above the horizontal axis and has area exactly 1 underneath it
estimates the proportion of observations that falls in an interval of values
estimates the proportion of observations that falls in an interval of values
39
New cards
mean of the density curve
the balance point, at which the curve would balance if made of solid material
40
New cards
standard deviation of a density curve
σ (sigma)

41
New cards
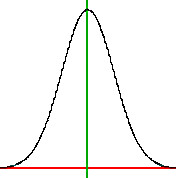
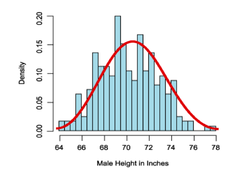
normal distributions
data representation with a distinctive bell-shaped curve, symmetric about the mean
42
New cards
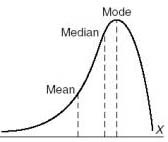
mean and median on density curves
equal if symmetric
mean is pushed toward the long tail if skewed
mean is pushed toward the long tail if skewed
43
New cards
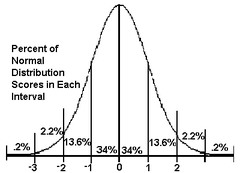
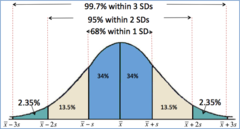
68-95-99.7 rule (empirical rule)
Within a normal distribution, 68% of scores will fall within +/- 1 standard deviation (SD) of the mean; 95% within 2 SDs of the mean; and 99.7% within 3 SDs of the mean.
(Almost all scores will fall between 3 SDs of the mean.)
(Almost all scores will fall between 3 SDs of the mean.)
44
New cards
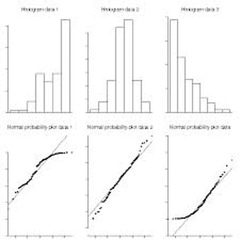
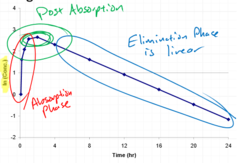
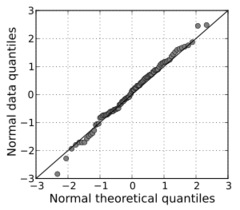
normal probability plot
Used to assess normality.
if it has a linear form
if it has a linear form
45
New cards
Skewed Probability Distribution
skewed left - curves on the right/ top
skewed right - curves on the left/bottom
skewed right - curves on the left/bottom