Standardization
1/14
There's no tags or description
Looks like no tags are added yet.
Name | Mastery | Learn | Test | Matching | Spaced | Call with Kai |
|---|
No analytics yet
Send a link to your students to track their progress
15 Terms
Bias:
systematic error in design or conduct of study that leads to incorrect estimate of association
can be caused by investigator or study participants during design or conduct of study
can occur in experimental, cohort, case-control, and other studies
few studies have no bias or errors
What are the effects of bias?
creates appearance of an association when there is none, or mask an association that really exists
selecting and information bias cannot be fixed in the analysis; confounding can be fixed…to a point
Crude rate:
total # of events divided by total # in population
unstandardized
Standardized (adjusted) rate:
rate that is adjusted for a characteristic (e.g. age-standardized rates) and is used to indicate how overall rates would have compared if the populations had the same distribution of characteristics
direct and indirect standardization
Crude data:
rate/risk is based on raw data
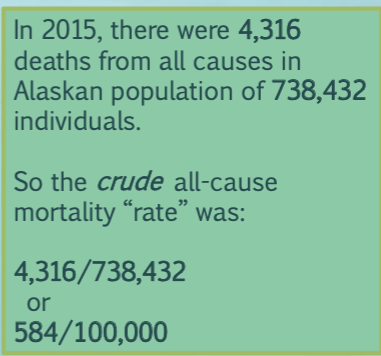
Crude All-Cause Mortality Rate:
total number of deaths from all causes per 100,000 population
over specified time period
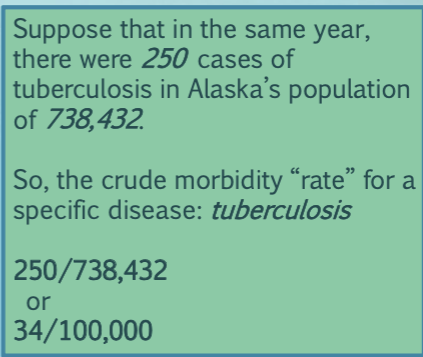
Crude Morbidity Rate for a Specific Disease:
number of cases of a disease per 100,000 population
over specified time period
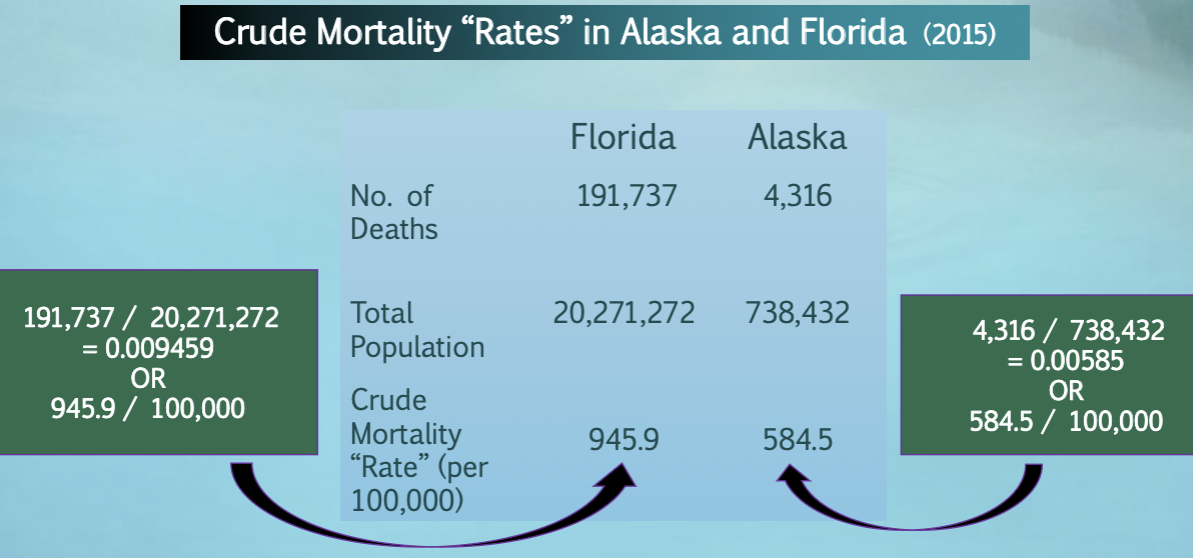
What if we wanted to compare crude rates?
we can conclude that crude mortality “rate” in Florida is much higher than the crude mortality “rate” in Alaska
but does that mean that the risk of death is truly higher in Florida?
the state populations differ with respect to underlying characteristics that affect overall death rate, and so we may be making an unfair comparison
Standardizing is a way to what?
is a way to control for confounding factors
What is the problem with comparing specific rates?
its cumbersome to compare five pairs of numbers and its not entirely clear which state has higher mortality
one age-specific “rate” is higher in Florida
four age-specific “rates” are higher in Alaska
What is the solution when comparing specific rates?
create a single number for each state that adjusts for age differences
age-adjusted rates
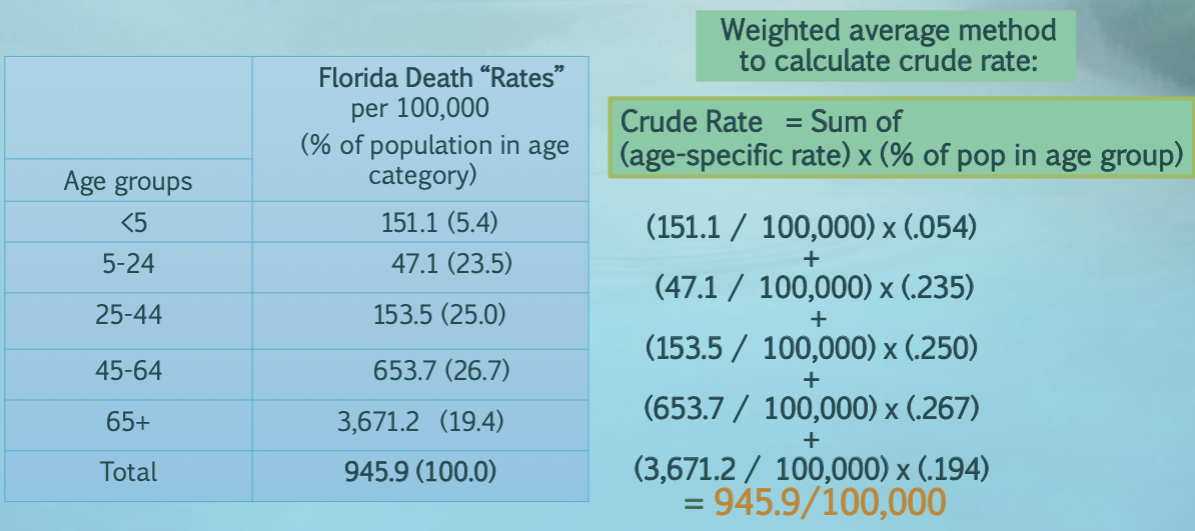
What is another way to calculate crude rates?
take the weighted average of age-specific rates, with weights equal to the proportion of the population in each category
How do we interpret age-adjusted rates?
adjusted rates are good only for comparison -- alone they are meaningless
the remaining difference between the two adjusted rates is not due to age
actual numbers will depend on the standard that is used
Direct standardization:
use when factor specific rates are known for both populations and calculate using population rate of disease and a standard distribution
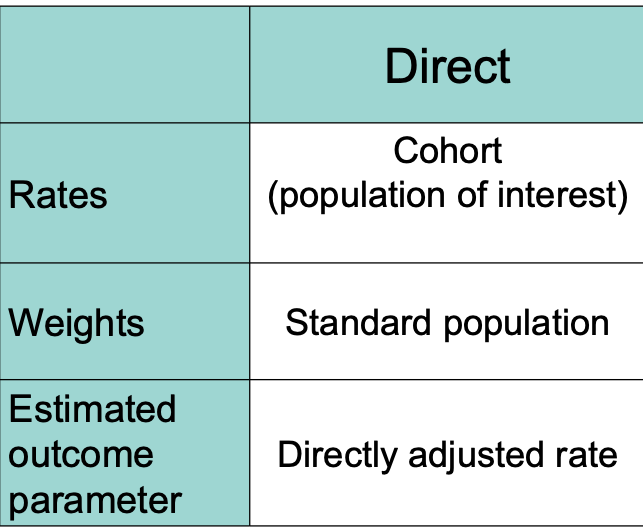
Summary of direct standardization:
provides summary rate that removes unwanted (usually age) differences between populations
less cumbersome than comparing many specific rates
however, adjusted rates are not real...their numeric value depends on the standard
thus, they are only good for comparison