GIS Exam 2
1/82
There's no tags or description
Looks like no tags are added yet.
Name | Mastery | Learn | Test | Matching | Spaced |
|---|
No study sessions yet.
83 Terms
remote sensing
the acquisition of information about an object or phenomenon using
devices not in direct physical contact with what is being measured, ex: X-ray, MRI, aerial photograph
why remote sensing
allows a regional/national view (small scale), sees things invisible to the human eye, collects data on dangerous areas
passive sensor
only detect received light or light bounced off earth’s surface (space telescopes, drones with regular cameras)
active remote sensors
send out a signal and detects the bounce back (SONAR, RADAR)
remote data tends to be
continuous raster data (photography)
spatial resolution
the size of the smallest object that the remote sensor camera can detect, smaller=more detail
orthophoto
An image that’s been corrected for the perspective of the camera
electromagnetic radiation
Energy emitted and absorbed by charged particles that
exhibits wave-like behavior through space (radio waves, visible light)
black object
absorbs all wavelengths
white object
reflects wavelengths
blue, red, green objects
reflect the wavelength their color is (blue reflects blue)
spectral bands
narrow sections of the EMR (eyes have 3 cones, one cone per color band, green blue and red), light sensors work the same way
light used for remote sensing
visible, reflective, thermal, microwave
true color imagery
images how humans see them
infrared bands (imagery)
assign bands to colors you cannot see
photo interpretation
do you see what it is, or what you want to see
ground truthing
verifying measurements to ensure you interpret images correctly
direction
angle of difference between reference line (usually north) and a heading (straight line towards something)
azimuth
angle measured in degrees clockwise from north to a direction line out of 360, east is 90
back azimuth
opposite direction from a measured azimuth
true north (geographic north)
Earth’s axis of rotation
magnetic north
one end of the Earth’s magnetic field (125 miles away from true north)
grid north
North on a local grid coordinate system
declination
the angle of difference between True North and Magnetic North (hofstra 12 degrees W)
Correcting for Declination with Azimuths
When Mag N is west of True N, add the degrees (at hofstra add 12), When Mag N is east of True N, subtract the degrees
card
azimuths on it, numbers towards the edges
compass needle
magnetic part that points north
how to use rotating needle compass
align the needle with north, look across the center pivot, check degrees of object from north
orienteering compass
heading arrow, rotating card, point heading arrow at destination, rotate card so that it aligns with needle and heading arrow stays pointed at destination, record and direct for declination
great circle
circle that goes around the ENTIRE circumference of the Earth- all 24,000 miles, shortest distance between two points, azimuths constantly changing
Loxodrome / Rhumb line
a line with a constant compass heading (crosses each meridian at the same angle)
Loxodromes that are also great circle include
The equator, lines of longitude
bearings
heading angles given in degrees ranging only from 0° to 90°, (ex: N 45 degrees E or S 45 degrees W)
metes and bounds
A point-to-point outline of a parcel (unit of land) to define exactly where the parcel’s boundaries/edges are, expressed as distances and directions from succeeding reference, measured in bearings
metes and bounds information
deed (document who owns it) and property survey
elevation
the height of the land
mean sea level
average of all the low and high tides over a metonic cycle (19 years)
absolute relief symbols
Expressions of exact, numeric elevation, better for direct measurements, scientific work
relative relief mapping symbols
Qualitative impressions of elevation, quicker, at-a-glance impressions of relief, better for untrained map readers
absolute: spot elevations
a point with an elevation
benchmark (BM)
high accuracy spot elevation used by surveyors
absolute: hypsometric tinting
elevation by color
absolute: contour lines
lines of constant elevation
contour interval
vertical difference between contour lines
quantitative slope formula
rise (feet or meters)/run (miles of kilometers) (convert run to rise first)
relative: hachures
short lines that run directly downhill
relative: hillshading
light to peaks and shade depressions
digital elevation model (DEM)
raster data where each cell’s value is the elevation at that spot, valuable for what datasets we can calculate from them
Slope raster is where each box has a different elevation, where in aspect raster data each box has a different direction the slope is facing
slope raster v aspect raster
map projection
coordinate system that is flattened (stretched/shrunk/torn) for a flat medium such as paper
ways to categorize map projections
developable surface, what they distort
developable surfaces
planar, conic, cylindrical,
standard point/line
points or lines where theoretical the plane meets the sphere, making for no distortion
aspects maps can preserve
shape, area, distance, direction
preserving shape- conformal projections
tissot’s index dots same shape but different size
equal area (size preserving)
same size but weirdly shaped or other things
direction preserving
perspective sometimes at North Pole, much less common, can preserve this with one other aspect
distance preserving
preserves from a point, much less common than equal area or conformal
political aspects of maps
mercator projection is racist because it minimizes former colonies and maximizes small, rich, countries
gnomonic projection
any straight line follows great circle, planar, direction
mercator
cylindrical, preserves shape,
sinusoidal
equal area, good for thematic use
compromise projections
Preserve none of the four variables, good for world-scale reference or thematic use
classification
ordering or grouping attribute data into categories to be presented on a map
three decisions of classification
how many classes?, what method to use for placing?, what kind of graphic symbol
how many classes
qualitative map (classes differentiated by type, nominal and ordinal data), quantitative map (numerical data represented by amount, interval and ratio, choose the number [more than 2-3 but less than 8])
what method to use for placing the values into classes?
histogram: natural breaks, equal interval (equal attribute value range), quantile (equal number of states per class), manual
symbology
use of visual variables to communicate information
visual variable
property of a symbol/graphic mark that denotes a type of information (qualitative: hue/color, shape, text) (quantitative: size, line weight, color saturation, color value, pattern, orientation)
visual variables depend on
qualitative and quantitative maps
types of thematic maps
choropleth, dot density, graduated symbol
choropleth maps
different colors fill polygons by class (normalization to fix)
graduated symbol maps
data classed into symbol size classes,
dot density maps
dots represent a specific amount and use total data, placed randomly within each polygon
six core cartographic elements
title, credits, legend, scale, directional indicator, neatline/border

mercator projection, cylinder surface, preserves shape

gnomonic projection, planar/circular developable surface, preserves direction

azimuthal equidistant, planar/circular developable surface, preserves distance and direction

world plate carree aka equirectangular, cylindrical developable surface, preserves nothing

gall-peters, cylindrical developable surface, preserves area, anti mercator

Albers Equal Area, conic developable surface, preserves area

mollweide, pseudocylindrical developable surface, preserves nothing
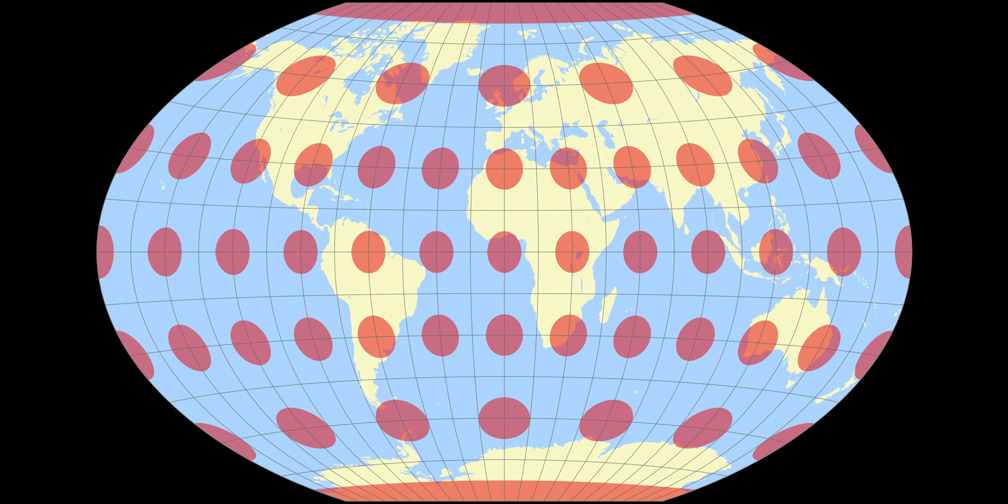
winkel tripel, pseudocylindrical surface, preserves direction and distance