BMT - simple linear regression
1/6
There's no tags or description
Looks like no tags are added yet.
Name | Mastery | Learn | Test | Matching | Spaced |
|---|
No study sessions yet.
7 Terms
What does simple linear regression show?
The relationship between two variables e.g., weight in correlation to height. These are shown in scatter diagrams

What are the correlations of data on a scatter diagram?
Strong positive, weak positive, strong negative, weak negative, no correlation
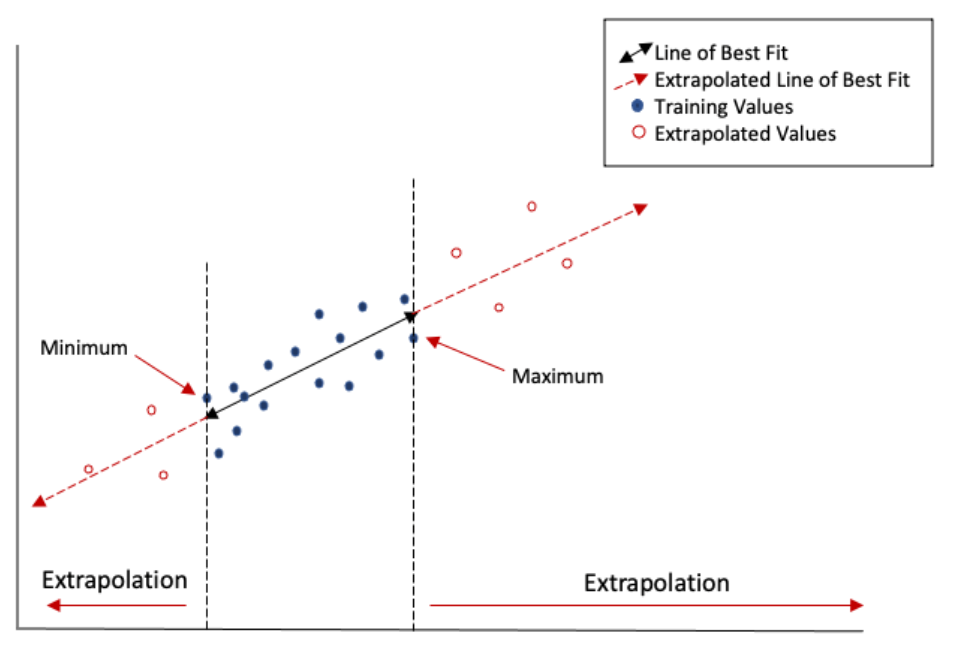
What is the line of best fit?
Drawing a straight line through the middle of the points on a scatter diagram, which reveals the trend
What is extrapolation?
A technique which estimates data values beyond original data set, based on previous data. It can be used to forecast future trends
What is correlation vs causation?
It shows two variables may have a correlation, however, that doesn’t mean that one variable is the cause of another, or that they are related. For example, ice cream sales may increase with homicide rates, but that doesn’t imply causation, it just shows correlation
Advantages of simple linear regression?
Extrapolation can be used to predict trends in the future
It is easy and simple to interpret
What are disadvantages of simple linear regression?
Data must be accurate and reliable
Outliers / anomalies can distort results
Seasonal fluctuations can make it difficult to determine correlation (e.g., sunscreen, clothing)
Random variations can lead to outliers (e.g., war, natural disaster)