ecology: c4.1 populations and communities
1/70
There's no tags or description
Looks like no tags are added yet.
Name | Mastery | Learn | Test | Matching | Spaced |
|---|
No study sessions yet.
71 Terms
Population
Large or small group of same species that live and breed together but are separated from other populations via barriers like rivers, mountains, and seas
Reproductive Isolation
Populations don’t usually mate with other populations, like on different islands, keeping their genes unique
Population (One Species!) Interactions
Competition – for food, space, mates.
Cooperation – help each other survive.
Predator-prey – prey stay in groups to stay safe.
Random Sampling
Method where individuals are chosen randomly (equal chance of selection) to create a representative sample and avoid bias; selected random samples calculate an average later used to estimate total
How does random sampling it work?
Scientists select several random samples from the area.
They count individuals in each sample and calculate an average.
Using this average, they estimate the total population size.
Sampling error
Difference between the estimated size and true population size; random sampling keeps this as small as possible
Quadrant Sampling
Quadrant is a square frame used to mark a small area in a habitat placed randomly to avoid bias, count each quadrant, calculate mean number per quadrant then multiply mean by total quadrants covering whole area; used for SESSIL and CLEAR COUNTABLE organisms inside the quadrant
Standard deviation
Tells you how much numbers vary between quadrants
Small value → organisms spread evenly
Large value → clumped or uneven distribution
What is capture-mark-release-recapture?
Used to estimate population size of motile animals by capturing some individuals and marking them (M), then capturing another sample (N), and then counting how many marked individuals are recaptured (R); use lincoln index for population size estimate
Lincoln Index Formula for Capture-Mark-Release
Population size estimate = (M × N) ÷ R
M = number marked first time
N = number caught second time
R = number of marked caught second time
Assumptions of the Capture-Mark-Release
No immigration or emigration during study.
No births or deaths during study.
Marked individuals mix evenly back into the population.
Marked and unmarked individuals have equal chance of capture.
Marks stay visible and do not affect behavior or survival.
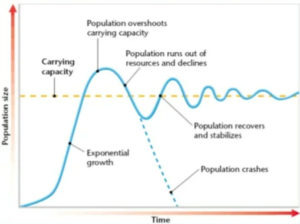
What is carrying capacity?
The maximum number of individuals an environment can support; when population goes over this, resources run out and competition starts
Competition for resources
More deaths, fewer babies, or animals emigrating; -/-
Population size changes are affected by
Density Independent and density dependent factors
Density-independent factors
Impact populations no matter their size.
Examples: natural disasters, weather changes, fires.
Density-dependent factors
Have bigger effects on larger populations
Examples: competition for limited resources, higher risk of predation, diseases and pests spread more easily in dense populations
Negative feedback effect
Density-dependent factors help keep population near carrying capacity; reduce numbers when populations gets to big and lessens effects when population drops to allow for growth
What are population growth curves?
Graphs showing how population size changes over time and helps us understand growth patterns in ecosystems for conservation and population management; may oversimplify complex systems
Exponential population growth (J-shaped curve)
Occurs when resources are unlimited and population grows very fast; no lag phase expected in this model
Logistic population growth (S-shaped curve)
Growth slows as resources become limited and population stabilizes at capacity; limited by competition, predation, and disease
What is sigmoid growth curve modeling?
Studying population growth in controlled environments to isolate confounding factors; Uses organisms that grow quickly and are easy to track; helps us understand real-world population dynamics and growth patterns
Intraspecific relationships
Occurs between members of the same species; can be both competition and cooperation
Intraspecific competition
Occurs when members of the same species compete for limited resources like food, water, mates, or territory; density-dependent factors driving natural selection
Intraspecific cooperation
Occurs when members of the same species work together for mutual benefit to improve survival, hunting efficiency, or care of offspring; examples include penguins huddled together and wolf packs
Community
includes all populations of different species living and interacting together in an area. This includes plants, animals, fungi, and bacteria.
Herbivory
Primary consumer feeds on producer (may be algae or plants that have protections) to control plant population and cycle nutrients; examples include rabbits and grass; +/-
Predation
One species kills and eats another to regulate prey population and maintain ecosystem balance; examples include lions and zebras; +/-
Interspecific Competition
Different species compete for the same limited resource like food, space, or light to reduce population sizes of competing species
Mutualism
Both species benefit from the interaction; often long-term and essential for survival for at least one of them; +/+
Parasitism
One species lives on or in another species (host) for resources, causing harm but not quick death; +/-
Pathogenicity
A pathogen infects a host, causing disease and impacting a population’s (can be microorganisms) health and survival rates; +/-
Mutualism: Root Nodules in Legumes
Partners: legumes and rhixobium bacteria
Bacteria fixes atmospheric nitrogen into a form plants can use and plants supply bacteria with carbs and a safe home inside root nodules
Mutualism: Zooxanthellae in Corals
Partners: Corals and zooxanthellae (photosynthetic algae)
Zooxanthellae photosynthesize and provide nutrients to the coral while the coral offers protection and access to sunlight for algae
Why invasive species succeed?
Lack of natural enemies
Rapid reproduction and spread
Comeptitive advantage
endemic
native species
How to test for interspecific competition?
Competition is indicated if one species does better when the other is absent, but this doesn’t prove competition alone.
Observation in natural habitats to see if population affects each other
Lab experiments in controlled conditions to see impact of competition on species growth and survival
Field manipulation experiments removes one species from an area and observes impact on the other
Chi-squared test analyzes if species distributions are independent or influenced by competition
Competitive Exclusion Principle
Two species cannot occupy the same niche forever; one outcompetes the other.
Resource Partitioning
Species reduce competition by using different resources or parts of a resource.
Character Displacement
Evolution of traits (like beak size) reduces overlap in resource use between species
Chi-squared test
a statistical tool used to check if there is an association between the distributions of two species. It helps determine whether the presence of one species affects the presence of another.
How the Chi test works
Data collected on presecne/absence of two species using multiple random quadrants
Observed frequencies (actual counties) compared to expected frequencies (what it would be if they were independent)
Calculates value showing how much observed and expected values differ
If X^2 value is GREATER than the critical value from chi-squared tables, the null hypothesis of NO association is REJECTED
Ecological significance of Chi tests
A significant result = correlation two species distributions are related and may be impacted by competition or mutualism; helps see if species avoid or prefer co-existing
Predator–prey interactions
One population size influences the size of another; a regular cyclical pattern over time since more prey means more predators but more predators means less prey which means less predators which means more prey; an example of density-dependent population control as high prey density supports large predator popul. and low prey density reduces predator numbers
Populations in ecological communities can be regulated by two main types of control
top-down and bottom-up. Both control mechanisms influence species abundance and ecosystem stability, but usually one dominates in a particular community.
Top-Down Control
Higher tropic levels (predators) regulate the population sizes of lower trophic levels (herbivores and producers; causes a cascade effect through food chain called trophic cascade; example: more predators means less herbivores means more plants
Bottom-Up Control
Lower trophic levels (producers) influence the populations of higher trophic levels; resource availability at the base controls the entire food chain
Allelopathy and antibiotic secretion
Are two important chemical strategies used by organisms to reduce competition and defend resources by releasing harmful substances into their surroundings.
Allelopathy
When plants release chemicals into the soil or air that negatively affect the growth and development of nearby plants via toxicity or interfering with nutrient absorption; reduces competition
Secretion of Antibiotics
Some microorganisms like bacteria and fungi produce antibiotics to kill or inhibit the growth of other microorganisms by targeting cellular processes; reduces competition
community
consists of all the populations of all the different species that live together in a particular are
Organism — 1st level of organization
An individual living thing that is made of cells, uses energy, reproduces, responds, grows, and develops
Population (sub: species) — 2nd level of organization
A group of organisms of the same species living in one area who can interbreed.
Species: a group of organisms so similar to each other that they can reproduce and produce fertile offspring.
Biological Community — 3rd Level of Organization
All the populations of different species that live in the same place at the same time.
Ecosystem — 4th Level of Organization
Populations of plants and animals that interact with each other in a given area with the abiotic components of that area. (terrestrial or aquatic)
Biosphere — 5th Level of Organization
The combined portions of the planet in which all life exists, including land, water, air and the atmosphere (the global ecosystem).
What is the steps of the ecosystem?
chemicals → cells → tissues → organs → body systems → organisms → population → community -→ ecosystem → biospehere
Population growth equation
(B-D) + (I-E)
Population density
number of individuals per unit area
Uniform distribution – individuals evenly grouped
Random distribution – individuals irregularly spaced
Clumped distribution – individuals grouped in patches
Species abundance
number of individuals in species
Species richness
number of species in an environment
Commensalism
Interaction between two species in which one benefits and the other is unaffected; examples: hermit crabs live in shells left behind by snails; +/o
Amensalism
An association between two species in which one is inhibited or destroyed and the other is unaffected; example: elephants walking across land may crush fragile plants; o/-
Neutralism
interaction between two species that is incidental and does not affect each other; example: tarantula walking on a tree; o/o
Mixotrophs
organisms that can perform both autotrophy and heterotrophy
positive association
If two species interact directly within a shared environment, they share a positive association (they co-exist).
Examples of positive associations:
Predator-prey relationships
Symbiotic relationships
negative association
If interactions within an environment are mutually detrimental to both species, they share a negative association (do not co-exist).
Examples of negative associations:
Competitive exclusion
Resource partitioning (giraffes eat from top/zebras from bottom)
Systematic sampling
Systema,c sampling could occur by establishing a straight line through a habitat (transect) and sampling at regular intervals.
Systema,c sampling allows the distribu,on of a species to be measured against a changing environmental condi,on (e.g. eleva,on, soil salinity, etc.)
Line Transect Sampling
Set up a line of a specific length from a particular point.
Count organisms using one of 3 methods:
Count the number of organisms touching transect line
Count the number of organisms that are a specific distance from the line
Count the number of organisms within quadrats placed at specific intervals along that line
Immobile
Studying areas that change over a “gradient” (change in pop size as __________ factor changes)
Population density estimate for quadrants
Total # organisms in all quadrats/Total # quadrats * (area of quadrat)
3 phases of sigmoid growth:
Exponential phase (everything abundant)
Transitional phase (carrying capacity/limiting factors)
Plateau phase (fluctuates around carrying capacity due to toxins)
Carrying capacity can be estimated to be the
“relative middle” of all the fluctuations