Unit 3 - Global resource consumption + security
1/39
There's no tags or description
Looks like no tags are added yet.
Name | Mastery | Learn | Test | Matching | Spaced | Call with Kai |
|---|
No analytics yet
Send a link to your students to track their progress
40 Terms
Earth overshoot day
The day when human demand for ecological resources and services exceeds the Earth’s capacity to regenerate them in a whole year
Ecological footprint
Measure of the amount of land needed to supply resources and absorb waste
Can be measured from global to individual scale
Considers two aspects: bio capacity + demand
Bio capacity: biological capacity of an area/region/country to generate the resources and absorb waste e of a given population
Demand: amount of bio productive land we need to provide resources + space for infrastructure + to absorb waste we product
Global trends:
Biocapacity of earth has increased eased slightly
Attributed to ability to exploit areas previously inaccessible like mountains - now can use farm land that was previously unproductive, as humans now aware of need for action
Things that lower an ecological footprint
Renewable resources - wind, water, solar
Limited private cars - walk, cycle, public transport
Strict emissions policies to reduce pollution in atmosphere - cars, factories, power plants
Limited air travel
Recycled products - cars, clothes, containers
Things that increase ecological footprint
Non renewables - fossil fuels are finite and create pollution and release carbon
High private car ownership
Limited emissions policies or ones that aren’t enforced
Large amounts of air travel - still isn’t an alternative to oil based fuel for planes
Always buying new things - require raw materials and energy to produce
Impact of settlements + infrastructure on ecological footprint
Takes up a lot of space
Less space for crops: less food can be grown, less biofuel, less
Less space for natural environment to deal with waste products: green plants remove carbon dioxide with photosynthesis
Less space for natural ecosystems: impact biodiversity negatively
Impact of forests on ecological footprint
Forests provide timber and paper
Sequester carbon dioxide
slows impact of global climate change
High rate of deforestation = higher EF
Countries that reforest can decrease EF
Different types of footprint
Carbon footprint: total amount of greenhouse gas emifssions caused by individual, city, event, flight, country = emitted through transport, land clearance, production and consumption
Water footprint: amount of water in EF, includes water for washing and drinking (direct) and amount of water to grow food (indirect) = 800 litres of water to product 2 litre of milk
Food footprint: way food intake impacts EF, land used in food production (crops, grass, animal feed), land needed to absorb carbon emissions produced during food production
CASE STUDY - Peru as a country in ecological surplus
How do they maintain low EF:
Environment minister that uses international aid to reduce deforestation and environmental pollution
Abundant natural resources
Sustainable organisations help
Signed Kyoto protocol
Signed many wildlife protection agreements to maintain biodiversity + protection of endangered species
Govt environmental department dedicate state funds
Problems in Peru:
Deforestation bc of illegal logging
Overgrazing —> soil erosion and desertification
Air pollution in Lima
Mining waste causing polluted waters
Global water availability
97.3% of water is in oceans and other salty bodies
0.007% = fresh water available for human consumption
68.9% of fresh watered is locked. Up in ice caps and glaciers, rest is groundwater or lakes
Source of almost all water we use = precipitation
Third source of water: desalination
Saudi Arabia remove salts from sea water to make fit for human use
Renewable water: drawn from rivers and groundwater without exceeding rate of replacement from precipitation + melting
Non renewable water: water taken can’t be recharged by rain, extraction rates exceed recharge rates, water bodies are polluted
Africa has highest level of economic water scarcity
Global food availability
Surplus Regions: These are countries or areas that produce more food than they consume, often becoming major exporters.
USA
One of the largest agricultural producers globally.
Key exports: wheat, corn
Benefits from highly mechanized farms and advanced biotechnology (e.g., GMOs).
European Union
Especially France, Germany, Netherlands, Spain.
Modern farming infrastructure, excellent roads, and trade access support distribution.
Diverse climates allow production of a wide range of crops.
Deficit Regions: These areas do not produce enough food to feed their populations, often relying on imports or aid.
Sub-Saharan Africa
Some of the world’s highest rates of food insecurity.
Causes:
Unpredictable rainfall and drought-prone regions (e.g., Sahel).
Soil degradation and desertification.
Political instability and conflict (e.g., Sudan, Somalia).
Limited access to modern agricultural technology and poor infrastructure.
South Asia (e.g., parts of India, Bangladesh, Pakistan)
Rapid population growth can outpace food production.
Monsoon dependence creates vulnerability.
Urbanization and land use changes reduce available agricultural land.
Global water consumption
Divided into three categories
Agricultural: used for irrigation, livestock, aquaculture
Agricultural consumption in LICs is most
Industrial: cooling in electricity generation, water in manufacturing processes (food, clothes, chemicals)
Industrial is most in HICs
Domestic (municipal): refers to all uses of water in home = washing, cooking, cleaning
Relatively low in both - slightly higher in HICs
Increasing population = higher demand
Domestic use increases with more people
Increasing standards of living = more domestic use
Agricultural use increases with more people needing to be fed
Dietary changes to meat-based = production of mean consumes more water than fruit and vegetables
Industrialisation in LICs = more industrial water consumption
Urbanisation = further investment into development of infrastructure use to provide water resources
Embedded water in food + manufactured goods
Water we don’t necessarily realise we use but its in stuff we use
T shirt = 2650 litres of water
Global food consumption
Food consumption is generally measured by a unit of energy - we eat to gain energy we need
Amount of calories we eat depends on: age (more calories at different stages), gender (women need fewer), climate (colder climate burn energy to maintain body temp - need more cals)
Few people receive insufficient calories - most North America, Europe, Australasian, South America, Asia overconsume calories
HIC have issue of obesity
Majority lack sufficient calories = Sub-Saharan Africa: poverty, droughts and floods, war, food waste
Sub-Saharan africa: farmers cannot improve production fast enough to meet increasing demand
Increased globalisation: ability to move food between countries increases = variety of food, availability of food out of season, greater demand for ethically produced environmentally friendly produce, demand for meat consumption
Global energy availability
Major Energy Producers
Middle East (e.g., Saudi Arabia, UAE, Iraq)
Huge oil and gas reserves.
Most production is for export (key role in OPEC).
Economies heavily dependent on fossil fuel revenues.
Russia
World's largest exporter of natural gas, also significant oil production.
Supplies large portions of Europe (creating geopolitical dependence).
Has pipelines stretching to Asia and Europe.
Major Energy Consumers
China
Largest total energy consumer.
Rapid industrialization, urbanization, and rising living standards drive demand.
Big push into renewables but still relies heavily on coal.
European Union
High overall energy consumption.
Efforts to shift to renewables
Still imports much of its energy, especially gas from Russia (though this is changing).
Global energy consumption
Energy production is driven by demand
Energy consumption is impacted by:
type of industrial activity that is dominant in a country (primary sectors -mining- and secondary sectors -plastics manufacturing- are high, tertiary and quaternary are service-based so consumption is lower)
climate (cold requires heating, hot for cooling)
development (higher levels of disposable income for washing machines, technical equipment)
Renewable energy is reliant on the resource it uses: hydropower for high rainfall areas, solar is common in lower latitude (more solar radiation), geothermal for tectonic and volcanic activity, wind is fairly distributed
Water-energy-food nexus
Water security, food security, and energy security are linked and our actions in one area will have impacts on the other two
Security means ACCESS not availability
Climate change amplifies water-related risks - drought, floods
SDGs: Goal 2 End Hunger, Goal 6 Ensure access to water and sanitation, Goal 7 Ensure access to affordable reliable and sustainable energy for all
Water security
Access to sufficient, sustainable quantities of clean water and sanitation. Sufficient means enough water to sustain livelihoods, wellbeing, food supply, protection from contaminated water
Food production relies on water
Energy uses water to cool or for hydropower or production of solar panels and turbines requires water
30% of world’s population does not have access to improved sanitation
3 million children die each year of water-related diseases = 5.7 children dying each minute from preventable causes
water scarcity encourages poor storage —> water contamination and breeding grounds for mosquitos carrying malaria
Causes of insecurity:
gap between supply and demand
growing populations put direct strain on water resources + indirect through strain on food and energy
water pollution causes water scarcity cuz no longer fit for human consumption
droughts are more frequent and long causing water insecurity
Strategies to improve water security
Increase supply through: desalination action, grey-water recycling (cannot be drunk but can be used for toilet flushing) and fog harvesting (in Peru)
Increase storage: reservoirs, rainfall harvesting schemes, artificial glaciers (ice stupa in Himalayas)
Decrease demand: water conservation (inc water efficiency through tech), raising awareness (public campaigns, education in schools, economic incentives like increasing cost of water, introduce legislation, reduce meat based diets)
Food security
When all people at all times have physical, social and economic access to sufficient safe and nutritious food which meets dietary needs and food preferences for an active and healthy life
Malnourishment and child mortality is highest in sub Saharan Africa
148 million children are stunted by malnutrition
2.8 billion people cannot afford a healthy diet = 35%
If current trends continue = 582 million people will be chronically undernourished in 2030 - HALF IN AFRICA
Availability: food must be physically available
Access: people must have physical and economic means to get food - controlled by personal income, food prices, and access to land to grow food or shops to buy in
Utilisation: must be able to make the most of the nutrients in the food they eat
Stability: food must be available able, accessibly and usable at all times
Causes of food insecurity:
We currently produce enough food to feed 10 billion people so food insecurity shouldn’t be a problem but:
Physical
food distribution network are inadequate to rural areas
Land grabbing = large business investors take over traditionally owned family farms
Human
increasing population = PRESSURE
Food Wastage - can occur at all stages: harvest, processing, package, transport, food prep
HICs consume much more than necessary - indirectly ‘stealing’ from LICs
Strategies to improve food security:
Agriculture: green revolution, improved water supply through improved irrigation techniques, mechanisation in all areas of production. solar irrigation (draws water from wells and rivers - with sun)
Economic + Political: Provide subsidies or credit access to smallholder farmers, Promote fair trade and access to local and global markets, Develop transport and storage infrastructure, Reduce trade barriers and import dependency, Establish national food reserves or grain banks,
Human/social: food wastage needs to be saved, decreased calorie consumption is down to education and awareness campaigns
Energy security
Access to clean, sustainable, reliable, affordable, modern energy to meet needs of all sectors including domestic, commerce, industry, municipal and communications
Reliability: energy supply is consistent and uninterrupted
Access ability: everyone has physical access to an adequate modern energy supply - supply meets demand
Affordability: available at a price everyone in the population can afford to pay for
Saudi Arabia, Venezuela, Canada = 30% of global oil supply
China, USA, India = 60% of coal supply
USA, Russia, Iran = 45% of natural gas
9.4% of global population lacks access to electricity
2.1 billion still rely on damaging cooking fuels
Despite progress, world remains off course to achieve SDG 7 - affordable and clean energy by 2030
West Africa: Sierra Leone - little less than 2 decades after civil war ended only 5% of population had access to electricity - rural areas = 1%
HICs are also affected by energy insecurity unlike FOOD and WATER
USA is large risk because it has to import large amounts of fossil fuels and electricity to meet demand - leaves them vulnerable to interruption of supply and price increases
Japan is high risk due to 2011 earthquake and Tsunami that caused Fukushima accident
Causes of energy insecurity:
fossil fuel depletion: is a finite resource and is predicted end to completely run out in 2091
reliance on imports: many LICs need to use own energy sources like oil for own development so they don’t have enough to export (Venezuela),
geopolitical concerns: oil is located in politically unstable areas like Middle East - can threaten supply, war in supply country interrupts exports, terrorist attacks on oil fields or supply infrastructure is always a risk
Natural disaster: disrupt energy supplies - Fukushima Nuclear power station 2011 caused energy insecurity for Japan - Govt closed all nuclear reactors which dropped supply by 31%
Strategies to improve energy security
Reducing imports and becoming more self-sufficient in energy supply:
diversification of energy sources + increasing use of alternatives to fossil fuels
reducing demand by increase energy efficiency and energy conservation measures
Reducing reliance on exporting countries + using multiple exporters - spreading out risk of energy insecurity
CASE STUDY - iceland is energy secure
86% (66% geo + 20% hydro) of energy needs are from geothermal and hydropower - 14% fossil fuels
Iceland in recent years also invested in wind power - DIVERSIFYING energy sources
Fossil fuels used for vehicles, boats and some industrial purposes
Renewable energy usage by countries
Sweden = solar, wind energy, energy storage, clean transport
97% of Scotland’s domestic energy came from wind power
Denmark aims to be 100% fossil-fuel by 2050 through wind power
CASE STUDY - Security in CH
Water security:
‘Water rich’ with lots of annual rainfall
6% of Europes drinking water resources are in CH
Glaciers = main water source
Food Security:
produces over 60% of own food
High food security is possible due to high water security
Energy Security:
imports 85% of energy
country relies on trade for energy security —> vulnerable to geopolitical
investing in energy research and development
60% Hydropower energy
nuclear, natural gas, imported petroleum for cars since CH doesn’t produce fossil fuels
Environmental impact:
CH resource consumption exceeds biocapacity - 3 earths needed if everyone lived like Swiss
Climate change:
CC melt glaciers - affect water security
Geopolitical stability: neutral, stable = contributing factor to resource security
CASE STUDY - Security in UAE
Water security:
UAE = very water scarce
42% of potable water comes from DESALINATION
Food Security:
imports over 90% of food needs
less than 5% of land is arable (can be used to grow crops)
aims to improve by 2051
Energy security:
rich in fossil fuels - OIL - grow economy A LOT
investing in renewable energy to diversify
developing nuclear power to meet growing energy demands
Environmental impact:
rising temperature + dust storm = threat
CC affect traditional farming systems
Geopolitical factors:
Food security is vulnerable to global supply chain disruption
TECH SOLUTIONS: investing in high-tech protected agriculture systems to overcome environmental challenges
Green revolution
This revolution started a shift to new agricultural strategies and practices in order to increase food production with both positive and negative results until 1980s
Mexico: was supported by govt, govt provided financial support and established ‘Mexican Agricultural Program’ to maximise the knowledge and technology gained by Green revolution, GREAT SUCCESS IN WHEAT PRODUCTION, application of fertiliser and pesticides = maintain success
Sub-Saharan Africa: less successful bc of corruption, lack of investment by govts, lack of infrastructure, harsh climatic conditions, lack of water for irrigation, attempt to introduce new rice variety (NERICA) = LIMITED SUCCESS
Types of poverty
Absolute poverty: Lack of money for basic needs: food, shelter, clothing
Relative poverty: When people have inadequate financial resources and thus fall below prevailing standards of living in a society
Income poverty: When family income is below nationally established poverty line/threshold
Varies between countries + significantly higher in HICs due to high cost of living
HIC CH: 81.5CHF per day
MIC India: 9 dollars per day
LIC Afghanistan: 2.15 dollars per day
Global middle class
Non-manual workers , middle management and small business owners ears
Earn more money than working class but less than upper middle class+ upper class
People who have 33% of income left over after paid for essentials to buy consumer goods
If becomes a stable middle glass - consumption + demand for goods increases —> positive feedback cycle
Middle class drives social change bc influences economic development
Tend to by educated - participate in politics + push for inclusive growth
Asia - explosion of middle class
North America - decrease
South Korea middle class comprised over half of population
Brazil has only 29% middle glass = not sufficient to drive shift to domestic consumption
Non-renewable
Natural resources that humans are using at a rate that exceeds their replacement - fossil fuels
ENERGIES:
Fossil fuels
A: most economically viable
D: finite, GHG emissions, large amounts of water needed, extraction and transportation is damaging in to environment
Nuclear energy
A: workers are safer than coal miners, don’t produce GHG, economically viable
D: high initial capital cost of construction, waste products are radioactive for MANY YEARS, potential for nuclear weapons, risk of nuclear accidents (Fukushima in 2011)
Renewable
Natural resources that humans are using at a rate that allows for their replacement - plants, animals
ENERGIES:
Hydropower
Advan: dam construction increase water resources + reduce risk of flooding
Disadvantage: high set-up costs + loss of terrestrial habitat
Wind
A: low operational costs
D: noise + visual pollution
Solar
A: Low running costs + renewable
D: no good at night
Geothermal
A: sustainable - water used to produce steam can be used again
D: limited to areas near volcanic activity
Consumer goods
Anything that is bought to satisfy needs and wants of consumers
No raw materials or goods that go to industry or business to make something else
Broken down into: durable, non-durable, services
Durable: Goods with long lifespan - cars, tv, appliances, furniture
Non-durable: Short lifespan - immediate consumption like food, drink, clothing, shoes
Services: Intangible actions like hair cuts, gardening, car servicing - NOT RELEVANT BC DONT PRODUCE WASTE THAT NEEDS TO BE DISPOSED OR RECYCLED
Ways to dispose consumer goods
Landfill (Cheap, job opportunities, gases can be used for ‘waste-to-energy schemes BUT methane GHG, ocean pollution, poorly managed causes spread of diseases/rat/mice problems
Incineration (reduce volume of waste which is helpful for where land is scarce (JAPAN), generate local heating (SWEDEN), retrieves metal which can be recycled BUT emit toxic metals, visual pollution, toxic air pollution emissions
Composting (helpful to food waste, reduce landfill waste)
Recycling: reduce, reuse, recycle
The “R’s”
Reduce - amount of materials to make and package
Reuse - This is reusing a product in the same context or in a different context.
Recycle - Recycling refers to using the materials from obsolete products to create other products.
Recondition - Reconditioning is rebuilding a product so that it is in an “as new” condition, by repairing it, cleaning it, or replacing parts.
Repair - Is the reconstruction or renewal of any part of an existing structure or device.
Recover - materials from products when no longer useful
Ways to implement
Take reusable bags, containers = many now refuse plastic bags, containers common for leftovers
Choose products that are refillable = in theory is effective but not many products have this feature available
Compost = possible if outdoor area available not in high-density housing situations (collection may not be available)
Buy items made from recycled materials = supporting sustainable businesses + seen as ‘trendy’
Donate electrical items to schools or NGOs = many areas have collection points (successful) but some people may be hesitant if personal data can be retrieved from old devices
CASE STUDY - International flows of waste - Germany + Sweden
Some are mutually beneficial = Germany and Sweden import waste from other EU countries to keep ‘waste-to-energy’ going
Sweden recycles 47% of waste and burns 52% for heat generation
Problem: no longer enough rubbish to meet the needs of the heating plants - Sweden imports over 800,000 tons of rubbish from UK and Norway
Germany recycles 65% of waste so plants are short of rubbish to burn - import rubbish from Italy, UK, Ireland, Switzerland
Issues with incinerators:
Incinerators are great to reduce waste pile by up to 85%
Reduce waste to pile of ash containing heavy metals, glass, rubble, sand, concrete,…
Ship breaking
Ship breaking is a type of ship disposal involving the breaking up of ships either as a source of parts (sold for re-use) or for extraction of raw materials
In HICs this process is expensive and carefully controlled
Happens on a dry dock where health and environmental issues are high priority
Valuable raw mateials are retrieved and recycled, hazardous are handles with appropriate measures
E-waste
RAPIDLY GROWING CONCERN:
bc rapidly advancing technology (other devices become outdated and tossed)
falling prices (tech improvements = lower prices = more people can get)
planned obsolescence (manufacturers deliberately design products to be out fo date within a certain period of time)
USA is highest annual producer of e-wasted = 7.1 million tonnes
African nations as a whole produce very little e-waste
life expectancy is lower in areas they deal with breaking apart e-waste = toxic fumes
‘designed for the dump’
many risks involved with miners getting materials, manufacturers processing them, and the people that then break them down again
LICs are targeted because they don’t have the laws in place
Agbogbloshie, district in Accra, Ghana
- Landfill site that processes electronic waste
CHILDREN WORK THERE
ORDEE in CH to help e-waste management
Take back products FREE OF CHARGE
Electrical and electronic appliances
Retailers obligated to take back disused appliances from their product range
Solutions to e-waste problem
extend producer responsibility
They are held liable, and companies will then invest more time into making product more reliable with less toxic substances so that they don’t have to deal with it
Make products MODULAR - if product breaks u only have to replace the one area and not the whole thing
Strengthen legislation that targets manufacturers
Designers should compete to make long lasting products
Carrying capacity
the maximum number of individuals of a species that the environment can sustainable support in a given area
When applied to humanity: how many people earth can sustainably support
Difference between human + animal carrying capacity
we produce non-biodegradable waste causing environmental degradation
resources we use are very varied - other animals just use necessities but we use luxuries - demand for both of these varies by country
we can move goods around the world - import food from another region id not enough here
employ tech that can change the environment
we can control fertility and mortality
Theories
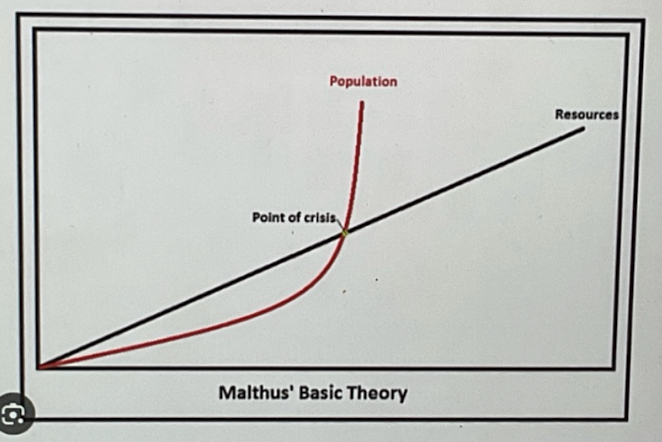
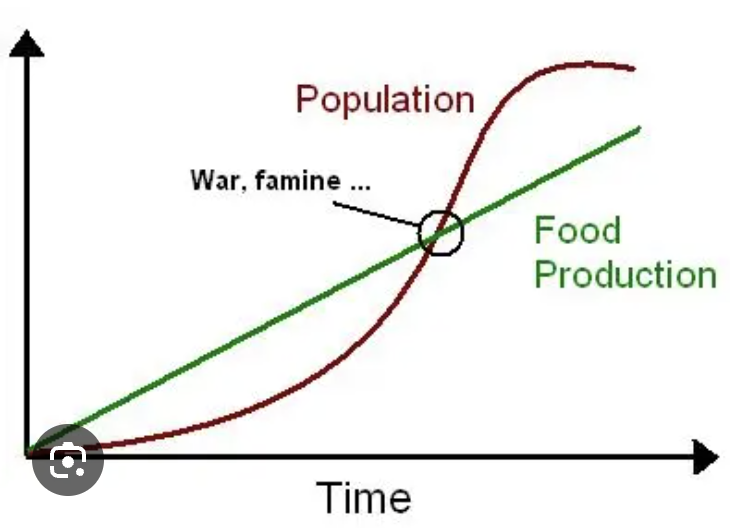
Malthusian theory
Thomas Malthus
Human population grows more rapidly than the food supply - that is until famines, war or disease reduces the population
Criticisms
predictions haven’t happened in HICs because population growth rates are not that rapid + advances in tech have changed situation
model only shows food as resource
model assumes that increasing living standards = increased birth rates NOT THE CASE
Neo-malthusian
Paul Ehrlich
Still pessimistic but emphasis on promoting population control programmes to ensure sustainability with resources for present needs and future needs
Support the use of contraception + concerned with environmental degradation and widespread famine
suggest ‘responsibility prizes’ for those who do not have children and for men with vasectomies
Boserup
Ester Boserup
The threat of starvation ion motivates agricultural innovation
Truth is that there is enough food globally to feed everyone, with some surplus. Famine is still a problem due to poor distribution networks and NOT inadequate production
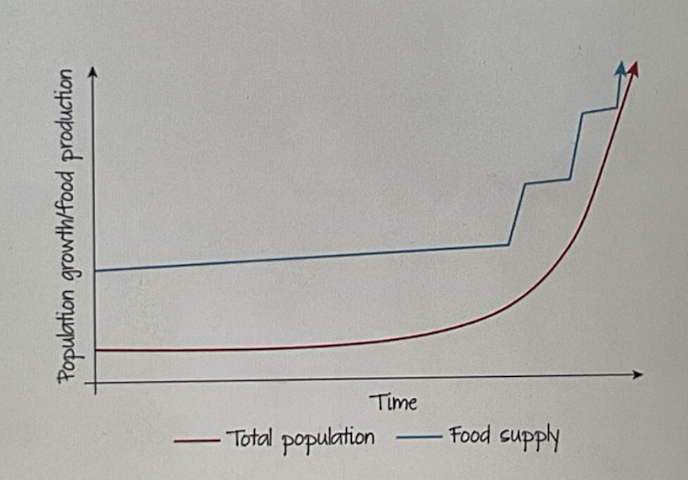
Famous optimist quote: ‘necessity is the mother of invention’ by plato - mena sthat when put into a difficult situation, one will be inspired to create a novel solution
Resource stewardship + sustainability
Resource stewardship: focuses on the sustainable use of renewable resources so that future generations can benefit from them
Sustainable development: development that meets the needs of the present without compromising the ability of future generations to meet the needs of their own
Made and transported using renewable energy
Strategies for resource stewardship:
Circular economy
Products designed so they can be disassembled and reused - stops loss of embedded energy and labour and water
Raw materials - Production - use - recycling —> BACK TO RAW MATERIALS
Try to keep resources in system as long as possible
PubliBike EXAMPLE
In Ch
Put in credit card details and use bike
Regular or electric options - suitable for different genders, age, physical activity level
Reduce carbon footprint compared to plane or car
Don’t have to keep it if you don’t use it all the time
RENT
Much cheaper than buying a full bike that you aren’t gonna use a lot
UK VERSION IS LIME BIKES + SCOOTERS
MUDJEANS
Less than 1% of new clothing is recycled
MUDJEANS are made up of 40% recycled led content - discarded jeans
Can be purchased or leased for 7.50 euros a month
Returned at any time if broken and can be swapped with new jeans
The materials from the broken one can be used to make new jeans or they can be repaired
All returns are free
Packaging of jeans are bags that can be used over 20 bags + can be retuned in mailbox
Saves up to 80% of carbon emissions compared to normal packaging
BLOCSY
Lego meets Ikea
Can make ur desired furniture without needing drills or anything img
Using very minimal materials to make minimal but effective furniture
Can be rented by students
Small business using recycled materials
Use throughout lifetime - kids table to coffee tables,..
SDGs
Aim of SDGs
Call to action to end poverty and inequality, protect the planet, ensure all people enjoy health, justice and prosperity
1. Economic growth
2. Social inclusion
3. Environmental protection
17 Goals to be achieved by 2030
SDG 2
Zero Hunger: end hunger, achieve food security, improved nutrition, promote sustainable agriculture
Target: end malnutrition by improving social programmes to make sure sufficient food is always available + increases agriculture production and prevent problems affecting yields like drought or flooding
Present status: 1 in 11 people are undernourished as of 2024 = 733 million people
SDG 6
Clean water and sanitation: ensure access to watered and sanitation for all
Target: ensure everyone has access to safe watered and sanitation + reduce water contamination ion and protect and restore water-related ecosystems
Present Status: recent UN data = 73% of global population ion has access to safely managed drinking water services
SDG 7
Affordable and clean energy: ensure access to affordable, reliable, sustainable and modern energy for all
Target: Develop and increases the use of renewable energy
Present status: 685 million people were without electricity access = 8.6% of global population = improvement to 20% in 2015
SDG 12
Responsibly consumption and production: ensure sustainable consumption and production patterns
Target: Halve the amount of food waste and reduce, reuse and recycle resources + promote sustainable lifestyles
Present Status: 1.05 bullion tonnes of food is wasted annually (most recent data is from 2022) + households waste at least one billion meals a day BIG SCALE PROBLEM
SDG 13
Climate action: Take urgent action to combat climate change and its impacts
Target: Ensure people are adequately prepared for natural hazards + ensure govts tackle climate change and provide resources to combat it
Present Status: in 2023 natural disasters affected over 95 million people globally = 1.2% of total population + 417 natural disasters annually on average
What are the global trends and causes of disparities in water, food, and energy consumption?
Trends: Overall increase in demand due to population growth and economic development.
Disparities: HICs use more per capita due to tech and lifestyle; LICs have lower access due to poverty, weak infrastructure, and political instability.
How does climate change impact resource security (water, food, energy)?
Climate change increases water scarcity (droughts), lowers food yields (unreliable weather), and disrupts energy (e.g., hydropower).
It threatens all three types of security and increases pressure on vulnerable regions.