EBP: Exam 2: Chapter 13 Quantitative Data Meaning
1/109
There's no tags or description
Looks like no tags are added yet.
Name | Mastery | Learn | Test | Matching | Spaced |
|---|
No study sessions yet.
110 Terms
what is the purpose of statistics
to help us make good decisions about issues that involve uncertainty
what is data
the values (measurements or observations) that the variable can assume
where does data come from
study samples
how can data be collected
in a variety of ways (surveys, existing records, direct observation)
what forms a data set
a collect of data value
what are the data in original form called in a data set
raw data
what are the levels of measurement
-nominal
-ordinal
-interval
-ratio
what is nominal level of measurement
lowest level; involves using numbers to simply categorize attributes (state of residence)
what is ordinal level of measurement
ranks people/data on an attribute (BMI category)
what is interval level of measurement
ranks people/data on an attribute and specifies the distance between them (temp in celsius or fahrenheit)
what is ratio level of measurement
highest level; ratio scales, unlike interval scales, have a meaningful zero and provide information about the absolute magnitude of the attribute (BMI value)
what are the basic types of statistics
descriptive and inferential
what are descriptive statistics
-summarize and describe numerical data
-describe the sample
-may be used to draw conclusions
example of descriptive statistics
the sample had a mean birth weight of 7lb 4 oz
what are inferential statistics
-statistics commonly used to test hypotheses
-making inferences from a sample to a population
-used to make judgements
two main types of inferential statistics
-parametric tests
-nonparametric tests
cold example of descriptive statistics
•include length of cold symptoms in the two groups, such as
•“65% of the subjects who took zinc reported their cold symptoms had resolved within 5 days.
•Only 28% of subjects who took placebo reported their cold symptoms had resolved within 5 days”
cold examples of inferential statistics
include determining if taking zinc helps to resolve cold symptoms within 5 days. If so, you could infer that taking zinc is advantageous to help with cold symptoms and feeling better. Find out the difference between two groups (i.e., took zinc vs took placebo)
what is a descriptive statistic
statistics that used only to summarize info about a sample
other name for descriptive statistics
summary statistics
types of descriptive statistics
1. frequency distribution
2. measures of central tendency
3. measures of variability
what is frequency distribution
the organization of raw data in table form, using classes and frequencies
what are measures of central tendency
mode, median, mean describe the sample average
what are measures of variability
modal percentage, range, and standard deviation describe the sample variation
what is ungrouped frequency distribution
presenting nominal and ordinal data where the raw data represents a characteristic of the data
example of ungrouped data photo
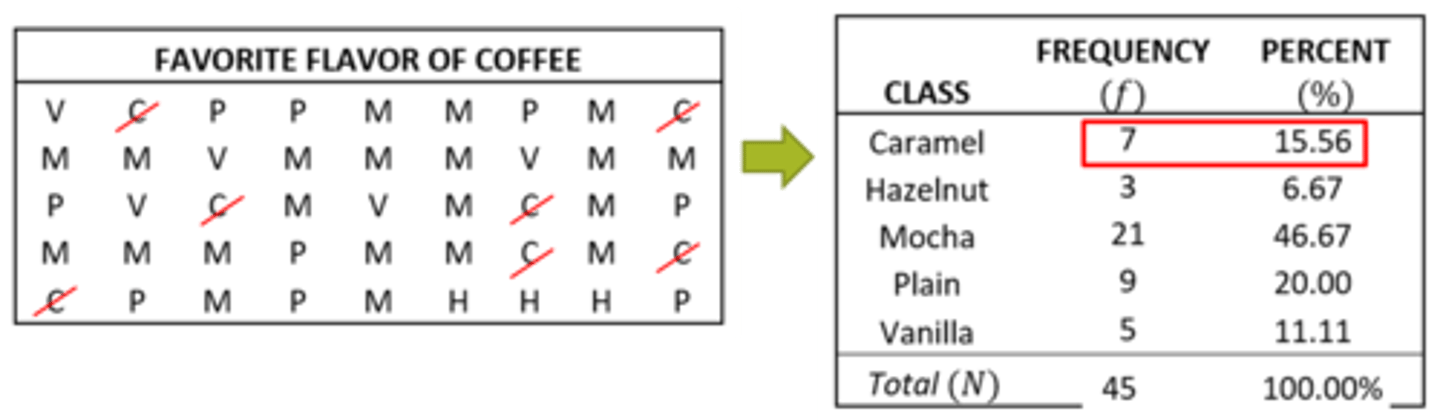
example of ungrouped data
highest level of education completed- HS diploma, associates, bachelors, masters, doctorate
example of grouped frequency distribution
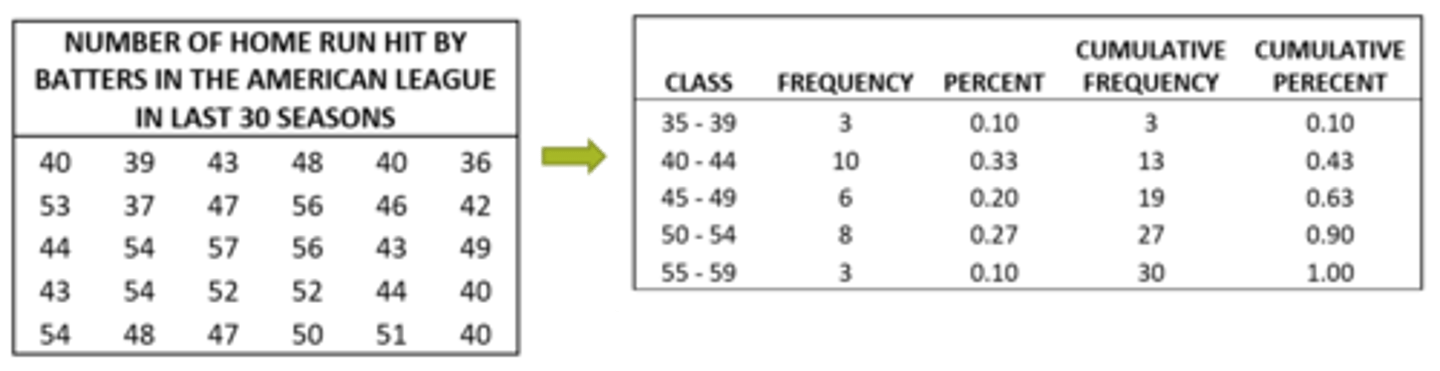
what is grouped frequency data
-raw data= continuous data and interval ratio level data collapsed in classification
-little info can be obtained from looking at raw data, especially if the volume of data becomes massive
-then group into classes, size of class should be consistent (20-29, 30-29)
-the frequency is the number of data values contained in a specific class
what is a frequency polygon
a graph that displays the data by using lines that connect the points plotted for frequencies at the midpoint of the classes
what are frequencies represented by in a frequency polygon
the heights of the points
example of frequency polygon (top)
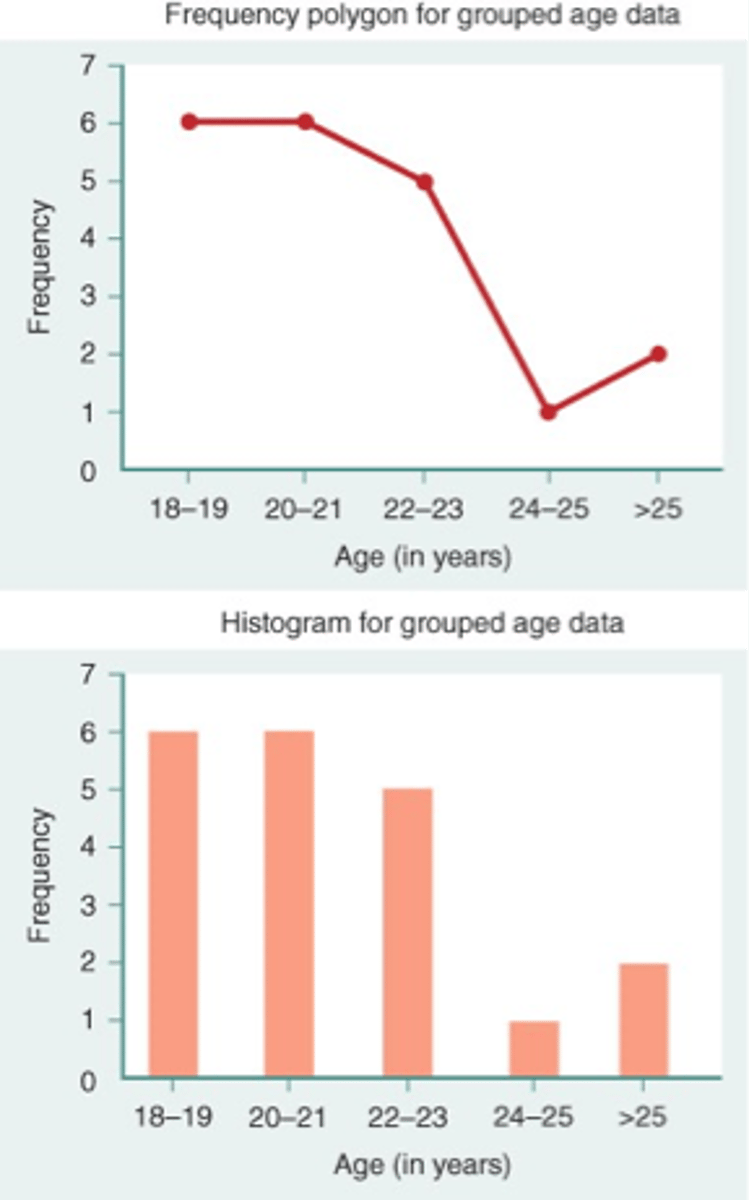
what is a histogram
a graph that displays the data by using the contiguous vertical bars (unless frequency of a group is 0) of various heights to represent the frequencies of the categories/groups
example of a histogram

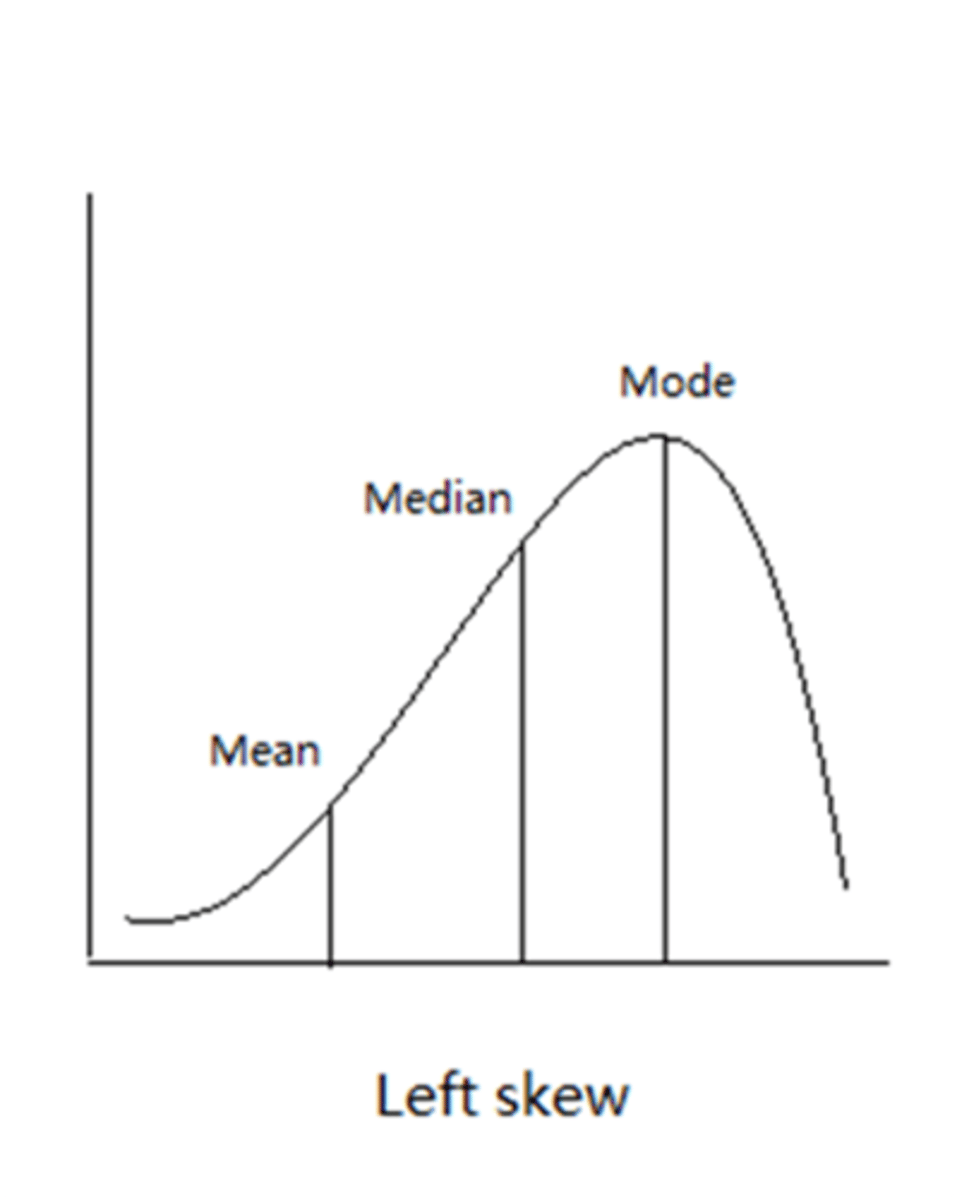
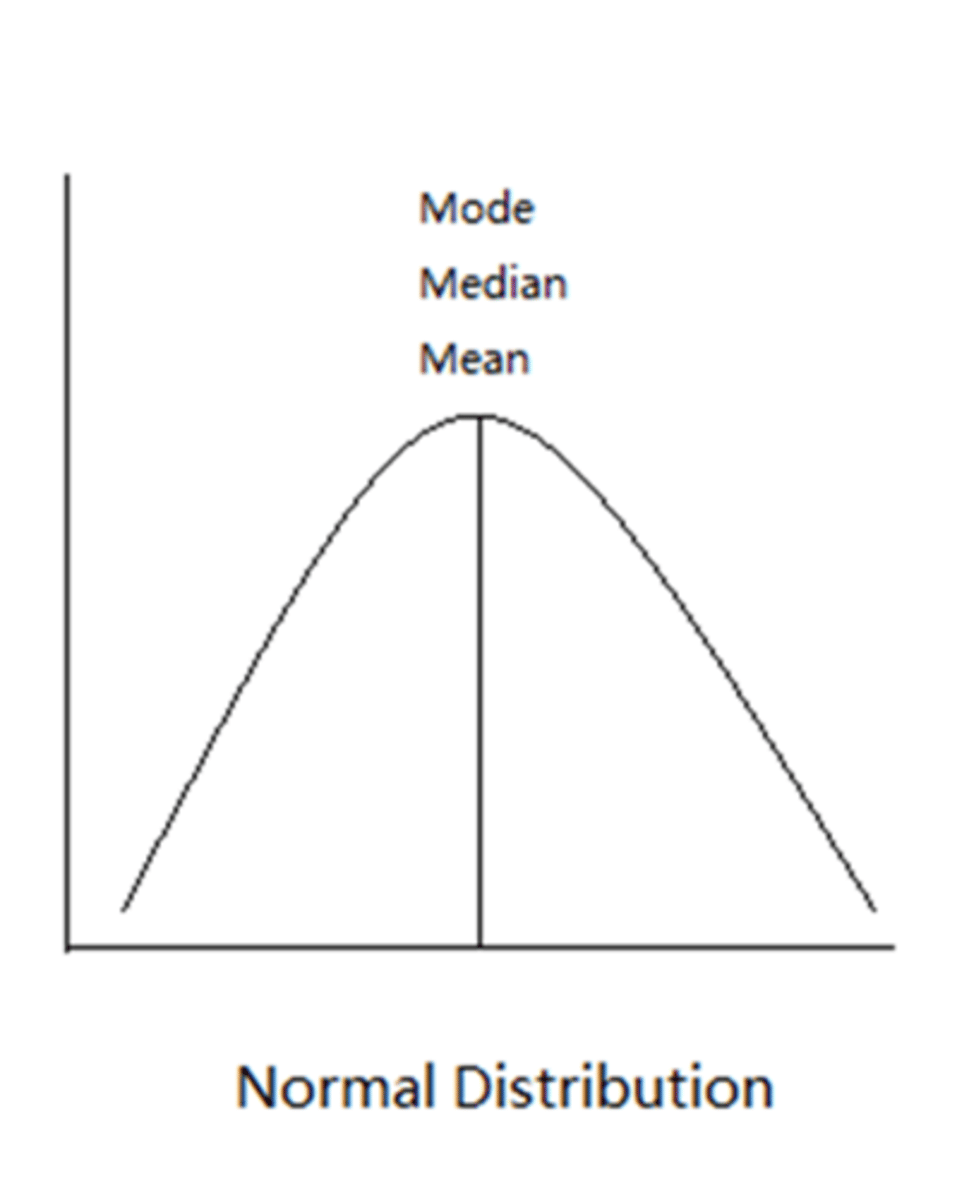
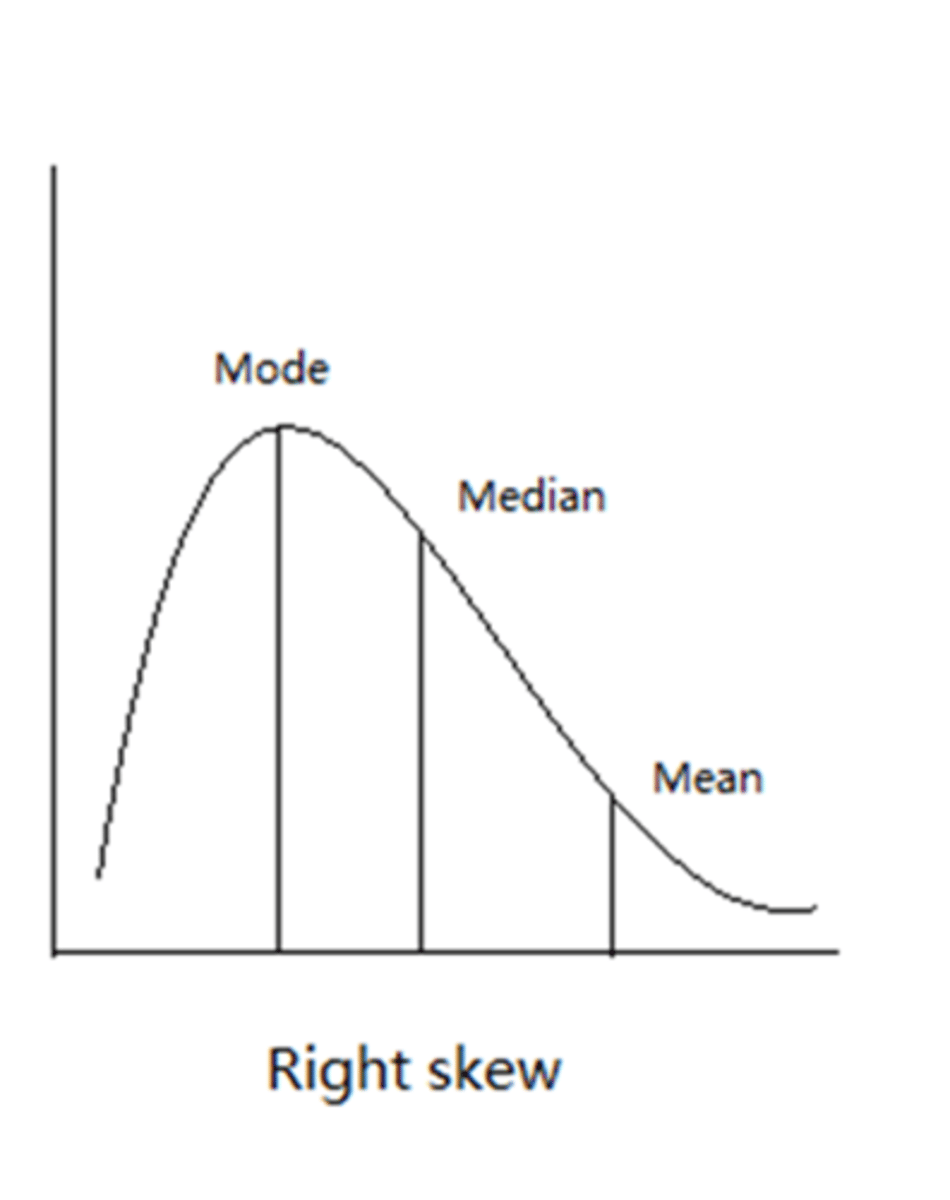
what are the measures of central tendency
index of typicalness of a set of scores that comes from center of the distribution
components of central tendency
-mode
-median
-mean
what is mode
the most frequently occurring score in a distribution
example of mode
2, 3,3,3,4,5,6,7
mode= 3
what is modality
number of modes
what is amodal
without a mode
what is unimodal
one mode
what is bimodal
two modes
-peak times at restaurant= 12 pm and 4 pm
what is the median
the point in a distribution above with and below which 50% of cases fall
example of median
2,3,3,3,4 I 5,6,7,8,9
median= 4.5
what is the mean
equals the sum of all scores divided by the total number of scores
example of mean
2,3,3,3,4,5,6,7,8,9
mean = 5
standard deviation in normal distribution

left skew distribution of central tendency
normal distribution of central tendency
right skew of distribution of central tendency
what is measures of variability (variation in data) concerned with
spread of data
what is spread of data
quantifications of how tightly clustered around the mean the sample is
what are the types of measures of variability
-homogeneity
-heterogeneity
what is homogeneity
light variability --> tightly clustered = fairly homogenous
what is heterogeneity
great variability --> widely dispersed = heterogenous
what is the range
the simplest but most unstable measure of variability
how do we calculate the range
highest score minus lowest score
disadvantage of the range
it is very sensitive to extreme observations
-it depends on the sample size (n)
-that is, the larger the n is, the larger the range tends to be
-this makes it difficult to compare ranges from different data sets of differing sizes
what is another approach in quantifying the spread in a data set instead of using range
quartiles
what is Q1
25th percentile
what is Q2
50th percentile
what is Q3
75th percentile
what is semiquartile range
range of the middle 50% of scores
what is interquartile range
IQR= 75th percentile (Q3)- 25th percetile (Q2_
what is standard deviation
another measure in quantifying the spread in a dataset
-how far the variables are spread from the mean
what are inferential statistics useful for
analyzing the data in relation to the hypothesis under study
-is there a difference between the groups
-is there a relationship among the variables
what do inferential statistics do
a means of drawing conclusions about a population from a sample
what are inferential statistics based on
laws of probability leading to generalization
what do inferential statistics determine
whether an observed difference in two sets of data is small (not significant) or large (significant)
what is Chi-square (x2) test
used when data are at the nominal level and the researcher wants to determine whether groups are different regarding the outcomes
examples of chi-square test
what is H0 in a chi-square
•Ever use e-cig" is independent of gender or There is no relationship between "ever" use e-cig" and "gender" or "the proportion of males and females who every use e-cig is equal "
what is H1 in chi square
•"Ever use e-cig" is dependent of gender or There is a relationship between "ever" use e-cig" and "gender" or "the proportion of males and females who every use e-cig is not equal "
what is chi-square test used for
to test the association between any two categorical variables
steps to calculate chi-square
•Determine Observed frequencies and Expected frequencies
•Calculate Chi-square test ( aka got Chi-square value/number)
•Determine Degree of Freedom: DF = (row-1) x (Column -1)
•Determine the alpha level (p=0.05)
•Consult the Chi-square distribution table to determine the Critical value based on the alpha level (0.05) and the degree of freedom, DF = (row-1) x (Column -1)
•Judge whether the critical value is statically significant. If Chi-square value > Critical value and the p-value < alpha (0.05), then we have evidence to reject the Null hypothesis
what is t-test
statistically tests whether two group means are different
when do we use a t-test
data are normally distributed, and data are measured at interval-level and ratio-level
what is independent t-test (two sample t-test)
compare two independent groups with respect to their mean scores on a continuous outcome
when is an independent t-test used
in between-subjects design
-independent observation both between (each subject can only provide 1 observation)
example of an independent t-test
aimed at testing if means between men and women is different regarding the continuous outcome (midterm scores)
what is left handed vs right handed
(dominant hand) on a continues outcome (scores of adaptation of daily living after brain surgery)
what does a t-test test
whether two group means are different
what does data need to be in t-test
use when data are normally distributed and data are measured at interval-level and ratio-level
what is paired t-test (correlated t-test)
the observations are not independent)
when do we use paired t-tests
within-subjects design
-the same subject may be measured before and after receiving a treatment
components of paired t-test
•Natural pairs (i.e., twins, sibling, etc.) may be assigned randomly to two treatments, whereby each member of a single pair receive different treatments
•Pairs may be formed by matching individuals on some characteristics.
•For example, means for patients reporting pain scores before and after surgery
what is appraisal for EBP for descriptive and inferential statistics
•Were appropriate descriptive statistics or interferential statistics used?
•What level of measurement is used to measure each of the major variables?
•Has the researcher provided enough information to decide whether the appropriate statistics were used?
•Are the statistics used appropriate to the problem, the hypothesis, the method, the sample, and the level of measurement?
•If tables and graphs are used, do they agree with the text and extend it, or do they merely repeat it?
•Are the results understandable?
•Is a distinction made between clinical significance and statistical significance? How is it made?
what is an independent samples t-test
•An independent samples t-test computed on number of outpatient visits revealed that homeless veterans had significantly higher numbers of outpatient visits in 2010 than nonhomeless veterans, t(18) = 2.13, p < 0.05; = 24.7 versus 15.4
what is the most a t-test can compare
2 independent samples/groups at one time
when should a t test not be done
•When you compare two means at a time, the rest of the means under study are ignored.
•Increased Type I error - wrongly rejecting null hypothesis when in fact there is not difference.
•The more means that are to compare, the more t tests are needed.
what is one way analysis of variance (ANOVA)
used to test the equality of three or more means using sample variances
what test do we use for ANOVA
F test
what is the Ftest
all the means are compared simultaneously
-maintain the type 1 error at the specified alpha level
-only need one test in order to make a decision on whether all means are equal or not
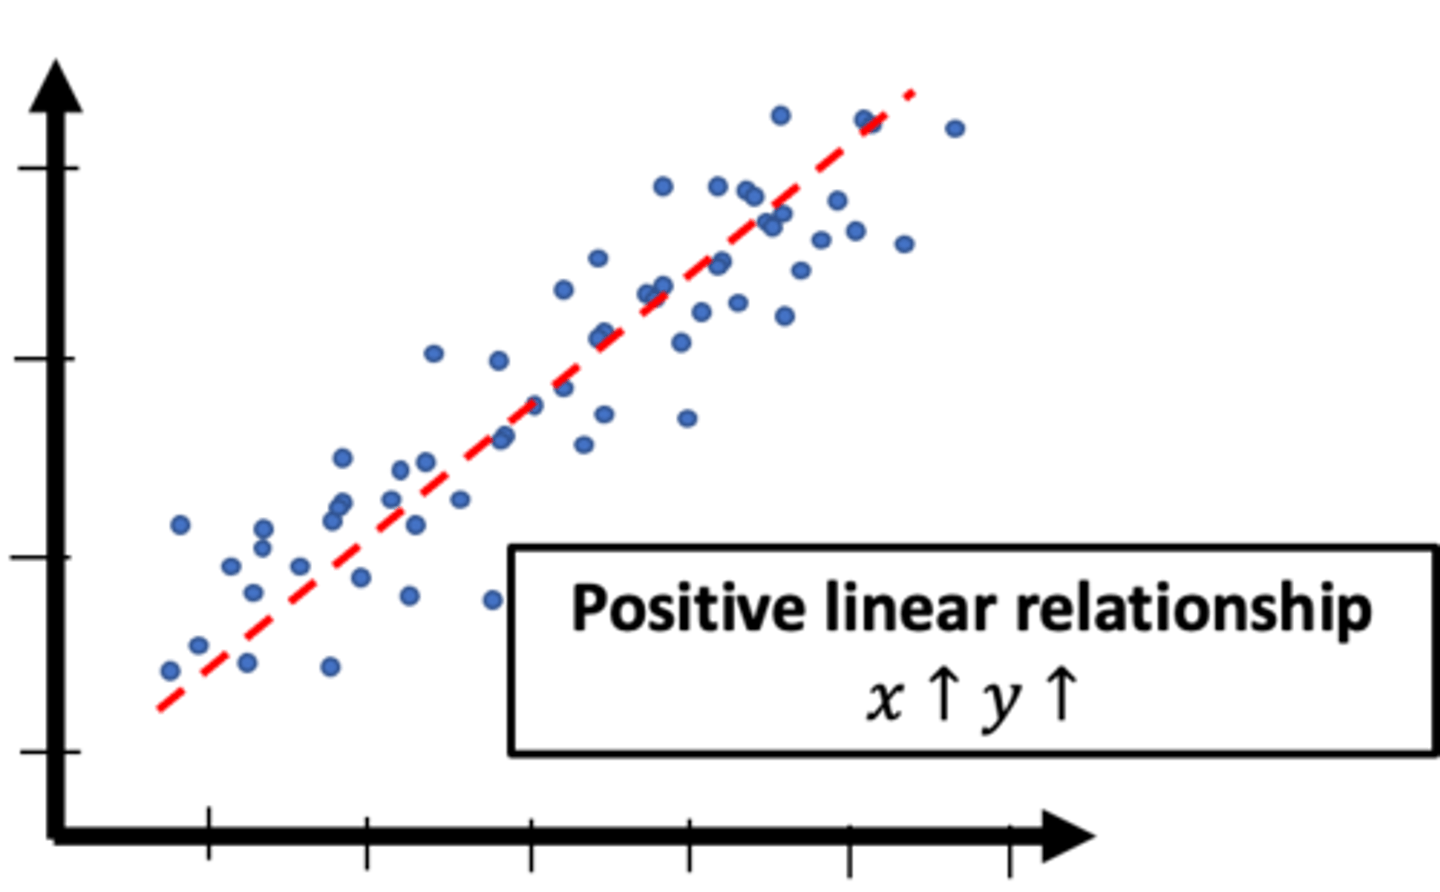
what is correlation coefficients (persons R) used for
interval or ratio data
what is correlation coefficients (persons R) used to determine
the strength and direction of the linear relationship between two variables
how do we examine pearson's r
•Are two or more variables linearly related? If so, what is the strength of that relationships? What type of relationship exists?
examples of pearson's R
-BP and age
-height and weight
-concentration of an injected drug and HR
-consumption level of some nutrient and weight gain
-total family income and medical care expenditure
-intensity of a stimulus and rxn time
positive linear relationship on a scatter plot
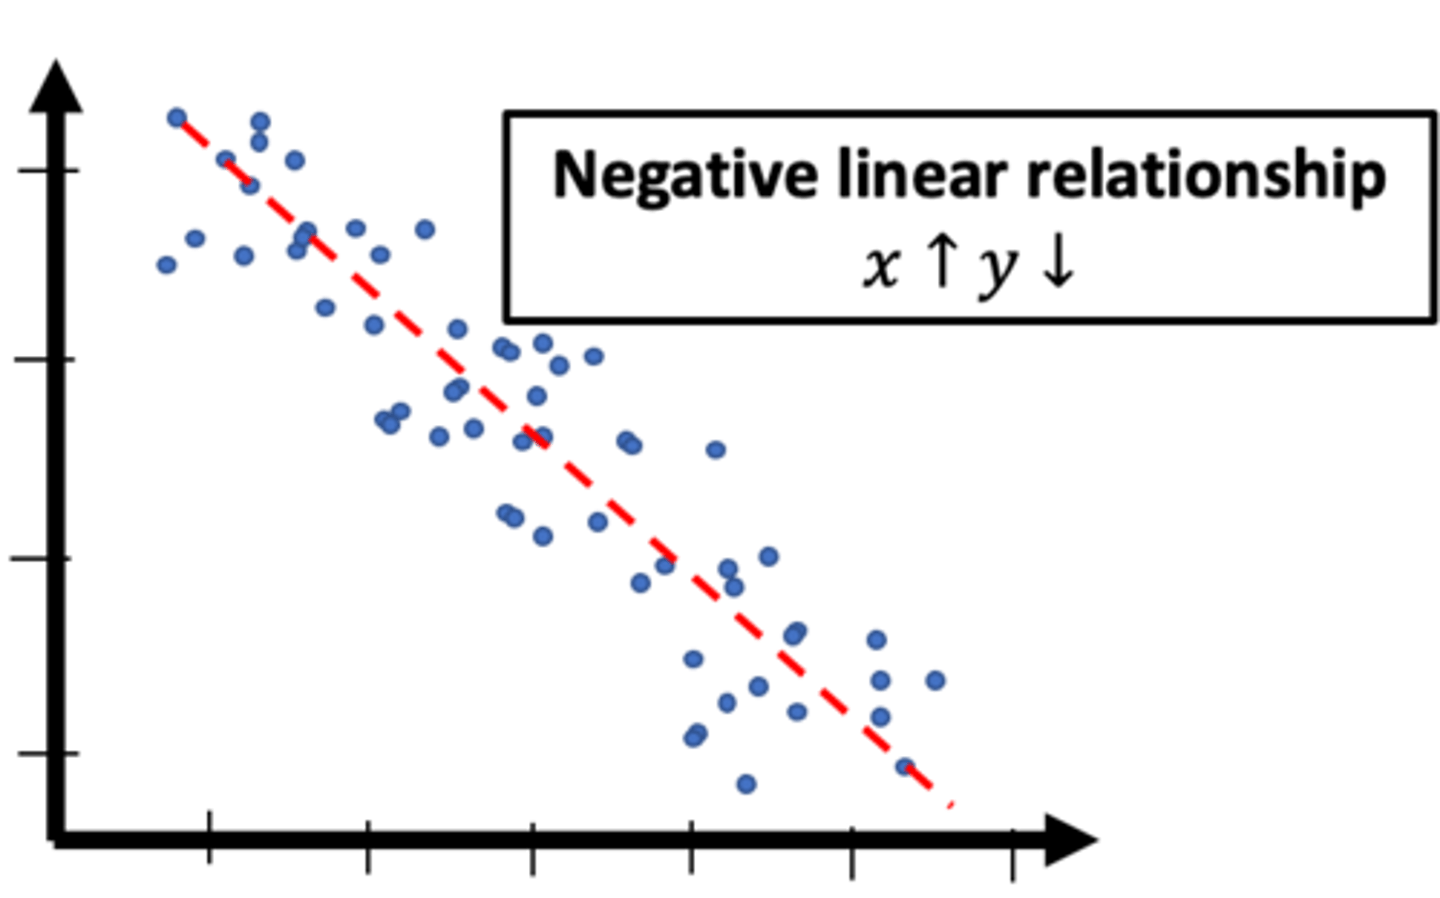
negative linear relationship on a scatter plot
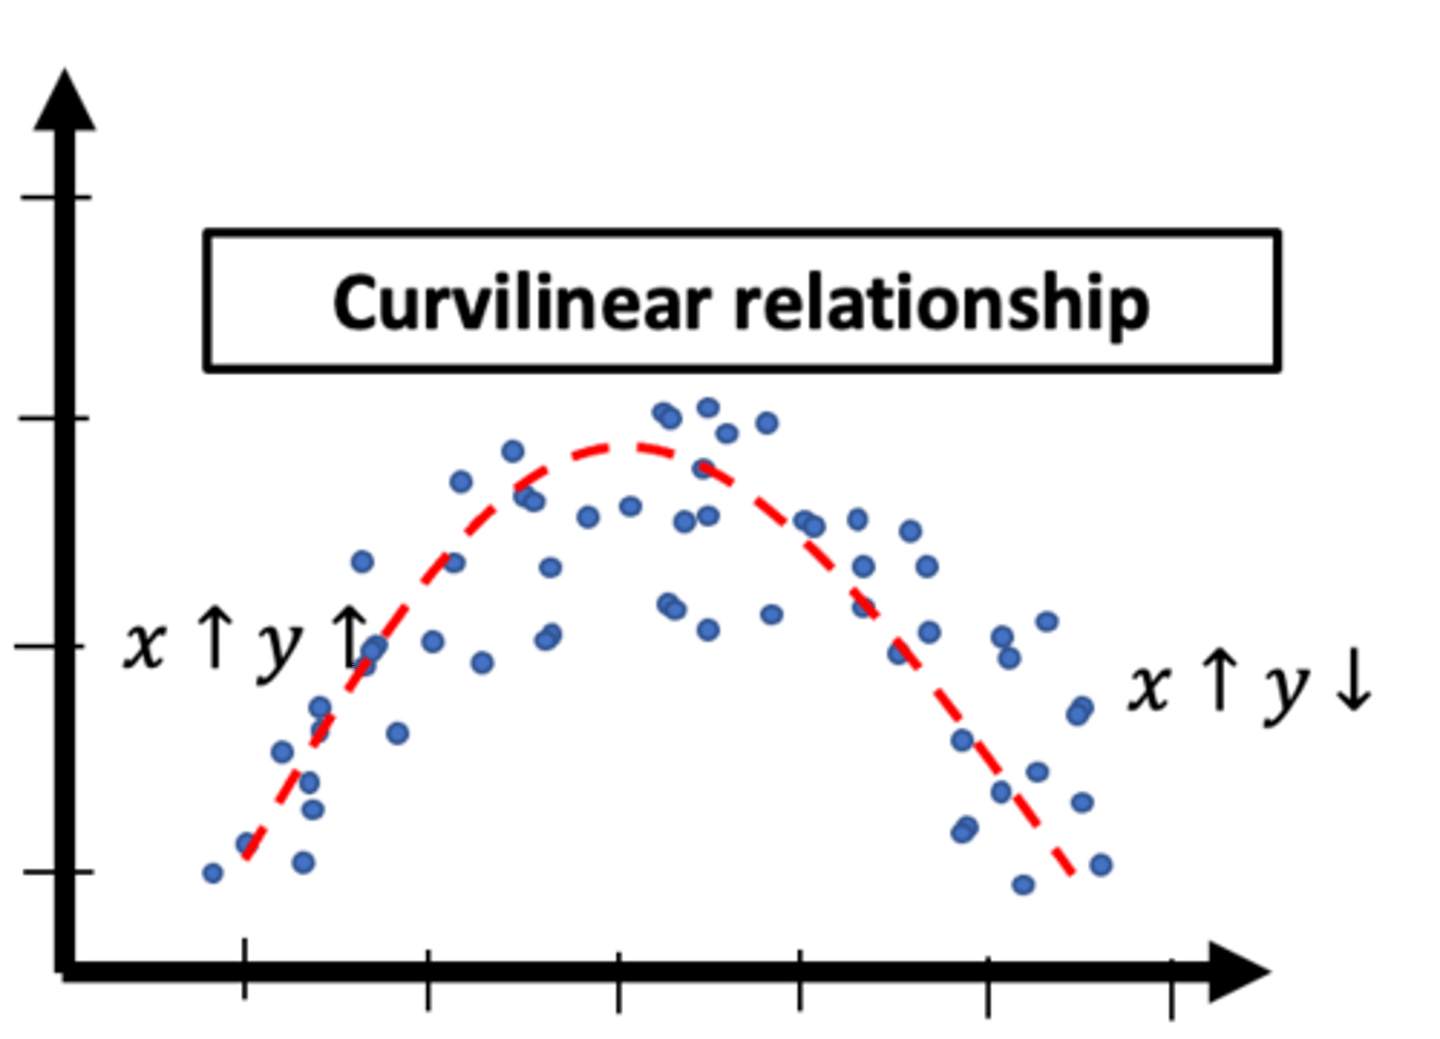
what is curvilinear relationship on a scatter plot