Semester 1
1/81
There's no tags or description
Looks like no tags are added yet.
Name | Mastery | Learn | Test | Matching | Spaced |
|---|
No study sessions yet.
82 Terms
REVIEW OF BASIC CONCEPTS
REVIEW OF BASIC CONCEPTS

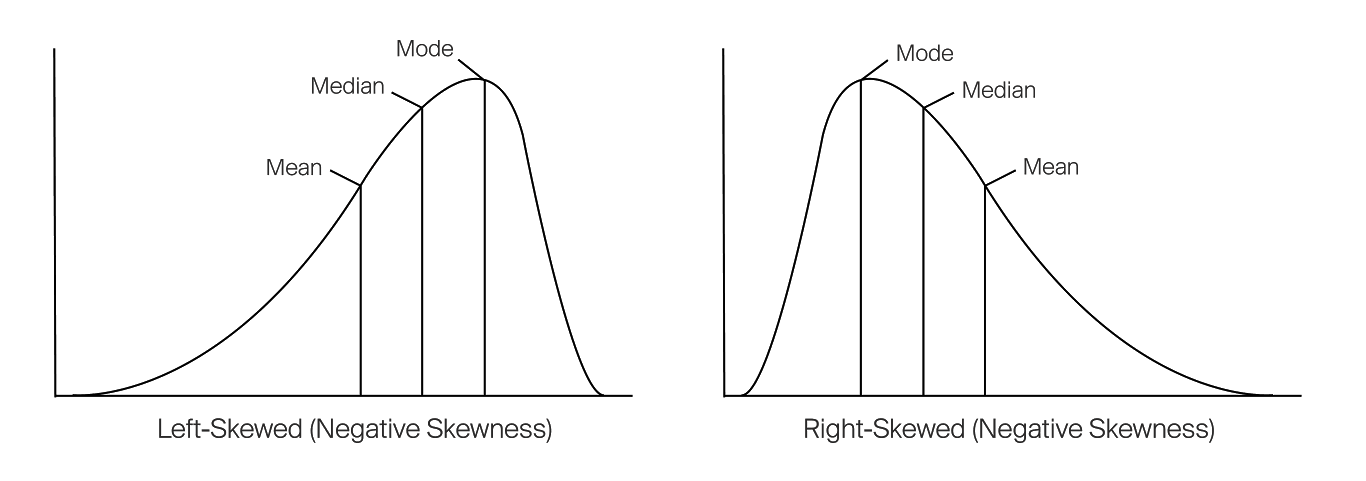
Describe the mean/median for:
Right skew distribution
Left skew distribution
*Remember = wherever line is going (negative/positive)*
Left skew (negative) = mean < median
Right skew (positive) = mean > median
mode in middle - others to left/right of it
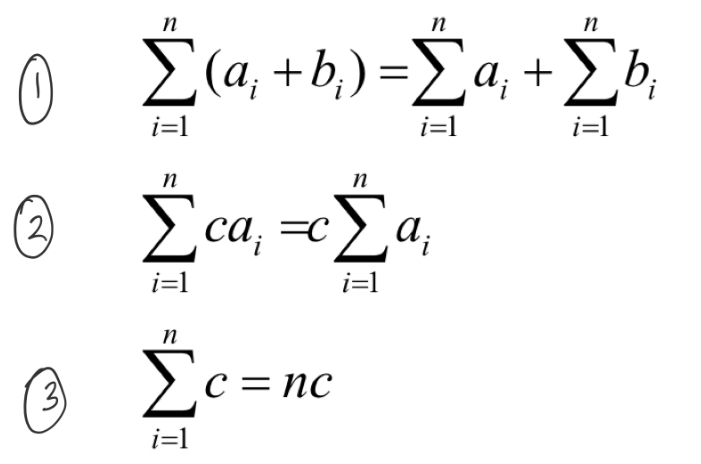
MEASURES OF VARIATION AND SET THEORY
MEASURES OF VARIATION AND SET THEORY
go through symbols
go through symbols
INTRODUCTION TO PROBABILITY
INTRODUCTION TO PROBABILITY
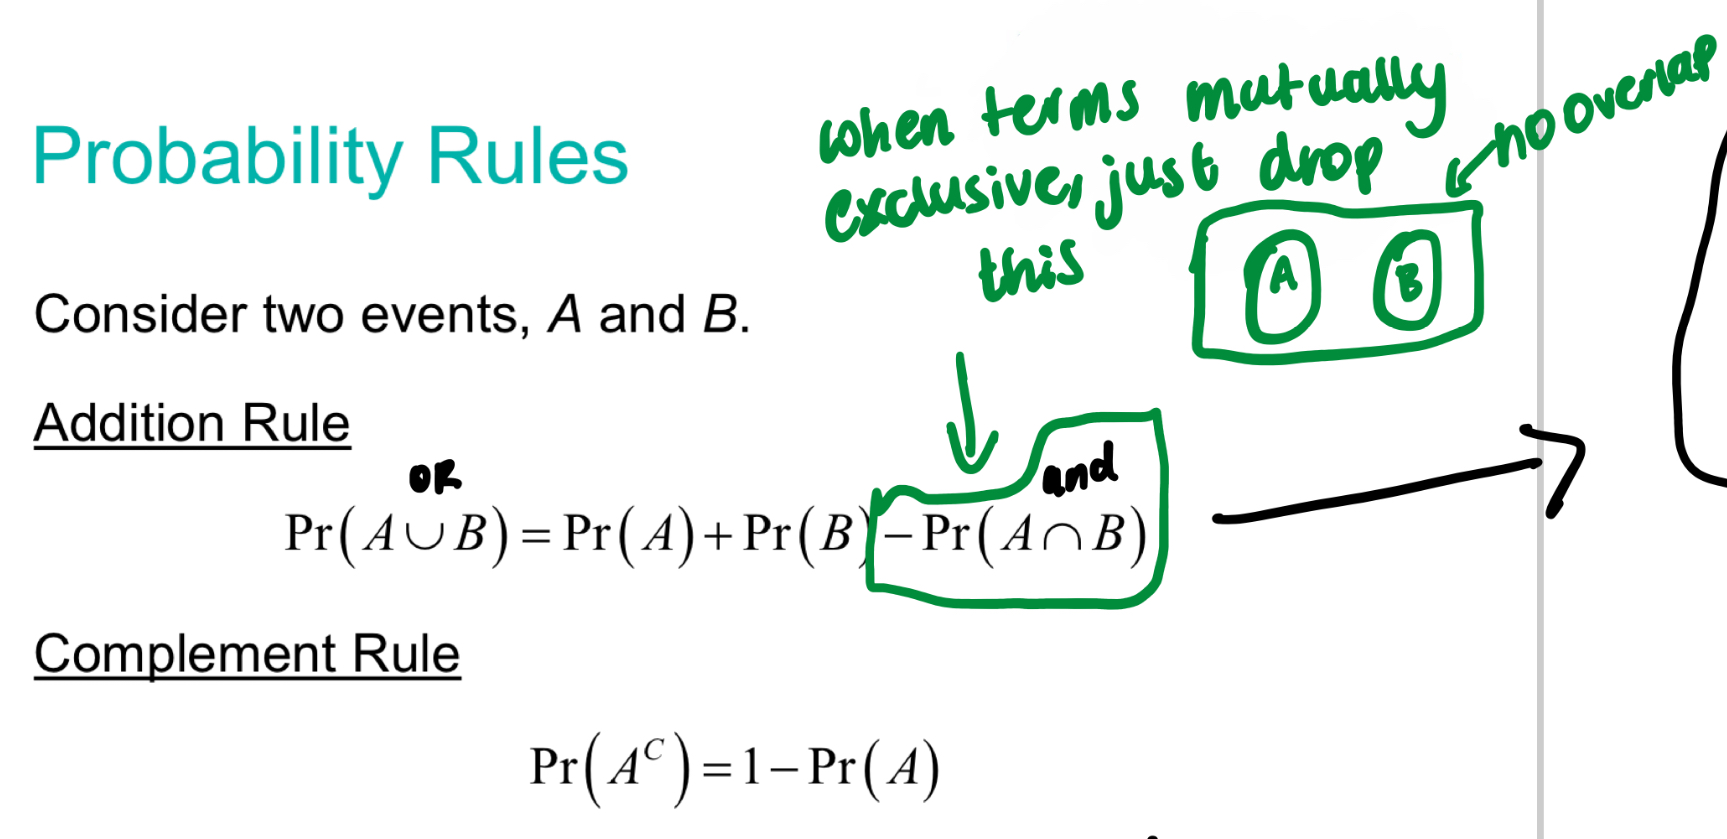
What are the formulas for the 2 probability rules?
What does of:
0
1
indicate?
0 - event won’t occur
1 - event certain to occur
CONDITIONAL PROBABILITY
CONDITIONAL PROBABILITY
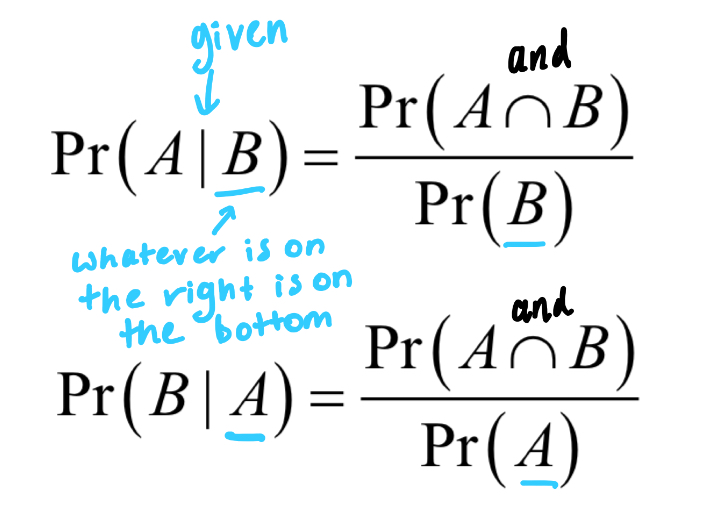
What is conditional probability?
Probability of one event occurring giving another event has already happened
Using conditional probabilities, we can have 3 rules of probability - what are these?
Conditional probability
Multiplication rule (conditional rearranged)
Total probability rule
What is the formula to work out conditional probability?
(working out something is something given something else has happened)
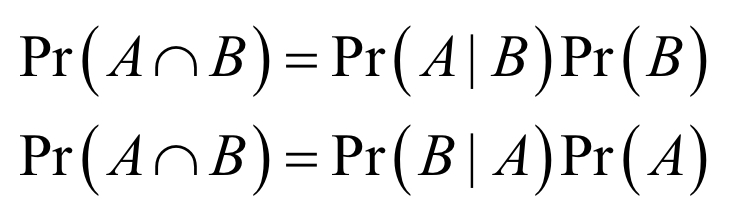
What is the formula to work out the multiplicative rule?
(something times something when we have conditional probabilities)
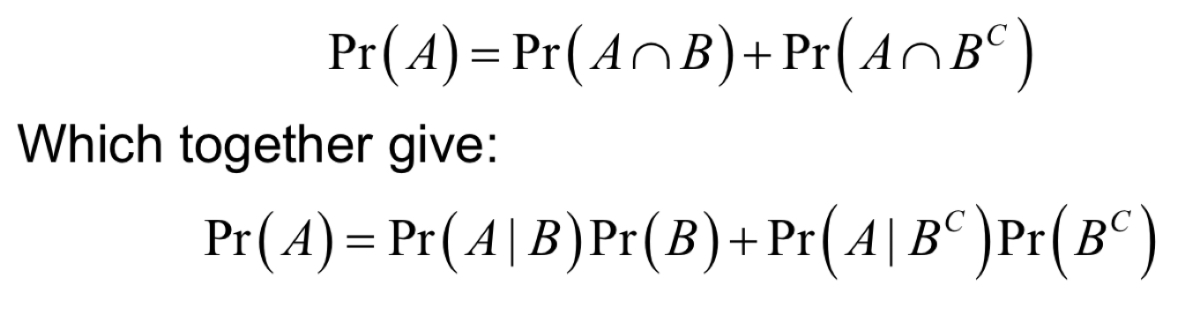
What is the formula to work out the total probability rule?
(total probability of one thing, using multiplied numbers or either conditional numbers)
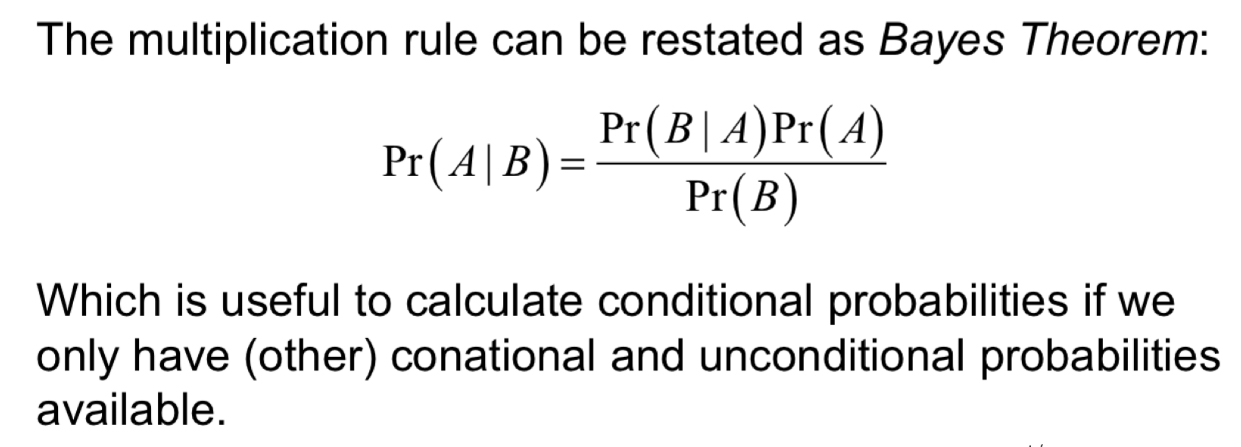
What is bayes theorem and when do you use it?
Use it when the question asks you to ‘flip’ a conditional probability
E.g. if the questions asks:
P(S|L) - probability, given you are in London, that you are in a particular sector
But the only information you have is P(L|S) - probability in London given you are in a sector
use it if: condition in question does NOT match the condition in the data
What is the formula for bayes theorem?
How can we work out the relationship between 2 variables?
(Either dependent or independent)
Statistically independent if:
P(A∩B) = P(A) x P(B)
P(A∩B∩C∩D) = P(A) x P(B) x P(C) x P(D)
OR
P(A|B) = P(A)
*REMEMBER - LOOK AT A Q AND SEE IF THE NUMBERS GIVEN ARE*:
Probabilities already (e.g. 0.7, 0.48)
Or just data/answers (60, 80, 100)
*REMEMBER - LOOK AT A Q AND SEE IF THE NUMBERS GIVEN ARE*:
Probabilities already (e.g. 0.7, 0.48)
Or just data/answers (60, 80, 100)
*REMEMBER - CAN’T JUST ADD UP CONDITIONAL PROBABILITIES TO GET A TOTAL PROBABILTIY OF SOMETHING*:
e.g. to get P(A) can’t add up P(A|B) + P(A|C), etc.
have to times conditional by main probability P(A|B) X P(B)
*REMEMBER - CAN’T JUST ADD UP CONDITIONAL PROBABILITIES TO GET A TOTAL PROBABILTIY OF SOMETHING*:
e.g. to get P(A) can’t add up P(A|B) + P(A|C), etc.
have to times conditional by main probability P(A|B) X P(B)
DISCRETE RANDOM VARIABLES
(counting)
DISCRETE RANDOM VARIABLES
(counting)
What are discrete random variables?
A variable that can take any whole number values as outcomes and a finite number of outcomes of a random experiment
E.g. have a situation (tossing a coin), random variable = number of heads
Discrete = can list all possible values & can count them (countable)
Probability is the measurement about the variable
How is this written?
P (X = x) = p (x)
e.g.
P (X = 1) = 1/6
What are properties of discrete random variables?
Pr has to be between 0 < P(x) < 1 (cant be negative)
Individual Pr sums to 1
Mutually exclusive (2 separate circles) & collectively exhaustive (covers all data)
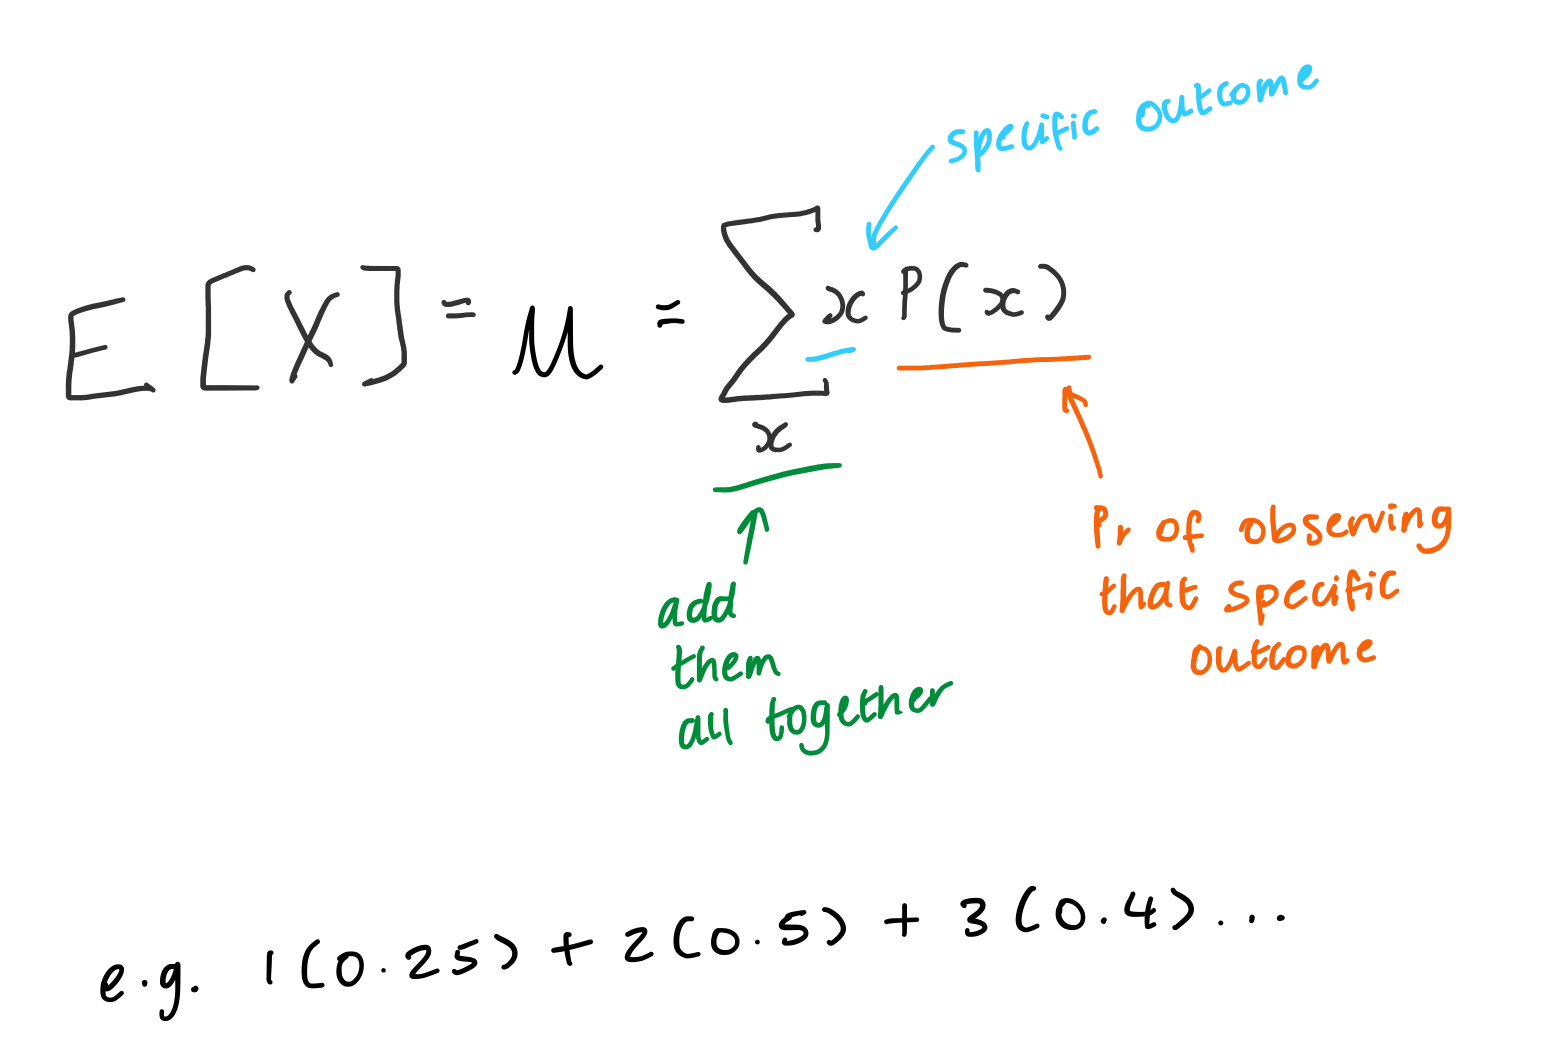
What is an E[X]?
(and how is it different to the mean)
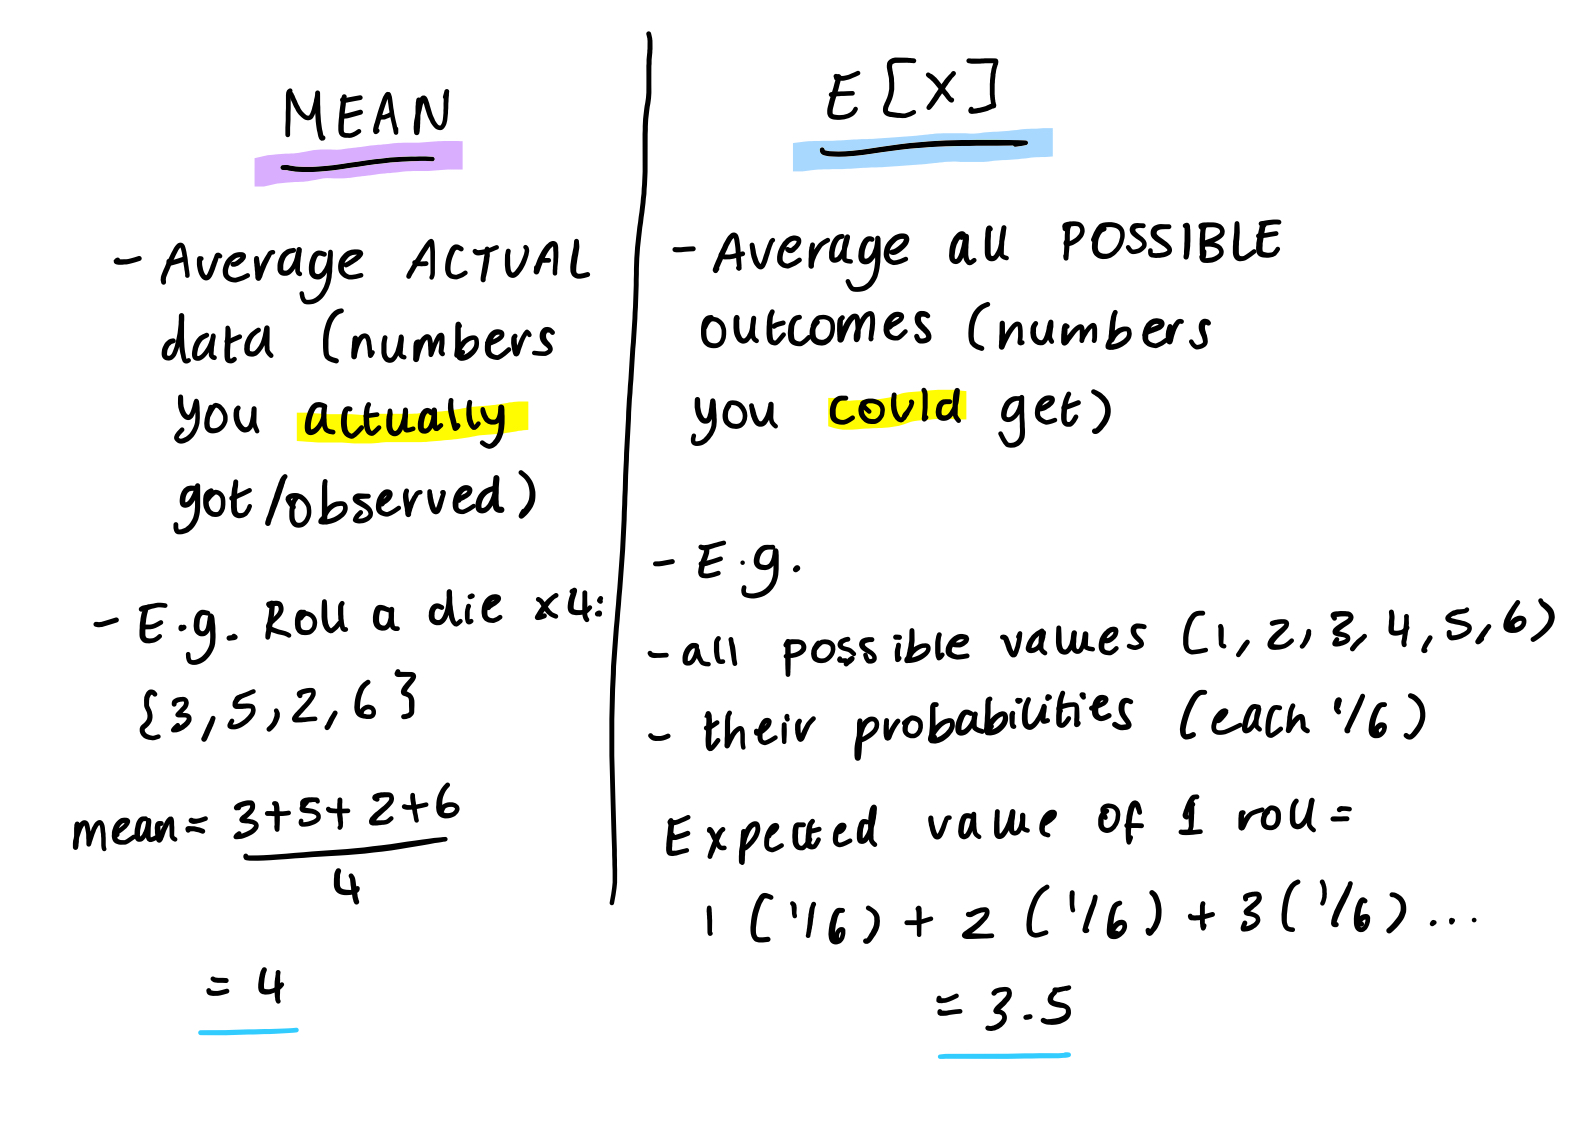
What is the formula for the E[X]?
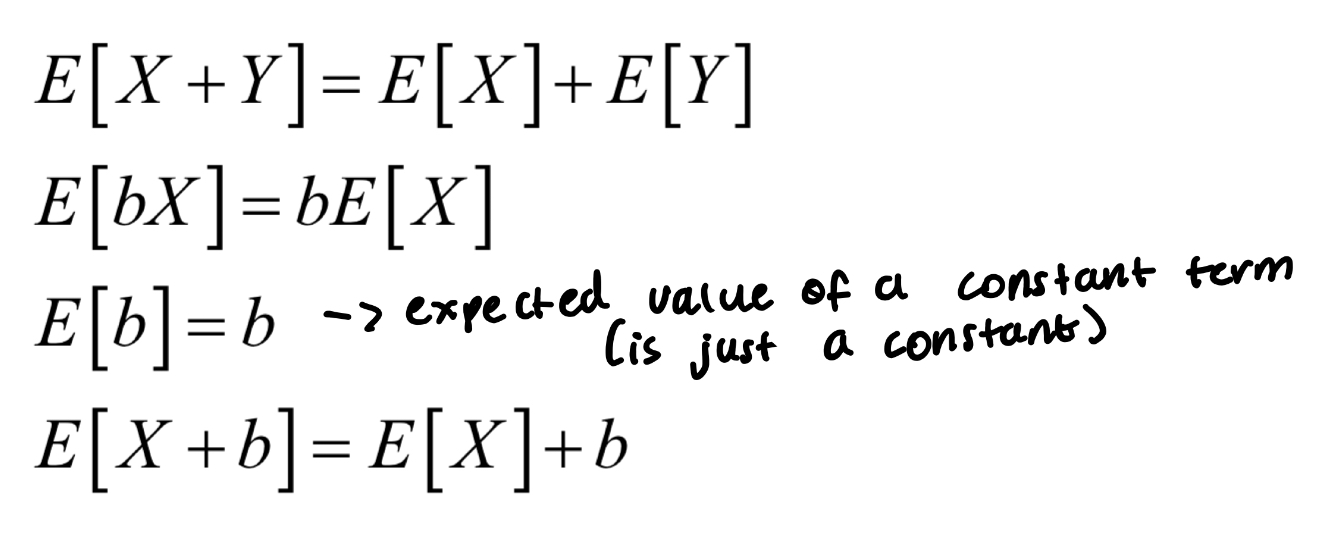
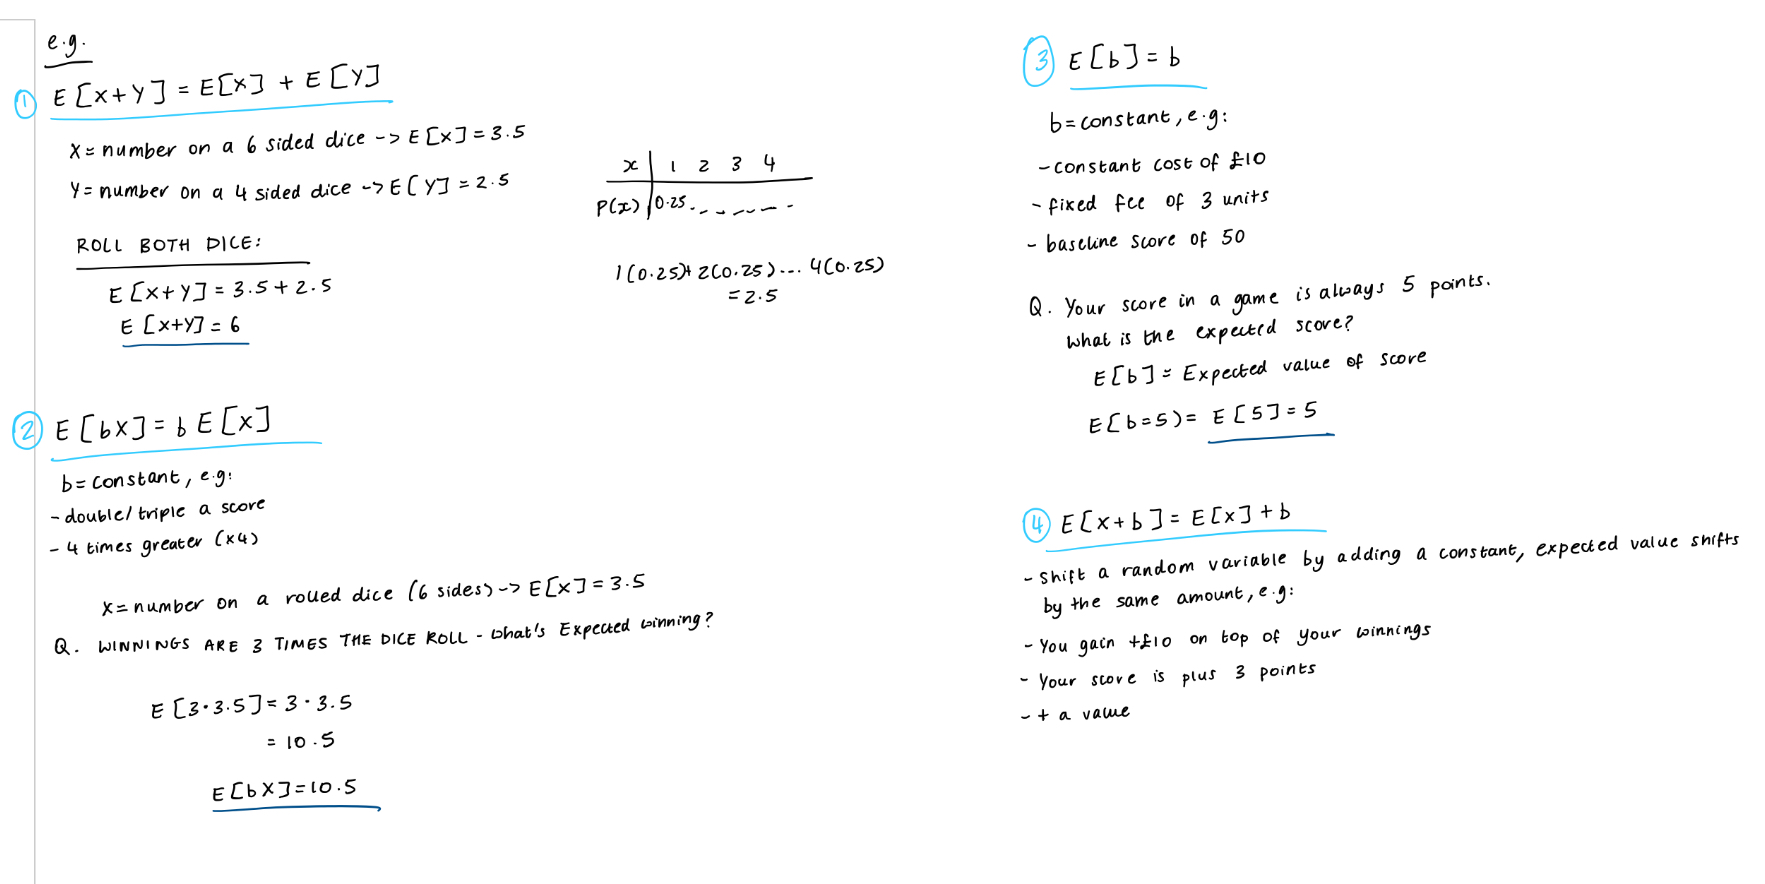
What are the properties of an expected value? E[X]

What is the formula for variance for a discrete random variable?
Var[X]
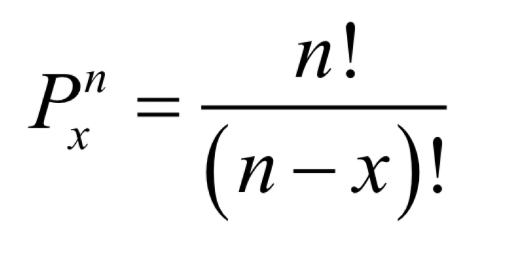
What is the formula for permutations?
What is the formula for combinations?
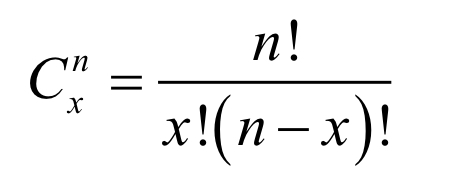
What is the difference between permutations and combinations?
(when would you use both)
Permutations = order matters (ABC AND BCA are not the same thing so count as 2)
Combinations = order does not matter (ABC and BCA are the same thing so count as 1)
Pnx > Cnx
(when answer a question have to work out whether the data the order matters or not)
Mean and variance for Bernoulli distribution?
mean = p
variance = p(1-p)
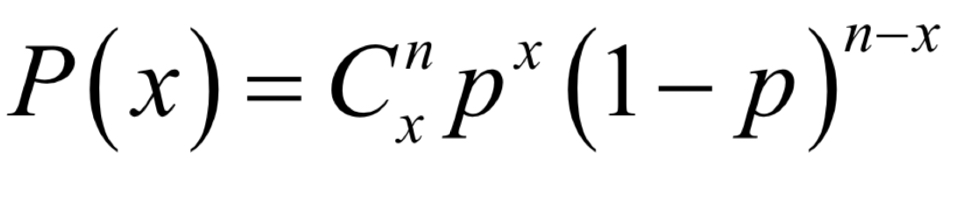
What is a binomial distribution?
Sum of all Bernoulli trials
> Describes outcome of a series of n independent Bernoulli trials
successes vs failures
What is the formula for a binomial distribution?
Cnx = amount of successes you can get out of n Bernoulli trials
What are the 2 properties of a binomial distribution?
mean
variance
μ = E[X] = np
σ² = Var[X] = np(1-p)
What are the 4 things that make an experiment be distributed binomially?
(BINS)
B - binary outcomes (2 given outcomes - success or failure)
I - independent trials (success/failure of one event shouldn’t affect success/failure of another event)
N - have a defined N number of trials
S - same p per trial (all trials have same p each time)
How to figure out something if you are asked ‘at least one is..’, ‘at least two are..’ ‘ no more than 3 are…’
ALWAYS USE THE COMPLEMENT
complement = 1 - p(x= complement)
e.g. at least one late (8 flights):
p (x>1) = 1 - p(x=0)
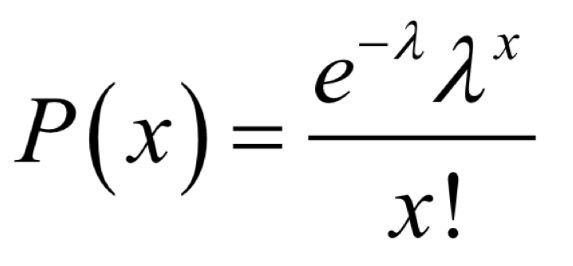
What is poisons distribution?
Poisson distribution formula?
mean and variance?
Count of events within a time interval (using rare events)
Mean and variance = λ = np
0! = 1
1! = 1
0! = 1
1! = 1
CONTINUOUS RANDOM VARIABLES
(measuring)
CONTINUOUS RANDOM VARIABLES
(measuring)
What are continuous random variables?
A variable that you are measuring not counting and there are infinitely many possible values
Continuous = can’t list all possible values
E.g. height, weight, time, etc.
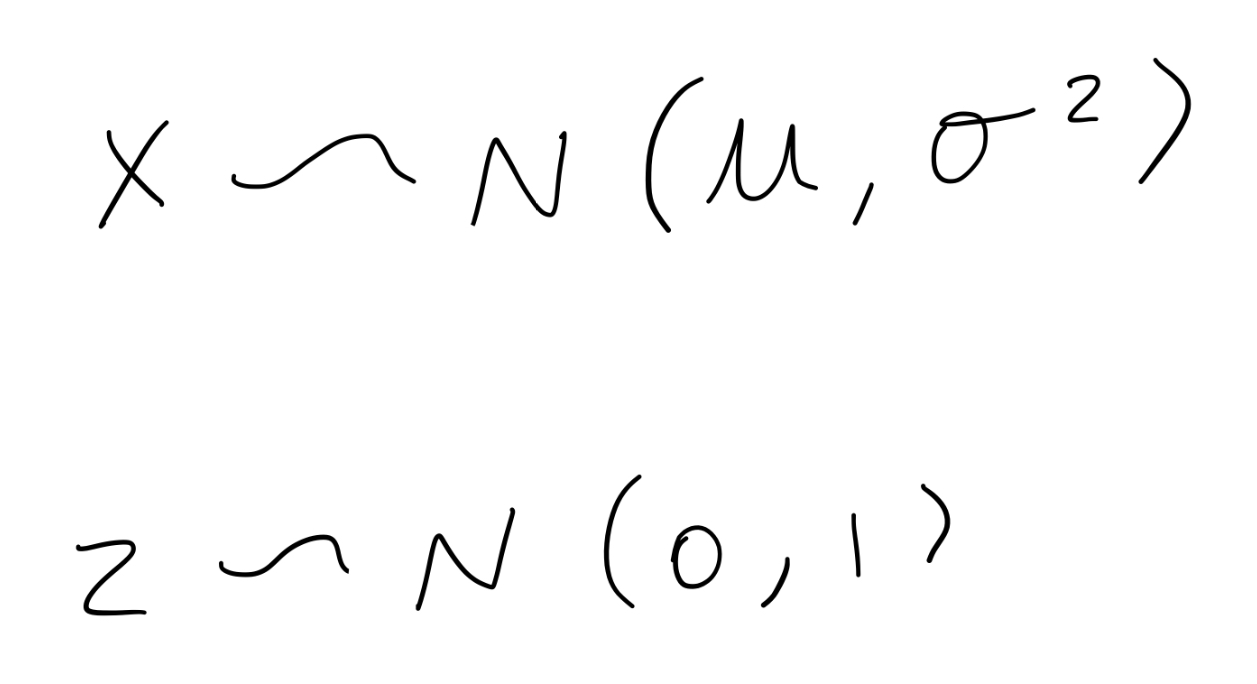
What is the expression you write when a variable has a:
Normal distribution
Standard normal distribution
And what is the difference?
Normal distribution = x is a normally distributed random variable, centered at mean (u) with a variance of sigma squared (symmetric so has an equal mean, mode and median)
Standard normal distribution = when x is standardised (transformed) into a z value
(the standardised variable z follows a standard normal distribution)
When a random variable is distributed normally, what is its:
E [x]
Var [x]
E [x] = μ
Var [x] = σ2
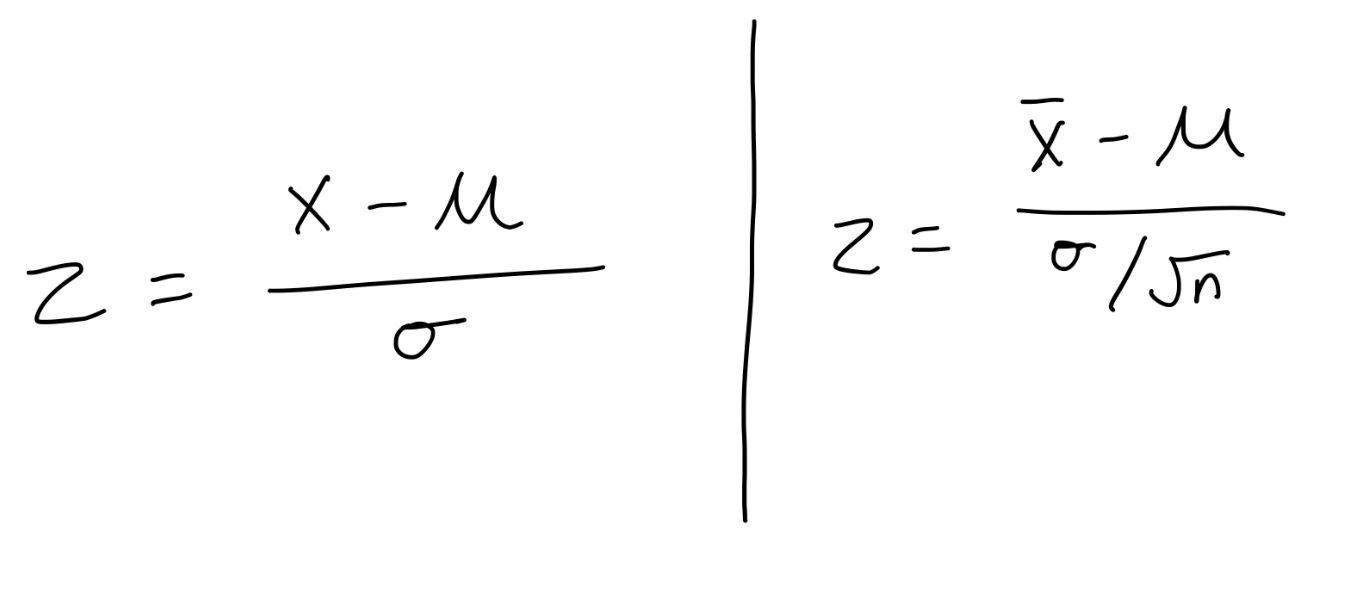
What are the 2 different formulas to calculating a z score and when do you use them?
1) z = x - mu / sigma
> this is for a single observation from a normal distribution - e.g. one person’s height
2) z = x bar - mu/ sigma over square root of n
> this is for a sample mean (bottom bit is standard error of mean) - e.g. height of 50 people
(look if we are given sample mean and population mean or just population mean)
What are the steps to finding a probability for a random variable x that is normally distributed?
Get all info (x value/sample mean, population mean, variance/SD, n if needed)
Sketch normal distribution bell curve X ~ N (mean, variance)
Translate x values into Z values ( Z ~ N (0,1) (either for a singular observation or for a sample) > goes from P (x > number) to P (z > z score)
Use probability table to compute required probability
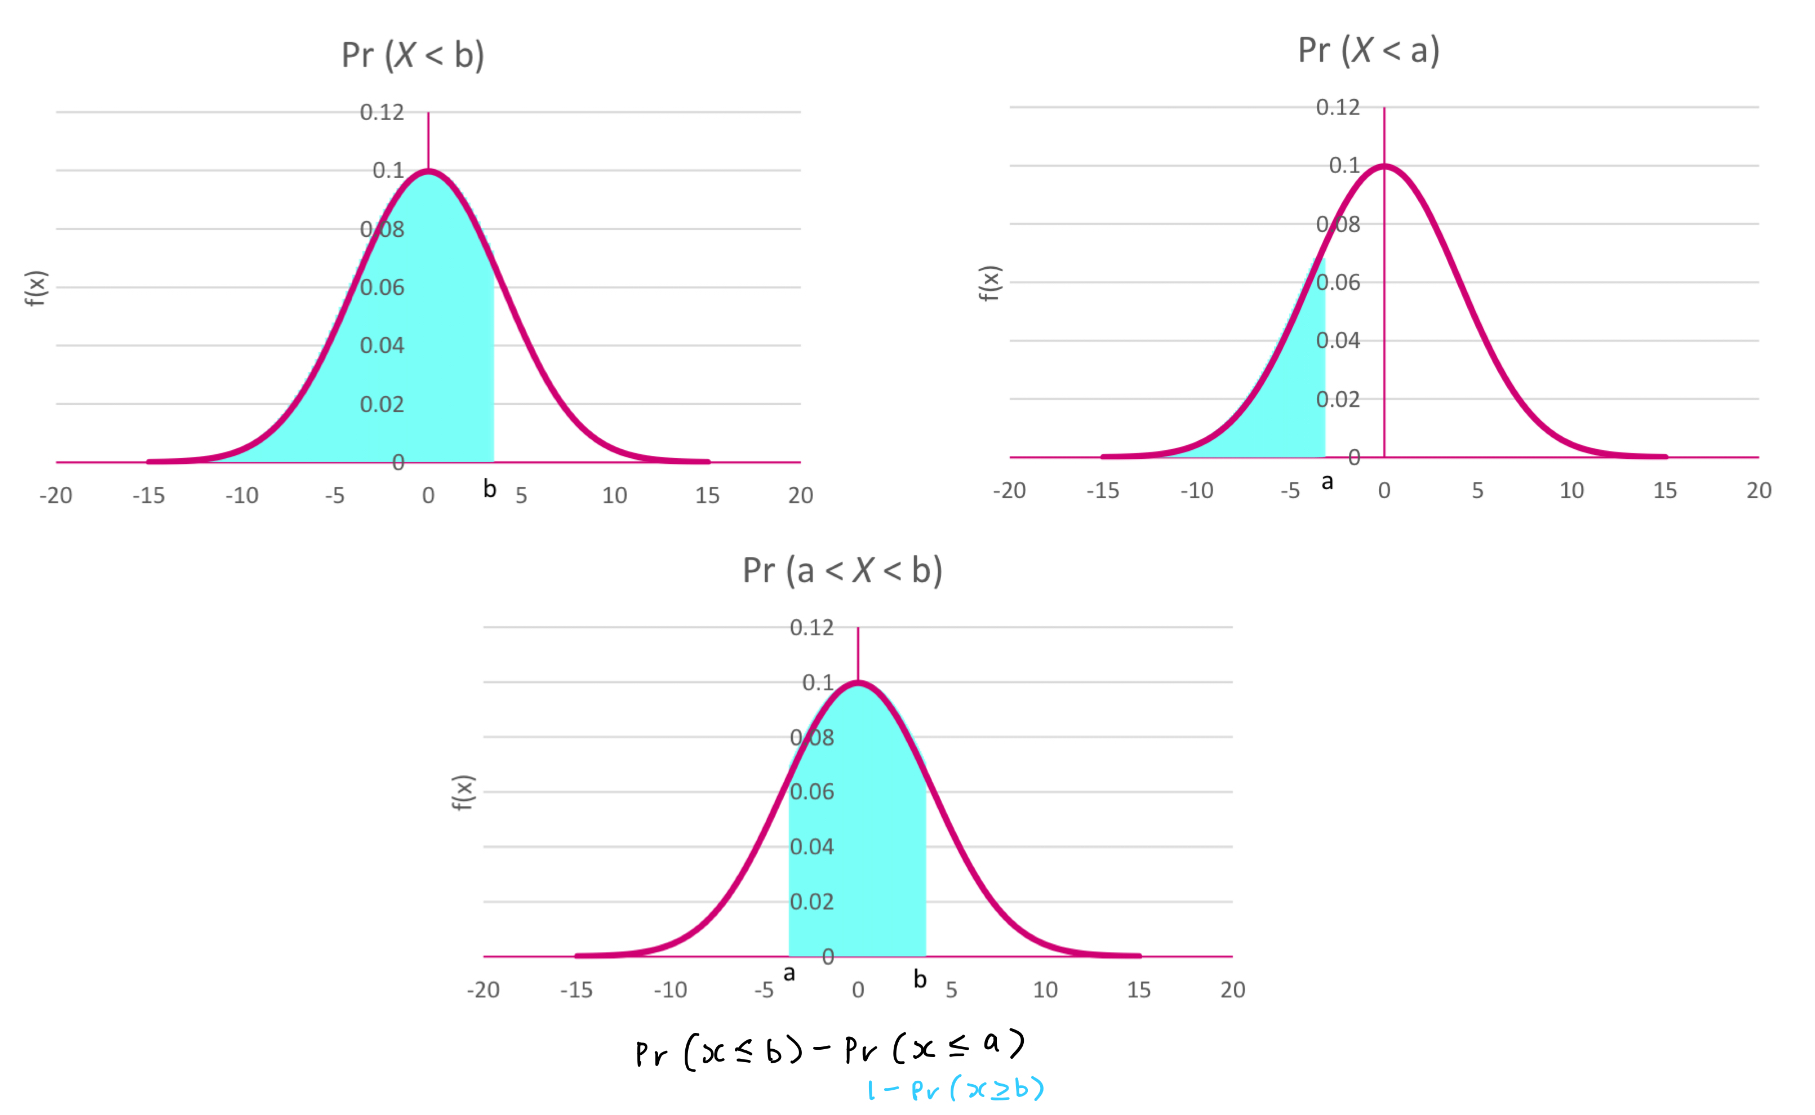
Which part of the tail do you have to work out for each different probability question:
P (x < b)
P (x > b)
P (a < x < b)
If X∼N (5,0.25) evaluate:
P (X > 5.2)
Find z score and prob and minus it from 1 to get x above 5.2
If X∼N (5,0.25) evaluate:
P (X < 5.2)
find z score and prob
If X∼N (5,0.25) evaluate:
P (3.9 < x < 5.3)
find z score for both
3.9 > will be a minus z score so have to minus from 1 to get prob
5.3 > prob
If X∼N (5,0.25) evaluate:
P (X < 3.8 or X > 4.2)
As they are both below mean (minus numbers) then have to minus both z scores from 1, then overall probability of them 2 minus from 1 to get middle bit
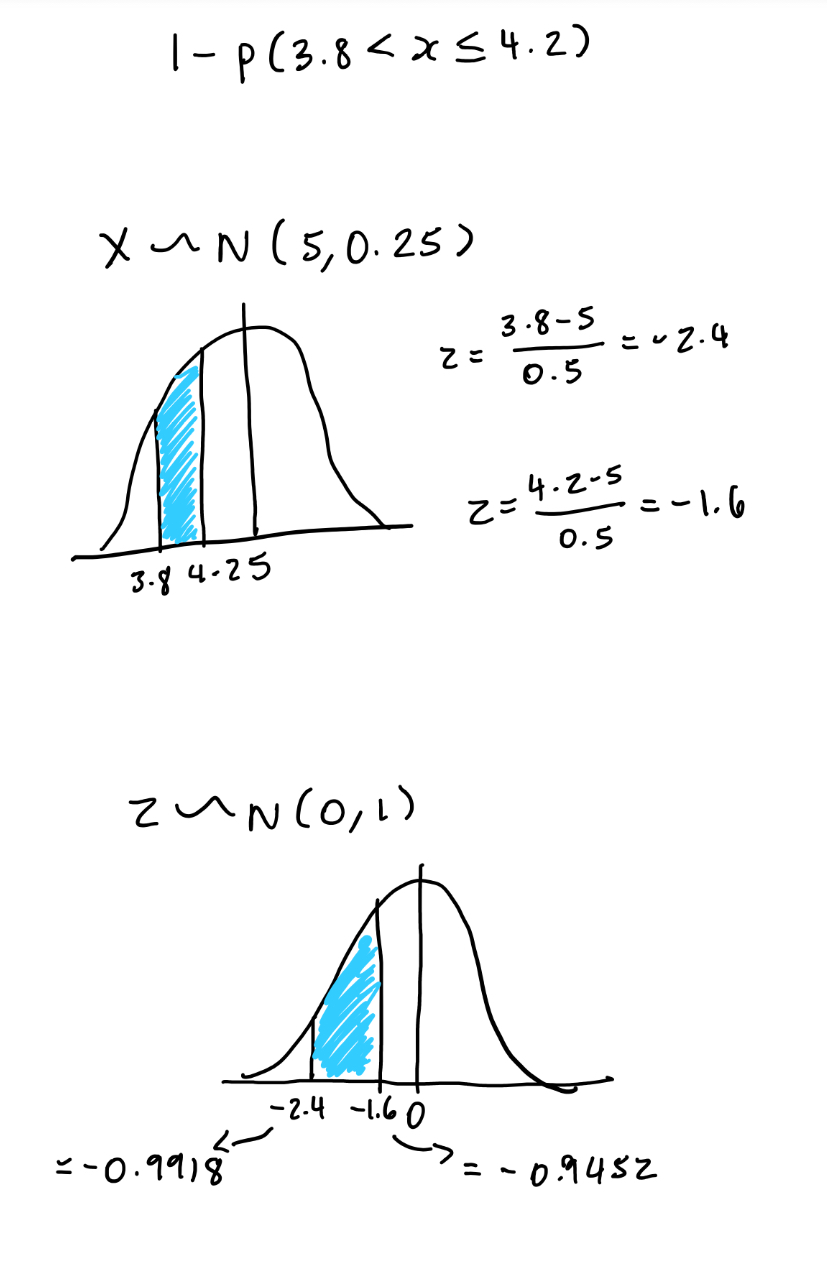
OVERALL - when doing these types of questions, when do you minus from 1?
If they are minus numbers (so below mean)
If the probability you are finding is the right tail probability
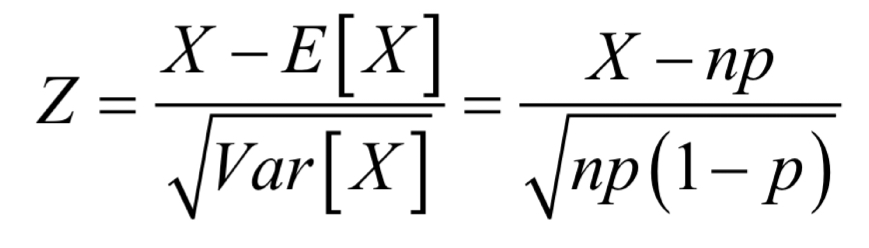
As n grows, the binomial distribution, it can be approximated by the normal distribution, how can a z score be shown using:
E[X] = np
Var[X] = np(1-p)
SAMPLES AND SAMPLING DISTRIBUTIONS
SAMPLES AND SAMPLING DISTRIBUTIONS
*SAMPLING DONE WITH REPLACEMENT* (n = 100, ask 1 person, then move on but keep person in)
*SAMPLING DONE WITH REPLACEMENT* (n = 100, ask 1 person, then move on but keep person in)
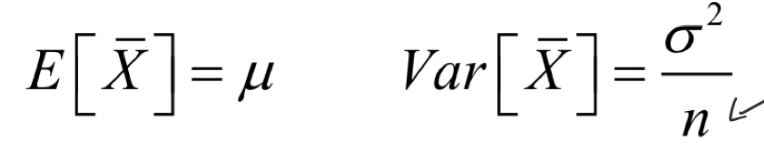
For a (large) sample statistic what is its:
E[X]
Var[X]
What is the Law of Large Numbers?
(what happens as n gets bigger)
Law states that:
(given a random sample size of n from a population mean)
Sample mean will approach pop mean as n increases - this is why E[X] on average = mu
This is because as n gets bigger, our estimate of our mean is getting more precise (variance smaller) > as n goes to infinity, Var [X bar] goes towards 0
E.g. variance = 20, 20/(n=12) = 1.6, 20/32 = 0.6, 20/62 = 0.3
*Regardless of underlying prob distribution*
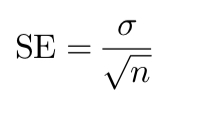
What is the standard error?
What is its formula?
How does the standard error change with n?
Standard deviation of a sample statistic (e.g. sample mean)
Measures how much the mean is expected to vary from sample to sample
Tells us how precise the sample mean is as an estimator of the population mean
Bigger n = smaller SE (more precise estimate)
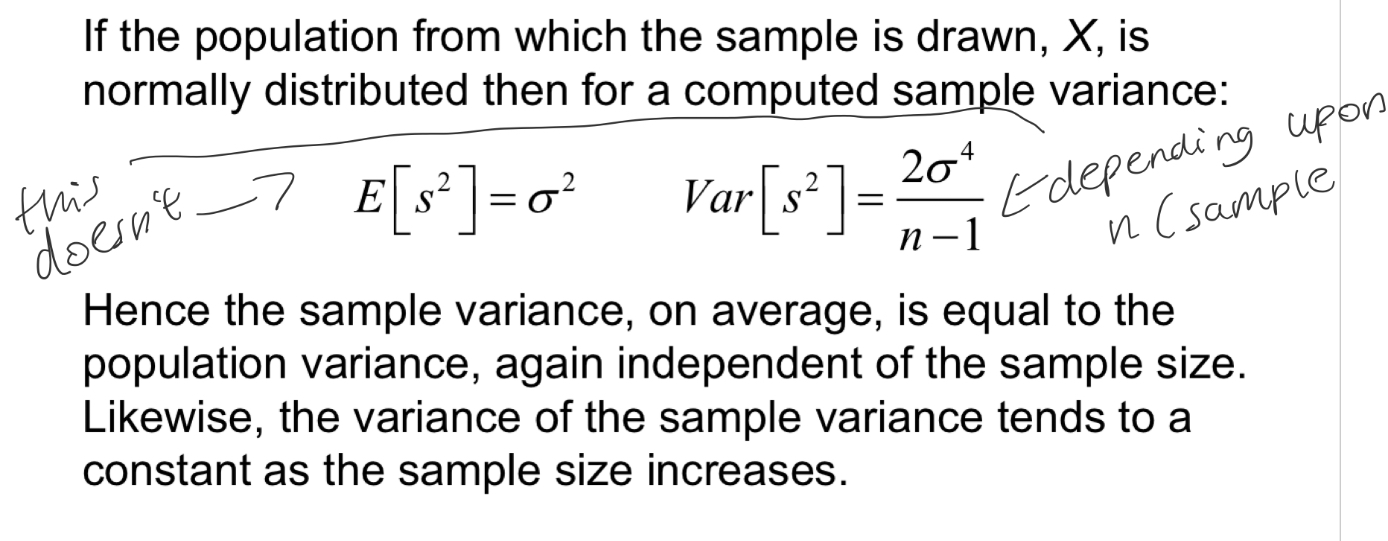
What is the standard error for a sample variance?
What is a sample that is described as IID?
How can we denote this?
Independently and Identically distributed:
Independence = occurrence of one observation doesn’t affect Pr of another occurring
Identical distribution = each observation has the same Pr distribution as the others
Denoted as: Xi ~ iddN (μ, σ2)
(given each observation in a sample is a random variable)
What is the Central Limit Theorem (CLT)?
Theorem that states that:
the sample mean of a sample of n observations
(BOTH DISCRETE AND CONTINUOUS),
drawn from a population
with any P distribution
> WILL BE APPROXIMATELY NORMALLY DISTRIBUTED IF N IS LARGE (n > 25)
POINT ESTIMATION AND CONFIDENCE INTERVALS
POINT ESTIMATION AND CONFIDENCE INTERVALS
What is a confidence interval?
Provides a range of values within which if we repeatedly sampled we could say, with a degree of confidence, that the true population mean would be between those points
So instead of saying a sample mean (e.g. 10) would be the best approximation of an unknown population mean, we would say with a certain degree of confidence, that an interval (e.g. between 8 and 12) holds our true population mean
Allows for variability in the estimate (around sample mean estimate)
ESIMATING MEAN
In simple, what does a confidence interval tell you, e.g. if the confidence interval was 95%?
If many repeat samples are drawn, 95% of those samples will contain the true population mean
NOT, if in any 1 sample, you’ve got a 95% certainty that the pop mean will be between those boundaries - its either in or not in region
How do we get there
don’t need to remember just good to remind you
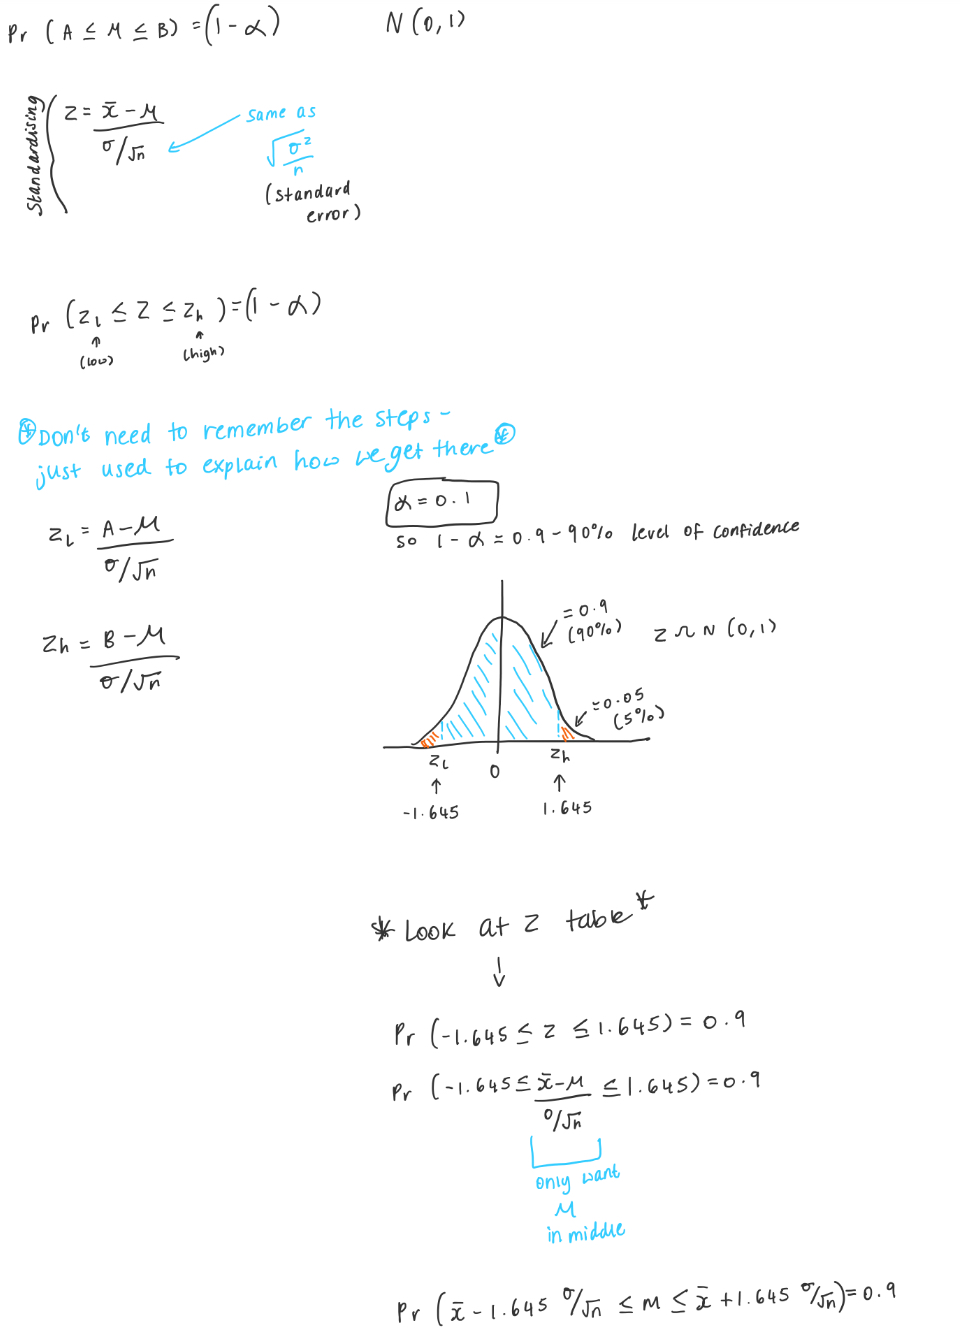
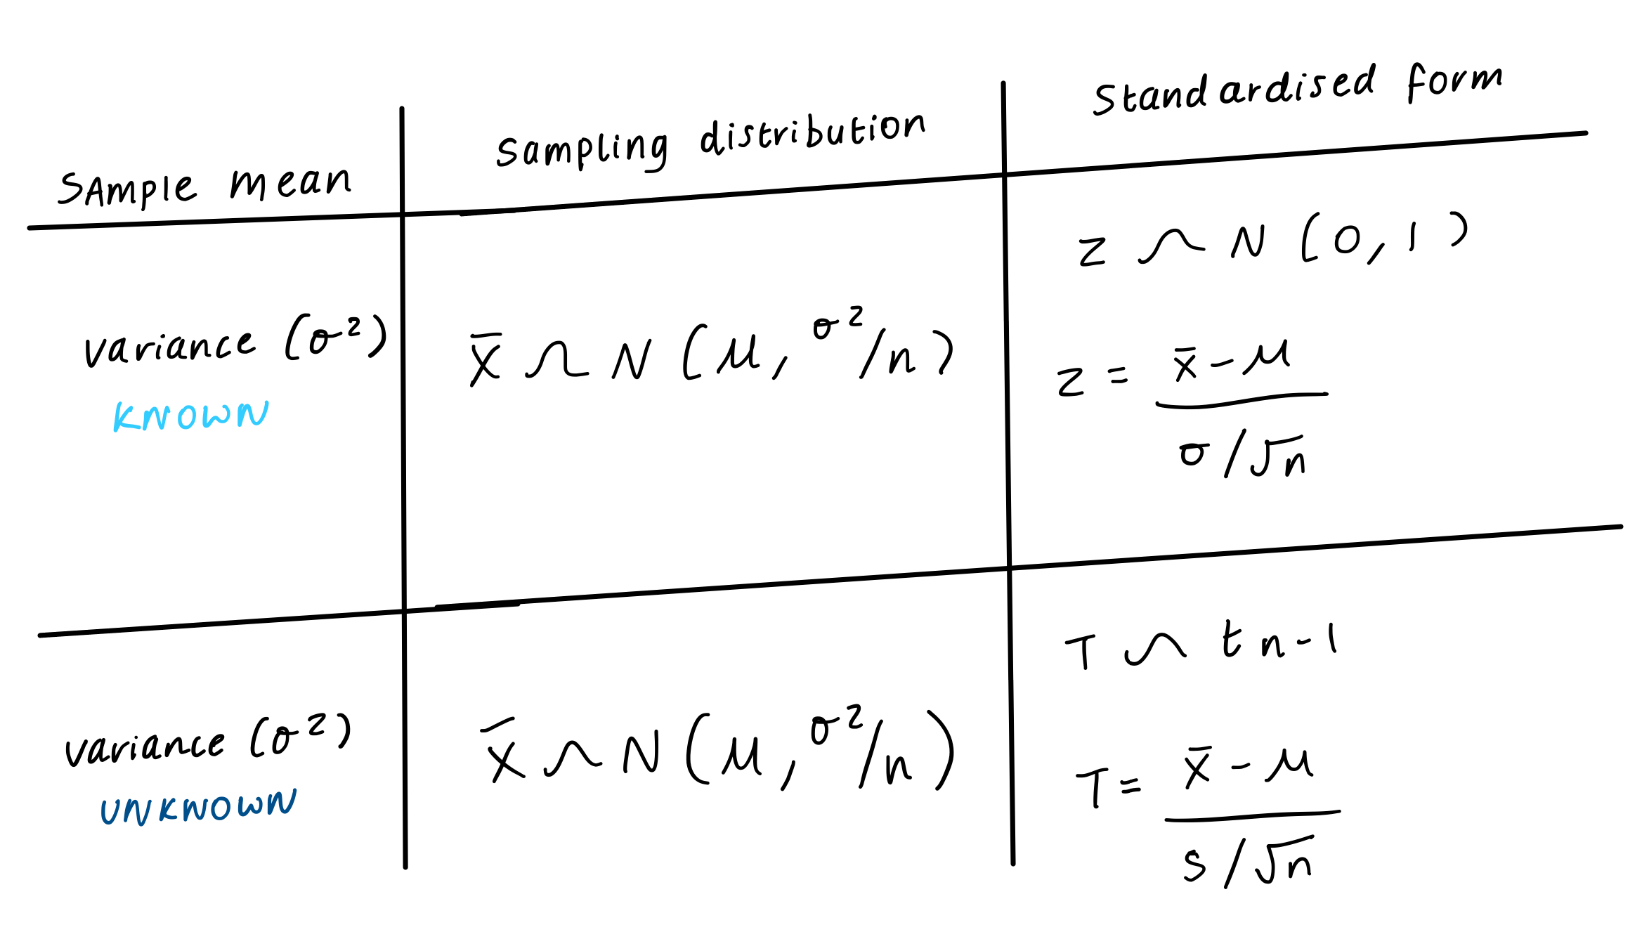
What are the 2 types of distribution that can be used for confidence intervals and how do we know when to use them?
Standard normal (cumulative) distribution (Z table):
Left tail probabilities
When sample is bigger than 25 (large sample) or if told normally distributed
t distribution (t table):
Right tail probabilities
When sample smaller than 25 and population variance/SD isn’t known so have to use SAMPLE variance/SD
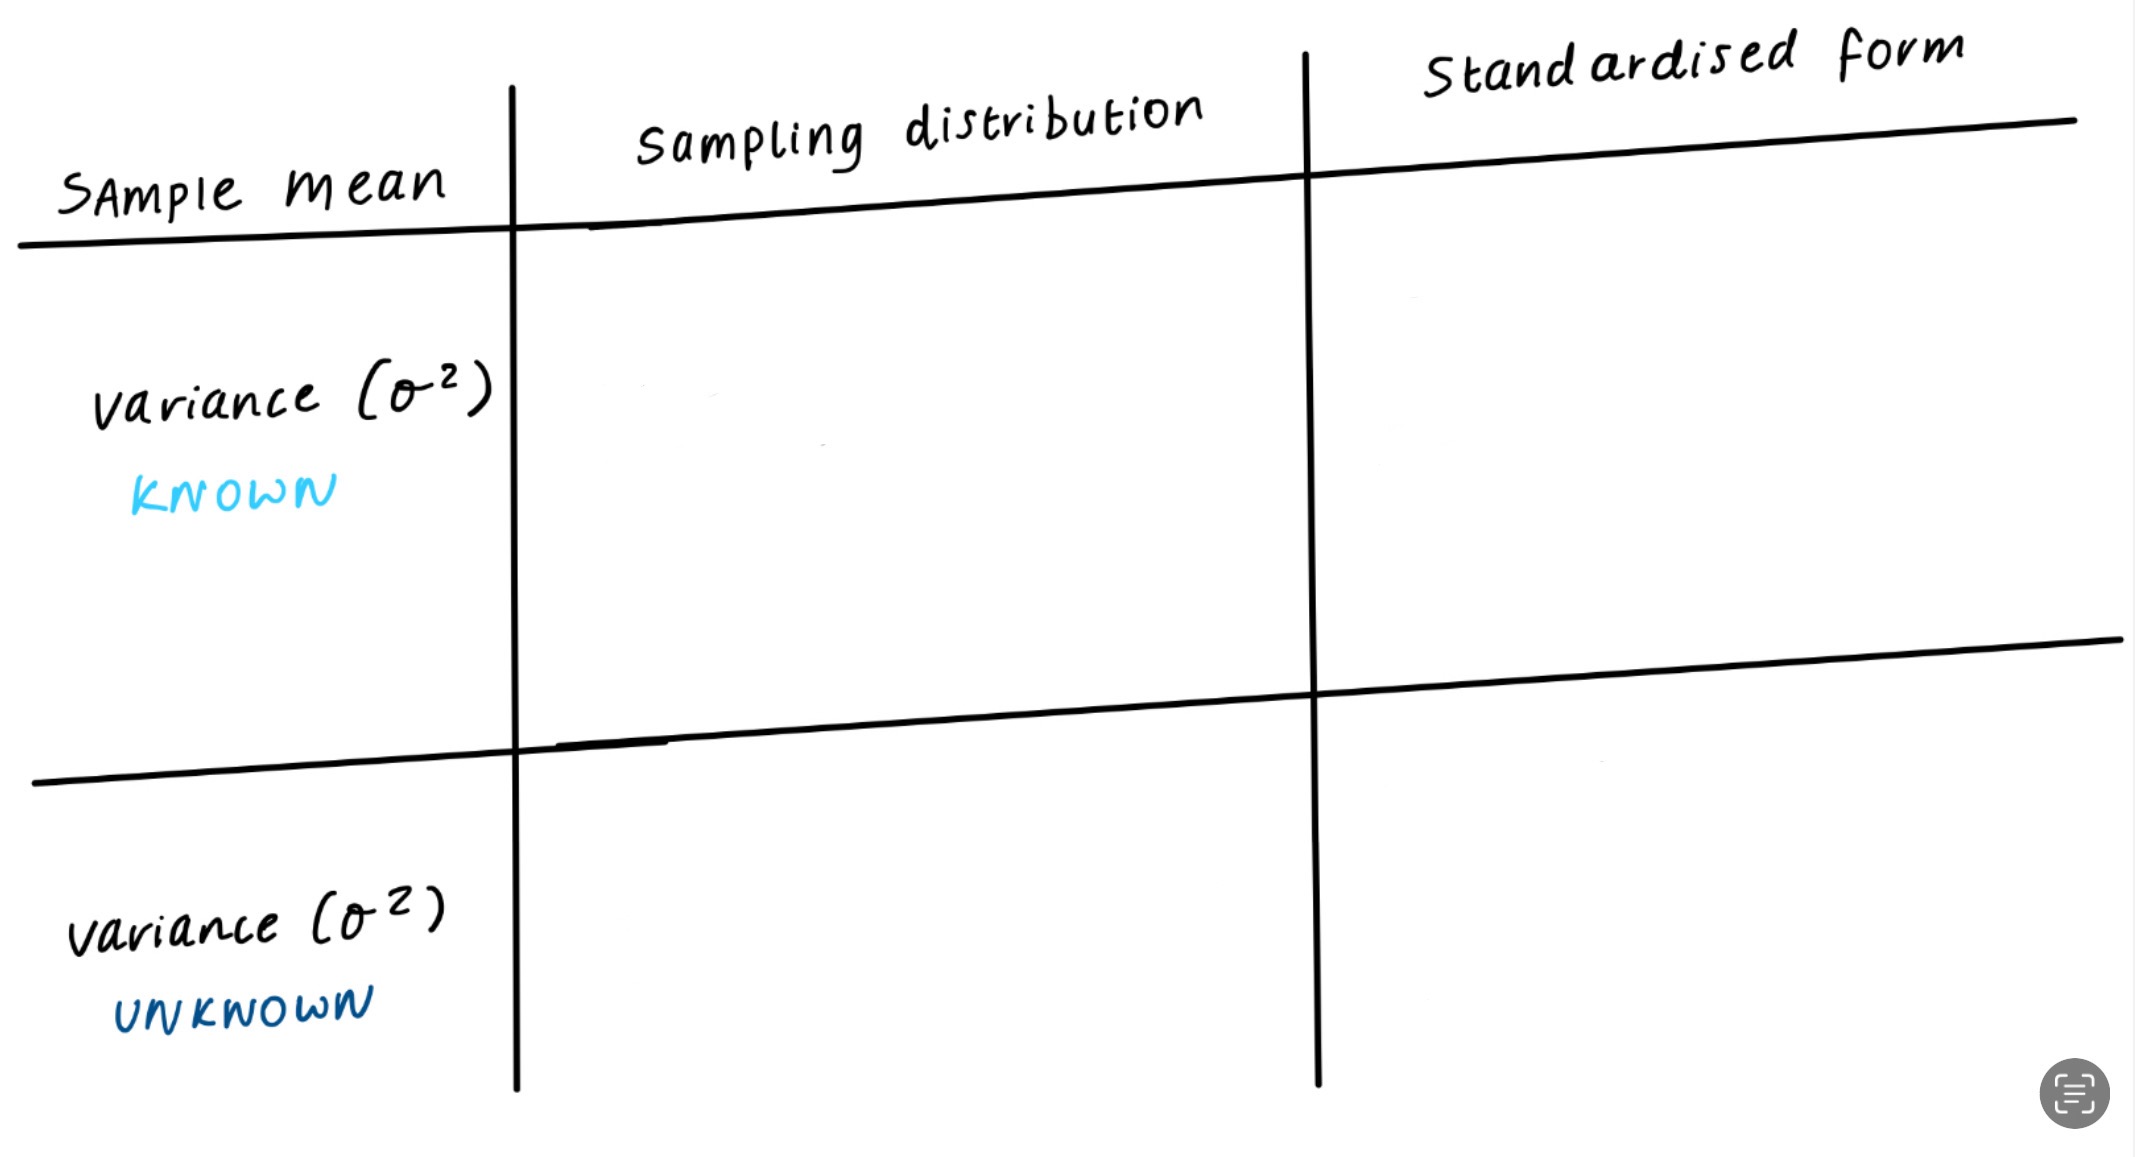
Sample mean is normally distributed, but:
> when applying to a test statistic, could be
standard normal
t distribution with n - 1
depending on whether the variance is known or unknown
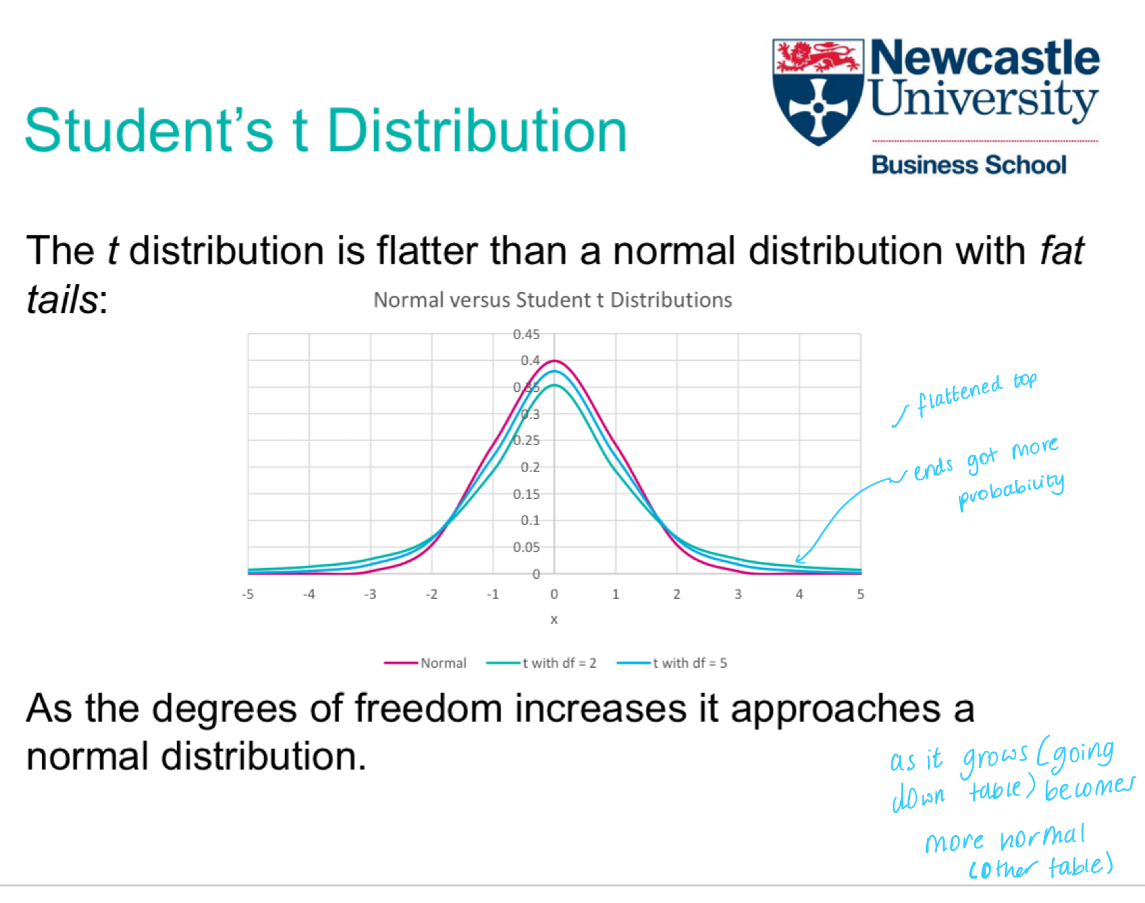
What is the difference in a graph for a t distribution and normal distribution?
T is flatter and fatter tails
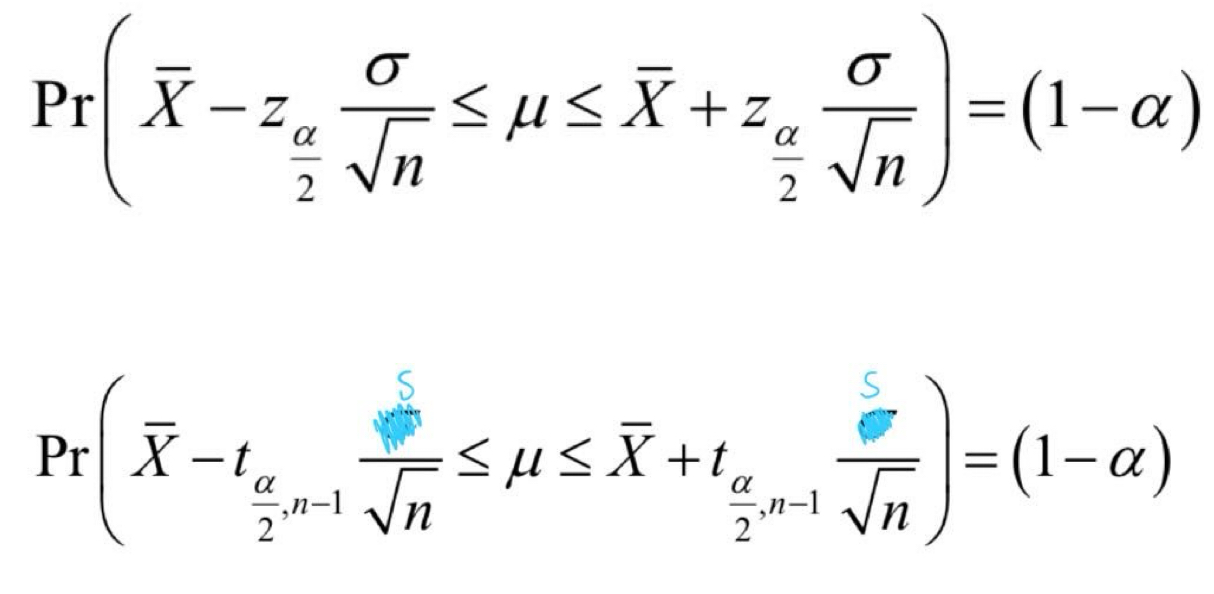
Write the confidence interval formula for:
normal distribution
t distribution
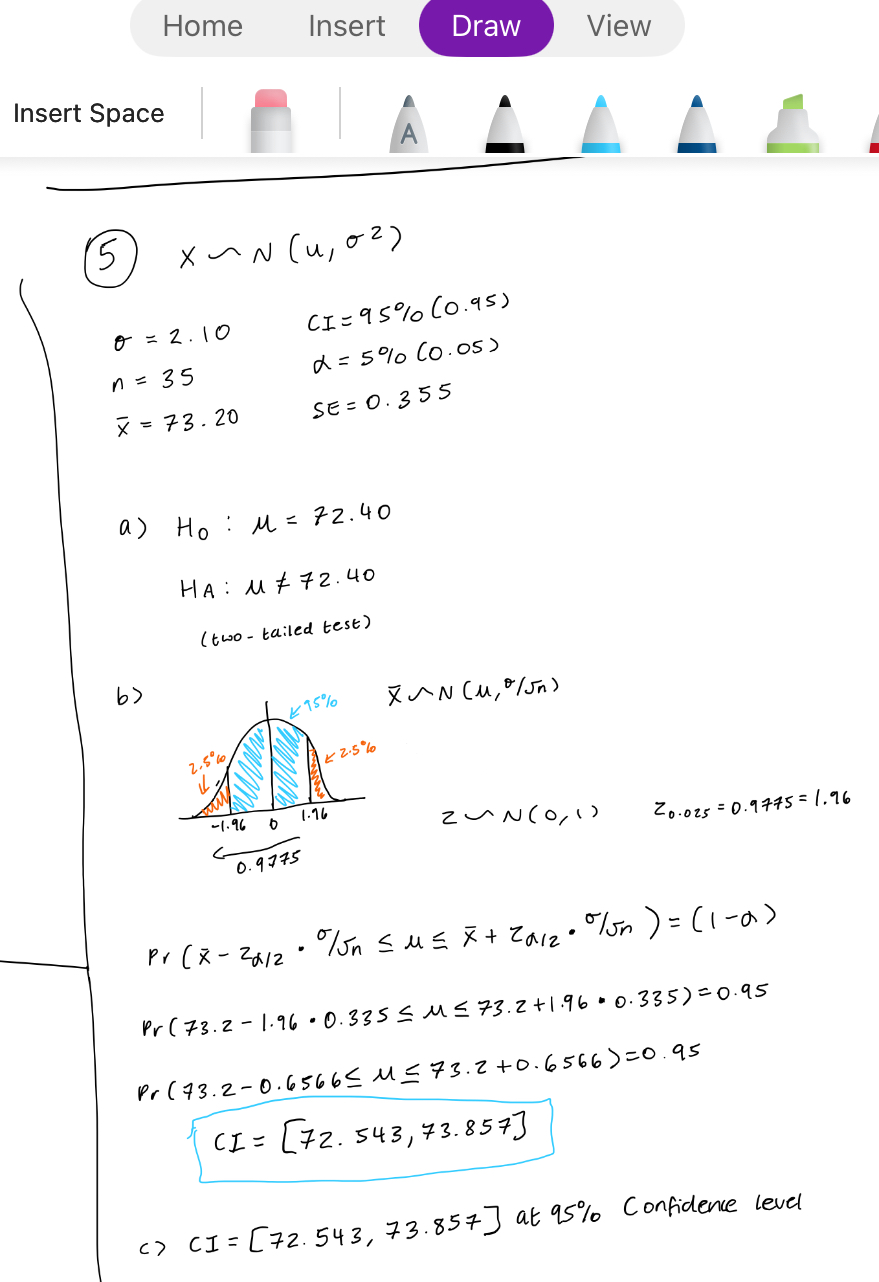
What are the steps to finding a confidence interval?
Write out all the info (CI, LOS, X bar, n, sigma, SE = sigma/square root of n)
Work out if its normal or t distribution
Draw graph/tails
Write out standardised formula for normal or t distribution
IF NORMAL - Work out zsigma/2 (which is the left tail, e.g. if CI is 95%, it would be 0.975)
IF T - work out tsigma/2 and df (n-1) and look on table
Input value into each formula, and end up with CI = [ lower value, upper value ]
![<ol><li><p>Write out all the info (CI, LOS, X bar, n, sigma, SE = sigma/square root of n)</p></li><li><p>Work out if its normal or t distribution</p></li><li><p>Draw graph/tails</p></li><li><p>Write out standardised formula for normal or t distribution</p></li><li><p><span style="color: rgb(22, 153, 3);"><strong><span>IF NORMAL</span></strong></span> - Work out z<sub>sigma/2 </sub>(which is the left tail, e.g. if CI is 95%, it would be 0.975)</p></li><li><p><span style="color: rgb(193, 118, 0);"><strong><span>IF T</span></strong></span> - work out t<sub>sigma/2</sub> and df (n-1) and look on table</p></li><li><p>Input value into each formula, and end up with CI = [ lower value, upper value ]</p></li></ol><p></p>](https://knowt-user-attachments.s3.amazonaws.com/2b95bce8-6788-4bcf-a587-5ca051520c28.jpg)
How will the confidence interval change depending on an increase in:
↑ LOS (alpha)
↑ sample size (n)
↑ population variance (sigma)
LOS ↑ = CI width ↓
n ↑ = CI width ↓
sigma ↑ = CI width ↑
HYPOTHESIS TESTING
HYPOTHESIS TESTING
What is a hypothesis test?
Define what the 2 hypothesises we have are.
Test that allows us to evaluate claims made about the population & whether our samples provides enough evidence to to support rejecting the null in favour of the alternative (or vice versa)
Null hypothesis is what we are testing against (no effect)
Alternative hypothesis states your prediction (has effect)
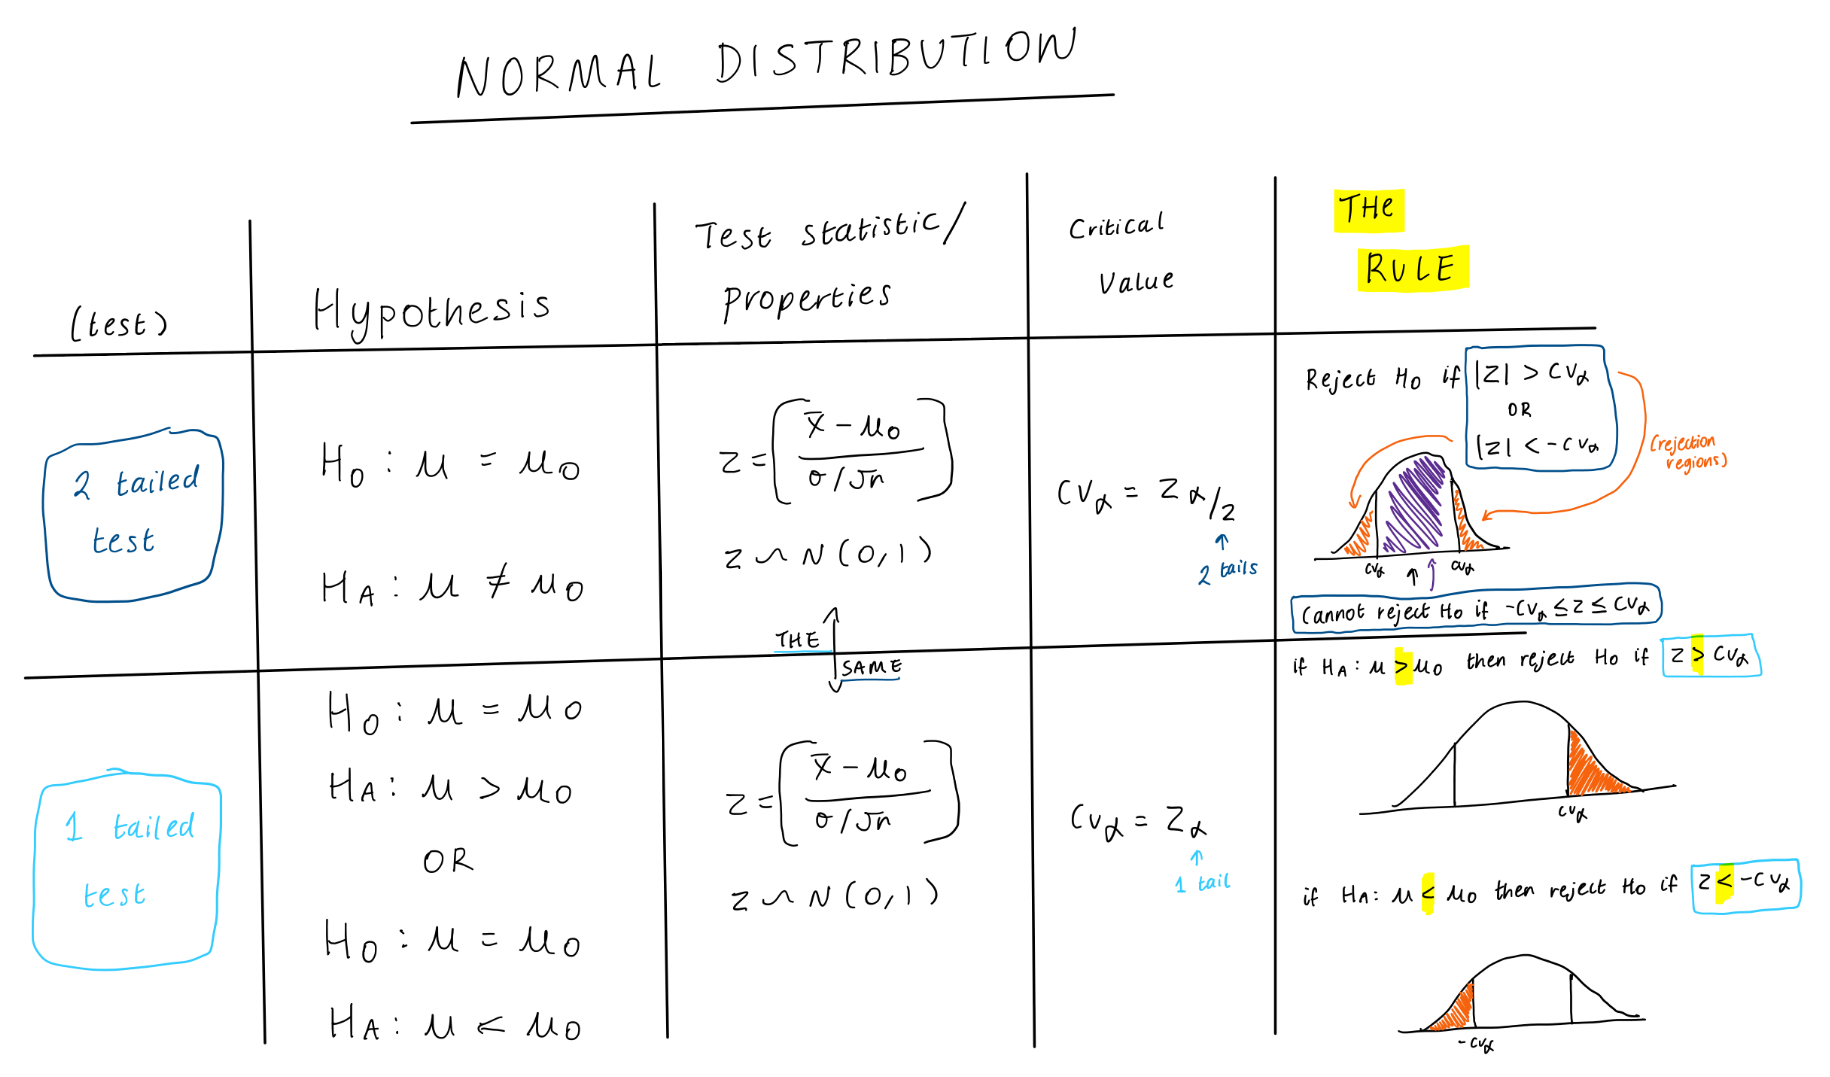
Under a normal distribution/z statistics (population variance known) for both a 2 and 1 tailed test, what is:
The hypothesis
The test statistic & its properties
The critical value
The rule
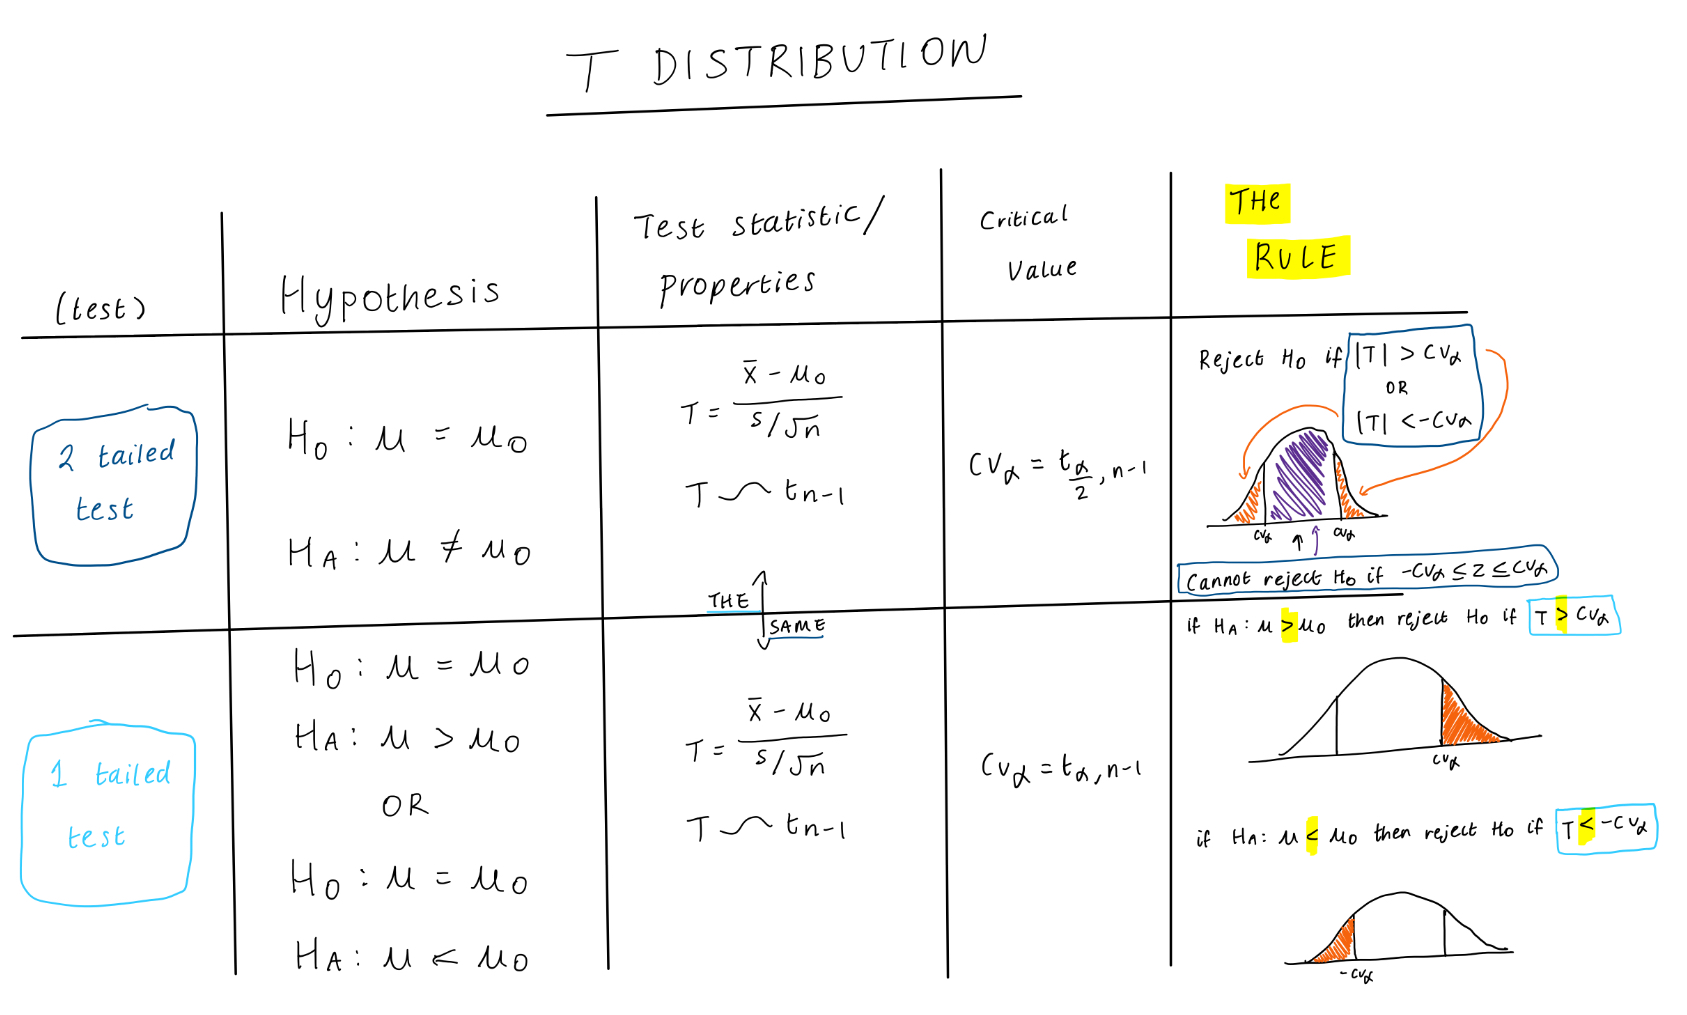
Under a t distribution/t statistics (population variance unknown) for both a 2 and 1 tailed test, what is:
The hypothesis
The test statistic & its properties
The critical value
The rule
What does the null hypothesis always have to contain?
REMEMBER: *everything always in terms of the null*
ALWAYS CONTAINS AN EQUALS (=)
H0 : μ = μ0
H0 : μ < μ0
H0 : μ > μ0
What are the 2 types of errors that can be made (in terms of the null hypothesis)
*Hint - 2 blind 2 see*
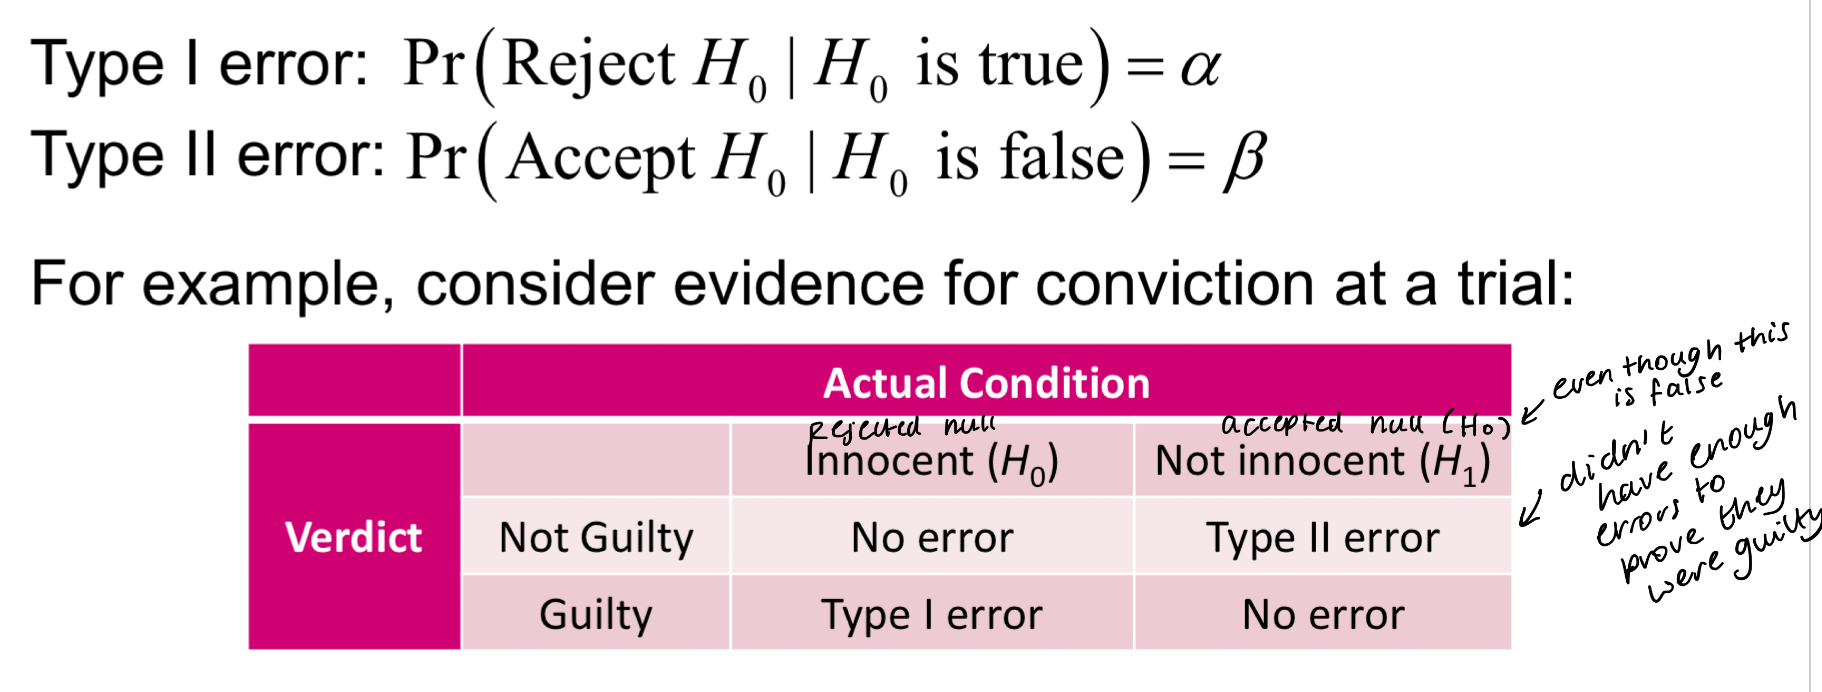
What does a level of significance represent (α) in terms of hypothesis testing?
Calculated risk of committing a type 1 error
Usually e.g. 5%, 1% or 0.1% (CI = 95%, 99% OR 99.9%)
e.g. if α = 5%:
The pr of making a T1 error = 5% (0.05)
(there is a 5% chance of rejecting the null hypothesis when the null hypothesis is actually true - so you accept the 5% risk of making a false positive error)
What are the 3 ways you can do hypothesis testing?
Using z statistics (standard normal distribution)
Using confidence interval
Using t statistics (students t distribution)
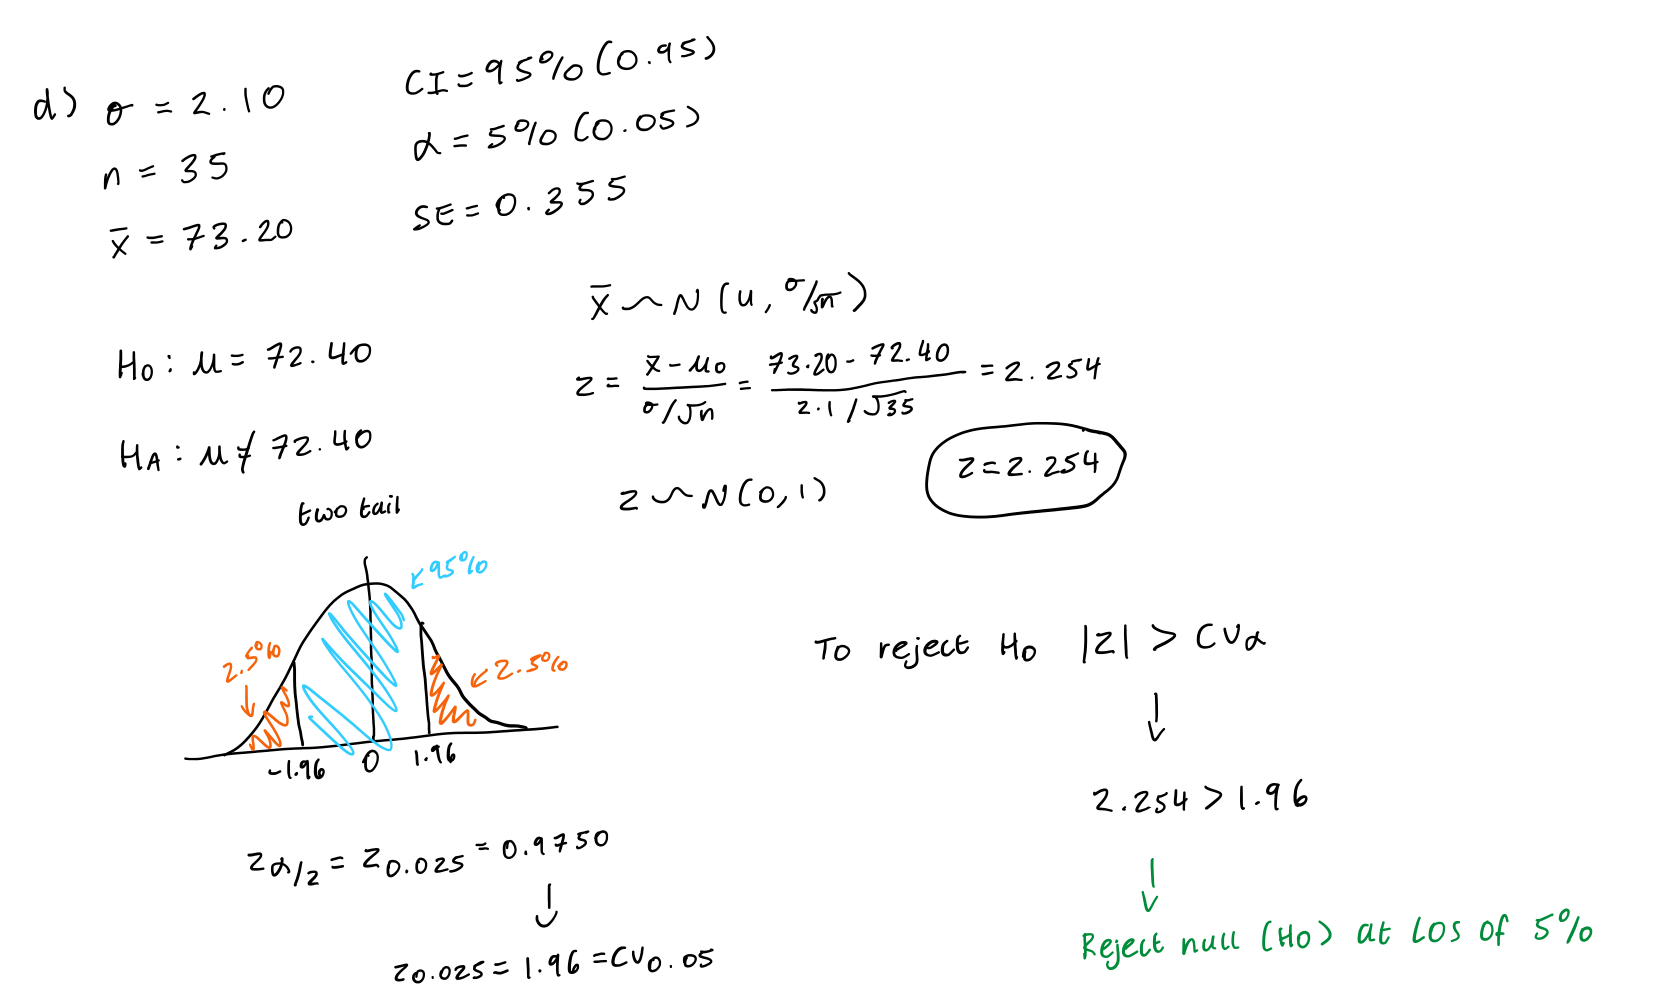
What are the steps to testing a hypothesis when using z statistics?
Get all info (n, σ, x̄, α, CI, SE.)
Write your hypothesis (two tailed or one tailed)
Draw your graph (shaded areas inside is the confidence level/LOS) and work out zsigma/2 = cvsigma (use z table!!)
Work out your z value using the standardised formula (+ make sure to write out the properties)
Conclude - do you reject null or can you not reject the null and why + AT WHAT LOS
What are the steps to testing a hypothesis when using a confidence interval?
Get all info (n, σ/s, x̄, α, CI, SE.)
Draw your graph and work out confidence interval
Conclude - do you reject null or can you not reject the null and why + AT WHAT LOS - e.g. if in CI then cannot reject, but if not within CI then have to reject
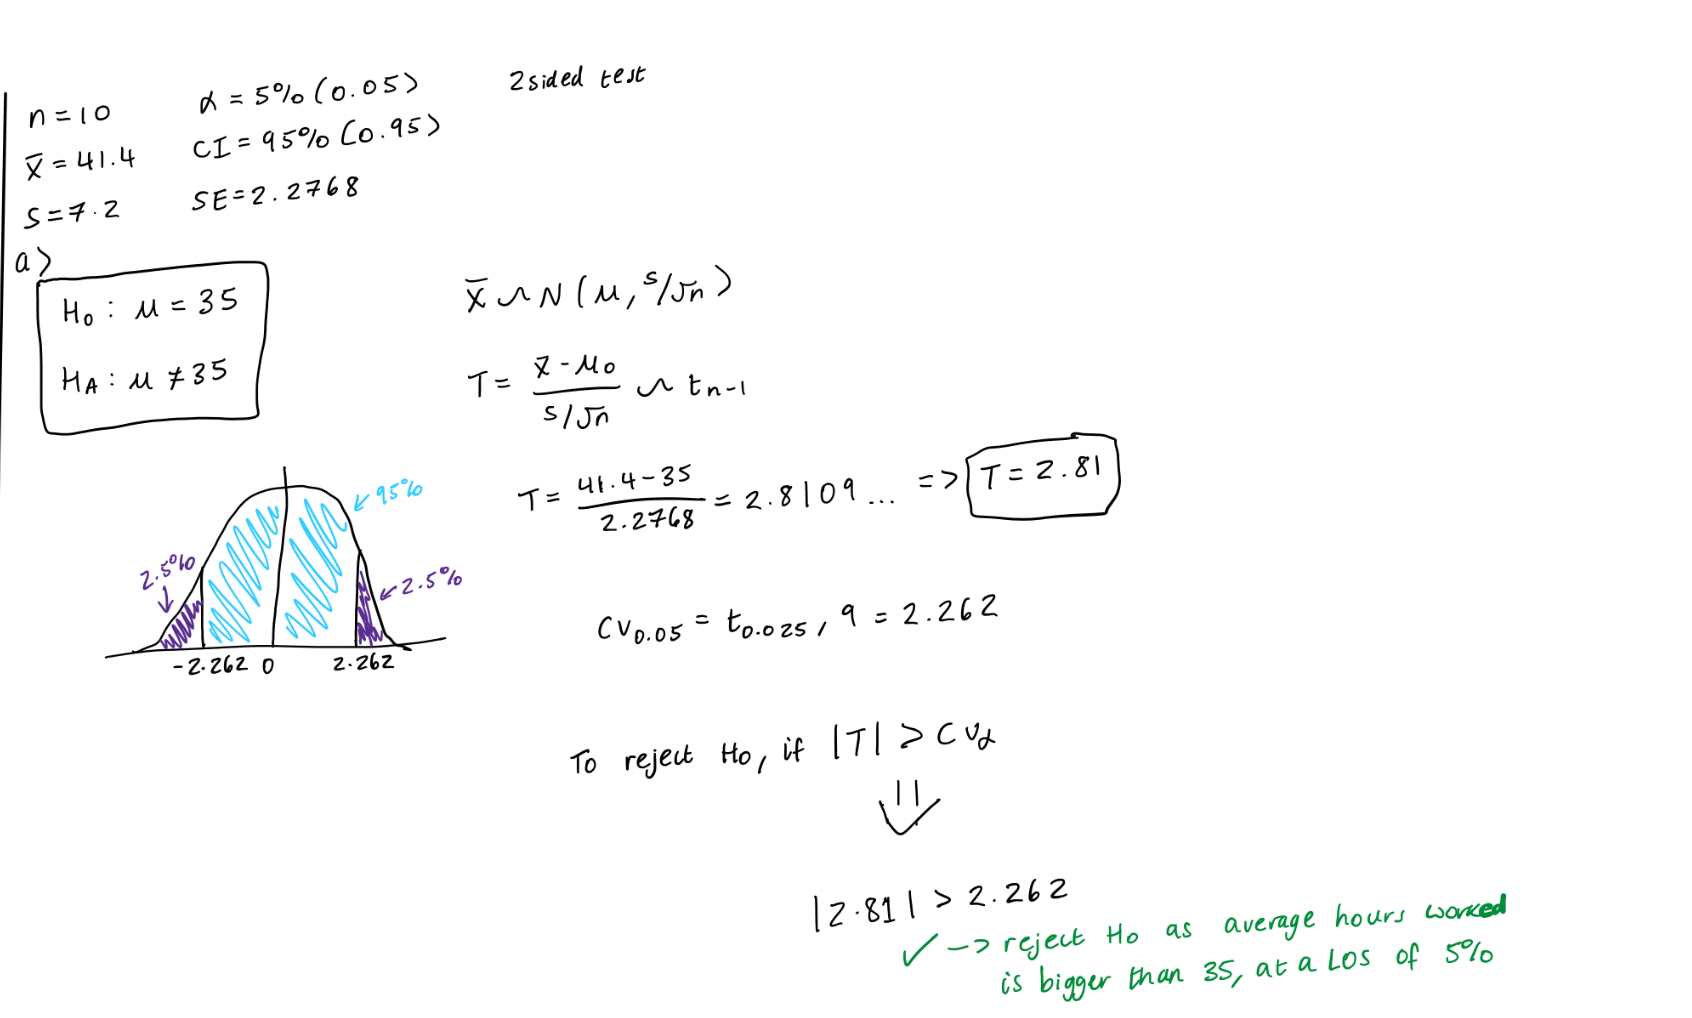
What are the steps to testing a hypothesis when using t statistics?
Get all info (n, s, x̄, α, CI, SE.)
Write your hypothesis (two tailed or one tailed)
Draw your graph (shaded areas inside is the confidence level/LOS) and work out tsigma/2, n-1 = cvsigma (use t table!!)
Work out your t value using the standardised formula (+ make sure to write out the properties)
Conclude - do you reject null or can you not reject the null and why + AT WHAT LOS
What do you write for the conclusion (in terms of the null)
Reject null - have enough evidence to reject
Cannot reject null - don’t have enough evidence to reject (trying to test alternative but null right)