Economics Unit 8-10 Test By Maya Muhtaseb
1/75
Earn XP
Description and Tags
• Multiple Choice (10) • Short answer: o /10 Thinking o /12 Application o /9 Communication
Name | Mastery | Learn | Test | Matching | Spaced | Call with Kai |
|---|
No analytics yet
Send a link to your students to track their progress
76 Terms
GDP (growth domestic product)
The most commonly used measure of a country’s output
Total dollar value at current prices of all final goods and services produced in Canada over a given period
The level of GDP reveals information about the size of an economy while the change in GDP from one period to another period indicates whether the economy is expanding or contracting
GDP refers to the total value of final (as opposed to interim, or work-in-progress) goods and services produced within a country’s borders during a specific calendar period such as quarterly or annually.
Expenditure approach
A method of calculating GDP by measuring total spending on the nation's final goods and services.
It considers spending by households, businesses, governments, and net exports (exports minus imports).

C (Consumption)
What households spend on all goods and services that they consume i.e. food, clothing, gas, car, appliances, haircuts, etc.
G (Government)
The value of expenditures on goods and services by all levels of government i.e. wages to employees, office supplies, schools, highways, hospitals, etc.
I (Investment)
Purchases of assets that are intended to produce revenue;
E.g. Purchases by businesses of new capital goods used in the production process, construction of new buildings and inventory
X - M (Net Exports)
X = exports; M = imports
Imports must be subtracted because they do not represent Canadian production
Exports must be added because these items were produced in Canada and sold to other countries
The income approach
Using the income approach, GDP is the sum of three main income items:
wages and salaries
corporate income (profits)
proprietor’s incomes (including rent)
Plus:
• indirect taxes (taxes minus any subsidies businesses receive)
• depreciation (gross investment – net investment)
The income approach formula
Formula: GDP = W + C + P + IT + D
GDP = Wages and salaries + Corporate income + Proprietors' incomes and rents + Indirect taxes + Depreciation
Depreciation = Gross investment - Net investment
GNI Gross National Income
The total income acquired by Canadians both within Canada and elsewhere
Disposable Income
Household income, after payment of income taxes, which can be either consumed or saved
GDP per capita
it’s a better indicator of the change or trend in a nation’s living standards over time, since it adjusts for population differences between countries.
Per capita GDP serves as an informal measure of a nation’s prosperity
Per capita GDP calculation
Per Capita GDP = GDP ÷ Population
Note: GDP may be misleading in terms of the population of a country; using GDP per capita resolves this issue
Real GDP
GDP expressed in constant dollars from a given year (inflation adjustment);
Per capita real GDP:
GDP per person, expressed in constant dollars from a given year
Per Capita real GDP = Real GDP ÷ population
GDP GROWTH
If GDP goes up, it can be the result of 1 of 3 scenarios:
Prices have increased
Output has increased
A combo of the price increase and output increase
Limitations of GDP
• Excluded Activities
• Product Quality
• Composition of Output
• Income Distribution
• Leisure
• The Environment
Because GDP represents the market value of goods and services produced in an economy, it does not include some types of productive activities. Excluding these activities means that GDP can understate economic activity and living standards.
EXCLUDED ACTIVITIES FROM GDP
Non-market activites
GDP does not count output that does not have a dollar value attached to it
This omission weakens GDP as an accurate measure of a country’s output
EXCLUDED ACTIVITIES FROM GDP
The underground economy
The underground economy includes all the market transactions that are unreported and, therefore, also left out of GDP.
In contrast, other “under-the-table” transactions may be for legitimate purchases
for example. These gardening services are paid for in cash or through barter, allowing taxes on these transactions to be avoided.
Product quality
Today's GDP includes purchases of products not available a few decades ago, that have increased substantially in quality with little or no rise in price. GDP, which can only add up selling prices, cannot fully capture these quality improvements.
Ex. flat screen televisions, smartphones, and digital music players, to name only a few.
COMPOSITION OF OUTPUT
Another limitation related to the money-value basis of GDP is that it tells us nothing about what is produced and purchased.
INCOME DISTRIBUTION
Incomes may be distributed in a range of ways can have profound effects on the living standards of individuals. But GDP does not reflect how output is distributed among a country's citizens.
LEISURE
Although we might be able to work every waking hour, most of us consider leisure as a requirement for a satisfactory standard of living.
However, leisure is not bought and sold in the market, so it cannot be accounted for by GDP.
THE ENVIRONMENT
GDP does not differentiate between economic activities that are harmful to the environment and those that are not, and it may not effectively represent spillover costs and benefits.
How can 2 countries that have the same GDP, differ in their standard of living? Explain.
Two countries with the same GDP can differ in standard of living due to population size, income distribution, and cost of living. GDP per person (GDP per capita) gives a better measure of living standards.
INFLATION
General increase in the prices of goods and services in an entire economy over time.
Inflation does not mean that all prices are rising. Some prices are rising, others are remaining constant, while still others may be falling
Every year prices tend to increase a little because of increased consumer demand and spending (known as demand-pull inflation) or an increase in resource prices (known as cost-push inflation)
Countries want to ensure that prices and wages are both rising;
Hopefully wages are increasing more than prices as this would ensure that our purchasing power remains at least the same
DEFLATION
A general decrease in the level of prices is called deflation.
Hyperinflation
A situation in which inflation is out of control and prices increase rapidly, at double digits or even triple digits per month
price stability (inflation)
One of the main economic goals of most modern mixed economies is price stability. Price stability means avoiding prolonged periods of excessively high inflation or deflation
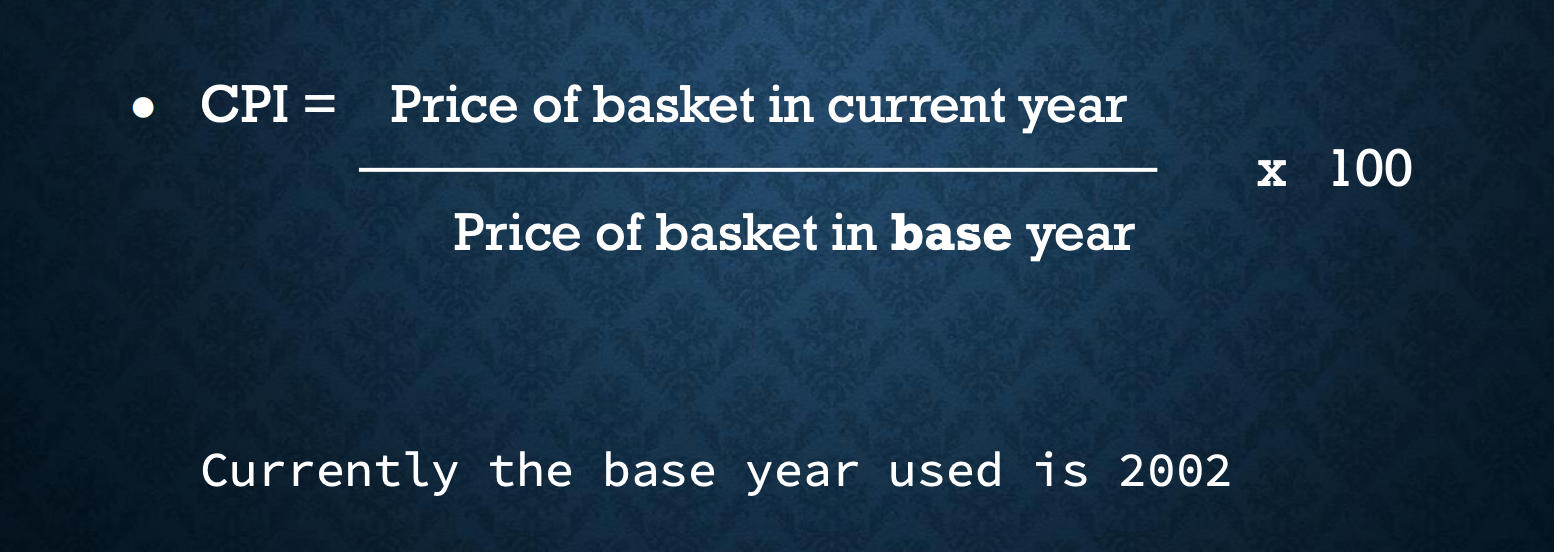
CPI (CONSUMER PRICE INDEX)
Statistics/Stats Canada uses a device called the CPI to measure and track inflation
CPI is the most commonly used tool to measure overall changes in prices in an economy/country over time
It’s a measure that tracks the changes in the prices of a basket of goods and services commonly purchased by consumers
Households are defined as urban, with a size of 4 members
CALCULATING CPI

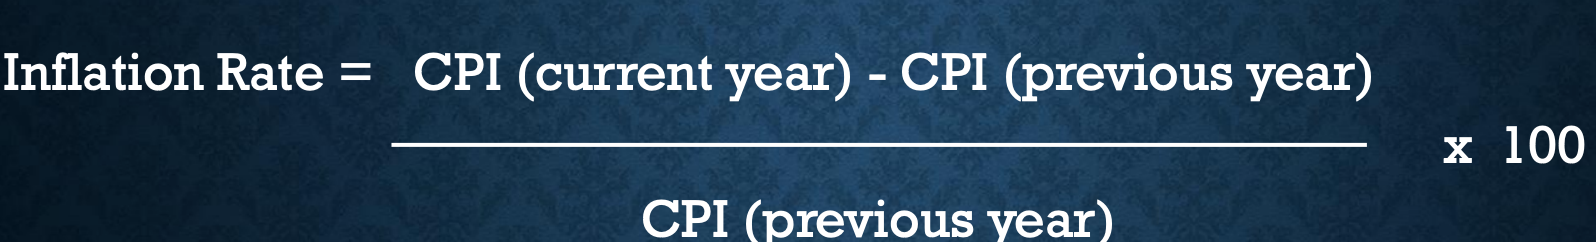
CALCULATING THE INFLATION RATE
Comparing the rate of inflation from one year over the next
You do not need to use the base year CPI

Nominal Income
income expressed in current dollars
Real income
Income expressed in constant base-year dollars
consumer price index
The consumer price index is useful in helping consumers determine the cost of living (the amount consumers must spend on the entire range of goods and services they buy)
Real income formula

LIMITATIONS OF CPI
Consumer Differences
Changes in Spending Patterns
Size of the household definition (4 people)
Product Quality and New Products
Consumer Differences
individual consumption patterns/spending do not always match those of the “typical” urban household as represented in CPI
Changes in Spending Patterns
Statistics Canada periodically surveys households to update both the contents and the item weights of the “shopping basket.”
Size of the household definition (4 people)
not representative of all households
Product Quality and New Products
The index cannot reflect changes in quality, or the introduction of new products, that are unmatched by changes in price.
THE GDP DEFLATOR
It’s an indicator of price changes for all goods and services produced in the economy
GDP Deflator Forumla


Nominal GDP formula
GDP expressed in Current Dollars
THE LABOUR FORCE SURVEY
The labour force survey tracks a randomly selected sample of Canadian households.
the labour force population, which includes Canadians 15 years of age or over, with specific exclusions
the labour force, which includes all those who either have a job or are actively seeking employment
participation rate
the participation rate, which is the percentage of the labour force population that makes up the labour force
official unemployment rate
the official unemployment rate, which is the number of unemployed people in the labour force as a percentage of the entire labour force
# of people unemployed = people who are unemployed bur are looking for work (in the past 4 weeks)
# of people in the labour force = eligible people who are employed and people looking for work
participation rate formula

unemployment rate formula

DRAWBACKS OF THE OFFICIAL RATE
It does not include underemployed workers who are under-utilized either as part-time workers or by working at jobs not appropriate to their skills or education.
It excludes discouraged workers who are unemployed and have given up looking for work.
It is based partly on dishonest responses.
TYPES OF UNEMPLOYMENT
There are four types of unemployment:
Frictional unemployment is due to being temporarily between jobs or looking for a first job.
Structural unemployment is due to a mismatch between people and jobs.
Cyclical unemployment is due to fluctuations in output and spending (recessions, expansions)
Seasonal unemployment is due to the seasonal nature of some occupations and industries.
FULL EMPLOYMENT
It’s the highest reasonable expectation of employment for the economy as a whole
It’s defined in terms of the natural unemployment rate, which includes frictional and at least some structural unemployment
THE COSTS OF UNEMPLOYMENT
High unemployment hurts individuals and the Canadian economy as a whole.
The cost of unemployment for the entire economy can be measured by the difference between actual real output and potential output, which is the real output associated with full employment.
Natural rate
The natural rate of unemployment is the unemployment rate that would exist in a growing and healthy economy.
Natural rate of unemployment = full employment = frictional + structural unemployment
Aggregate Demand (AD)
It’s the total demand for all goods and services in an economy.
In constructing the AD schedule, instead of examining individual prices (as in the microeconomic concept of demand) we will use the GDP deflator.
Total spending on an economy’s goods and services is the sum of the following
GDP = AD = Consumption + Investment + Government Purchases + Net Exports
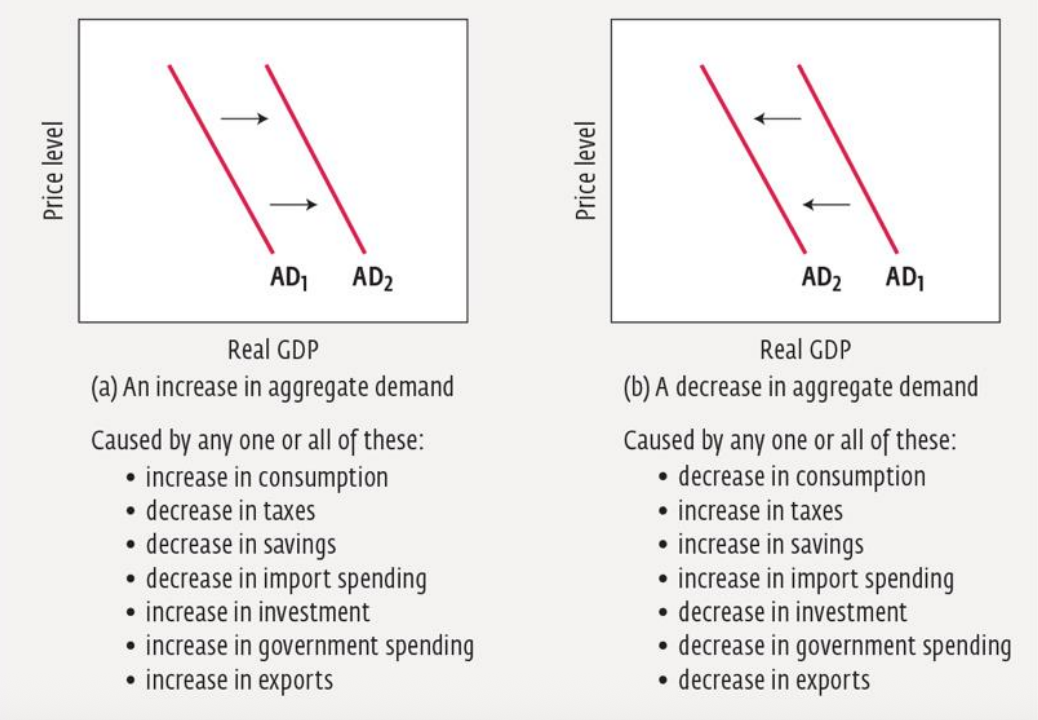
CHANGES IN AGGREGATE DEMAND
CHANGES IN AGGREGATE DEMAND
1. CONSUMPTION (C)
Changes in disposable income, wealth, consumer expectations and interest rates can all affect consumer spending • As consumer spending changes, so does total spending thereby shifting the AD curve
Disposable Income
The most significant determinant of consumer spending is disposable income (DI)
When DI rises, there is a rise in consumer spending thereby adding to total expenditures and shifting AD curve to the right
Wealth
Wealth and income are different
Wealth is made up of real assets (i.e. houses and furniture) and financial assets (stocks and bonds)
If a stock price goes up, households who own that stock will spend more money and the AD curve will shift to the right
An increase in consumer debt means that households will lose wealth and reduce their spending shifting the AD curve to the left.
Consumer Expectations
If consumers expect prices to rise or their incomes to rise, they will spend more now and save less, shifting the AD curve to the right
Interest Rates
If the real interest rate falls, consumers are more likely to borrow money in order to buy big ticket items causing a shift of the AD curve to the right
If real interest rates rise, consumer spending falls causing a shift in the AD curve to the left
CHANGES IN AGGREGATE DEMAND
2. INVESTMENT (I)
Overall level of investment related to expectation of future profits
If business profits are expected to increase, investment will increase, AD curve shifts to the right
If business profits are expected to decrease, investment will decrease, AD curve shifts to the left
CHANGES IN AGGREGATE DEMAND
3. GOVERNMENT PURCHASES (G)
A rise in government purchase (i.e. highway construction) causes an increase in AD and a shift of the AD curve to the right
A fall in government purchases causes a shift of the AD curve to the left
This component DOES NOT include government transfer payments
For example, The Canada Social Transfer: Canadian government’s transfer payment in support of post-secondary education, social assistance and social services.
CHANGES IN AGGREGATE DEMAND
4. Net Exports
Foreign Incomes
If incomes in other countries rise, they will purchase more domestic AND more imported goods (i.e. Canadian goods)
As a result, Canadian net exports will likely rise, thereby increasing AD and shifting the AD curve to the right.
Value of the Canadian Dollar
An increase in value of our dollar makes Canadian goods more expensive to foreigners, which reduces demand and shifts the AD curve to the left
A decrease in the value of our dollar makes Canadian goods cheaper to foreigners, which increases demand and shifts the AD curve to the right
Because of the impact of exchange rates on prices, when the Canadian dollar falls, net exports increase (more exports than imports). When the Canadian dollar goes up, net exports decrease (more imports than exports).
Aggregate Supply
Aggregate supply (AS) is the total supply of all goods and services produced in an economy.
The AS curve displays the total amount of goods and services that would be supplied at each price level, as measured by the GDP deflator, in an economy.
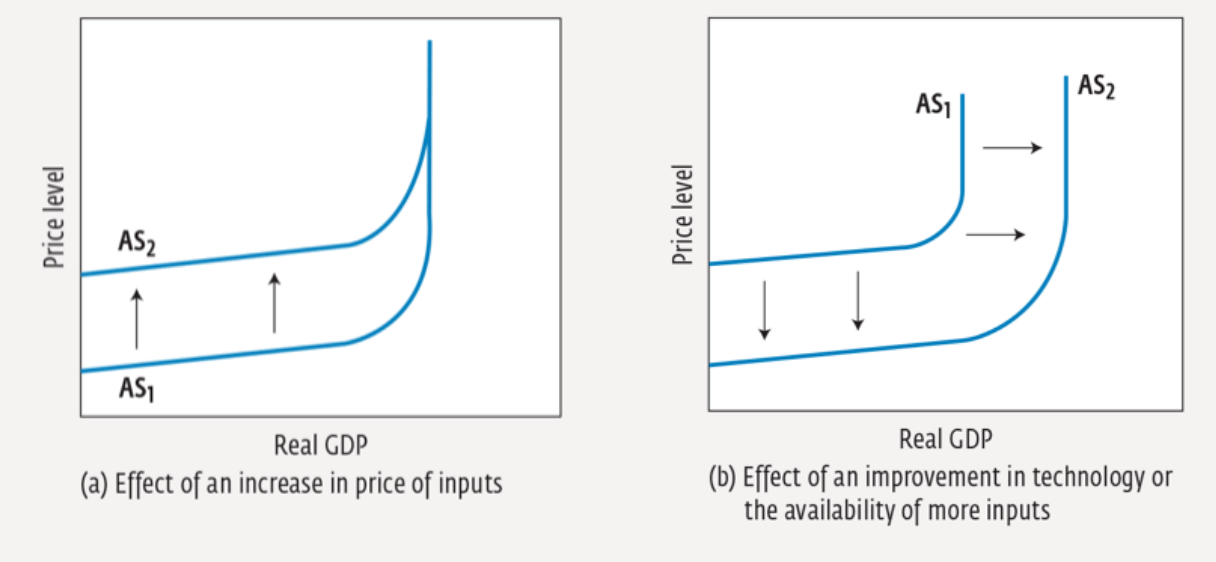
Changes in Aggregate Supply (four factors)
1. INPUT PRICES
When a decrease in the price of an input cost (i.e. wages) pushes down production costs, businesses increase their real output
AS curve shifts to the right
2. RESOURCE SUPPLIES
Supplies of resources in an economy, especially human and capital resources tend to grow.
With such increases, businesses produce more real output at every price level which results in a shift of the AS curve to the right.
3. PRODUCTIVITY
Increases in productivity are largely due to technology
A technological innovation raises productivity, when the same amount of economic resources can produce more real output at every price level, causing a long run increase in AS. Shift of the AS curve to the right

4. GOVERNMENT POLICIES
Higher taxes encourage businesses and households to reduce their supply of economic resources i.e. labour because after-tax income is lower, leading to a fall in real output and a long-run decrease in AS (shift of the curve to the left)
Government regulations, such as environmental and safety standards, typically raise per unit costs for business which causes businesses to produce less causing a long-run decrease in AS (shift of the curve to the left).
Changes in Aggregate Supply
EQUILIBRIUM OUTPUT AND PRICE
The point at which the AD curve intersects the AS curve is the equilibrium level of price and output for the economy.
Recessionary Gap
The gap between aggregate demand and fullemployment equilibrium, characterized by high unemployment, low inflation, and low GDP growth.
Inflationary Gap
The gap between aggregate demand and full employment equilibrium; characterized by high inflation, low unemployment, and high GDP growth.
Economic Growth and Business Cycles
Economic growth is an increase in the total output of goods and services
Can be measured using real GDP by looking at the % increase year over year
Can also be measured using real GDP per capita which is a better indication of changes in living standards since more output per capita means an average person is better off than before
BUSINESS CYCLES
A business cycle is a period of swings in national economic performance as measured by changes in real GDP. It is characterized by four distinct phases: expansion, peak, contraction, and trough.
A business cycle represents the ups and downs of the economy. The duration of a business cycle and its size (in loss or gain of real GDP) vary from one cycle to the next and are very difficult to predict.
The Business cycle occurs because of the fluctuations (expansion and contraction) that economies experience over time.
BUSINESS CYCLES
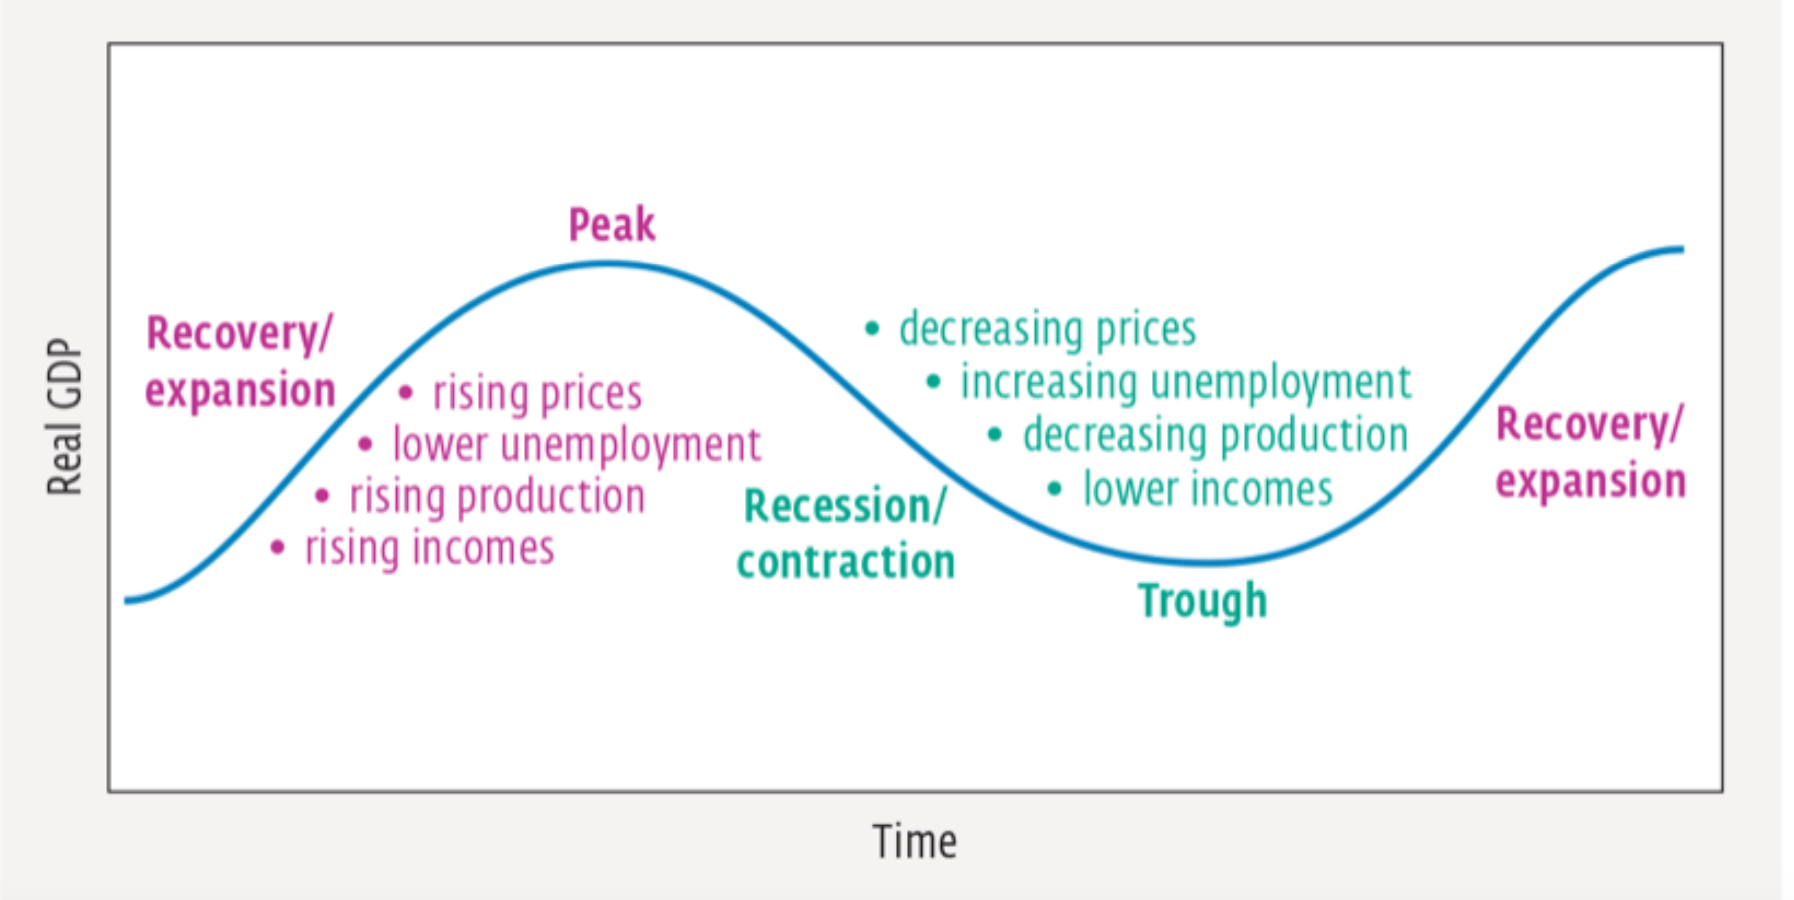
BUSINESS CYCLES - EXPANSION
An expansion period begins when consumer spending increases and production increases.
It is represented by an upward trend in the business cycle.
Generally, increased production leads to more workers being hired. New employment leads to a general rise in consumer incomes, which, in turn, generates increased levels of consumption spending.
BUSINESS CYCLES - CONTRACTION
The contraction begins as the business cycle passes its peak. Consumers may simply have exhausted the purchasing patterns that pushed up aggregate demand. Demand begins to decrease when many consumers’ wants are satisfied.
Arguments For Economic Growth
Living Standards: rising incomes and output, material benefits
Social Improvements: more consumption and investment, higher government spending (health, education, promotion of income equity)
Psychological Benefits: mood of optimism and a sense of expanding opportunities
Arguments Against Economic Growth
Opportunity Cost of Growth: to promote growth, a country must devote more of its scarce resources to investment in capital goods, rather than to current consumption
Environmental Costs: exploitation of the worlds limited supply of natural resources; higher levels of various forms of pollution and waste
Social Costs: insecurity and risks that come with technological progress; may not allow for traditional methods of lifestyles to be maintained
What is the rationale for calculating real income?
Real income adjusts for inflation to show the actual purchasing power of income. It’s important because it tells us whether people can buy more or less over time, even if their income rises.
Does GDP overstate or understate
GDP can overstate well-being by ignoring pollution, unpaid work, and inequality.
It can understate it by missing the underground economy and household work.