Chapter 13: hypothesis testing and measures of association: interval-ratio
0.0(0)
Card Sorting
1/8
There's no tags or description
Looks like no tags are added yet.
Last updated 2:56 AM on 12/8/25
Name | Mastery | Learn | Test | Matching | Spaced | Call with Kai |
|---|
No analytics yet
Send a link to your students to track their progress
9 Terms
1
New cards
regression line
summarizes all the dots as best as possible
2
New cards
conditional means
summing all y-values for each value of x, divide by n/cases for that specific X
3
New cards
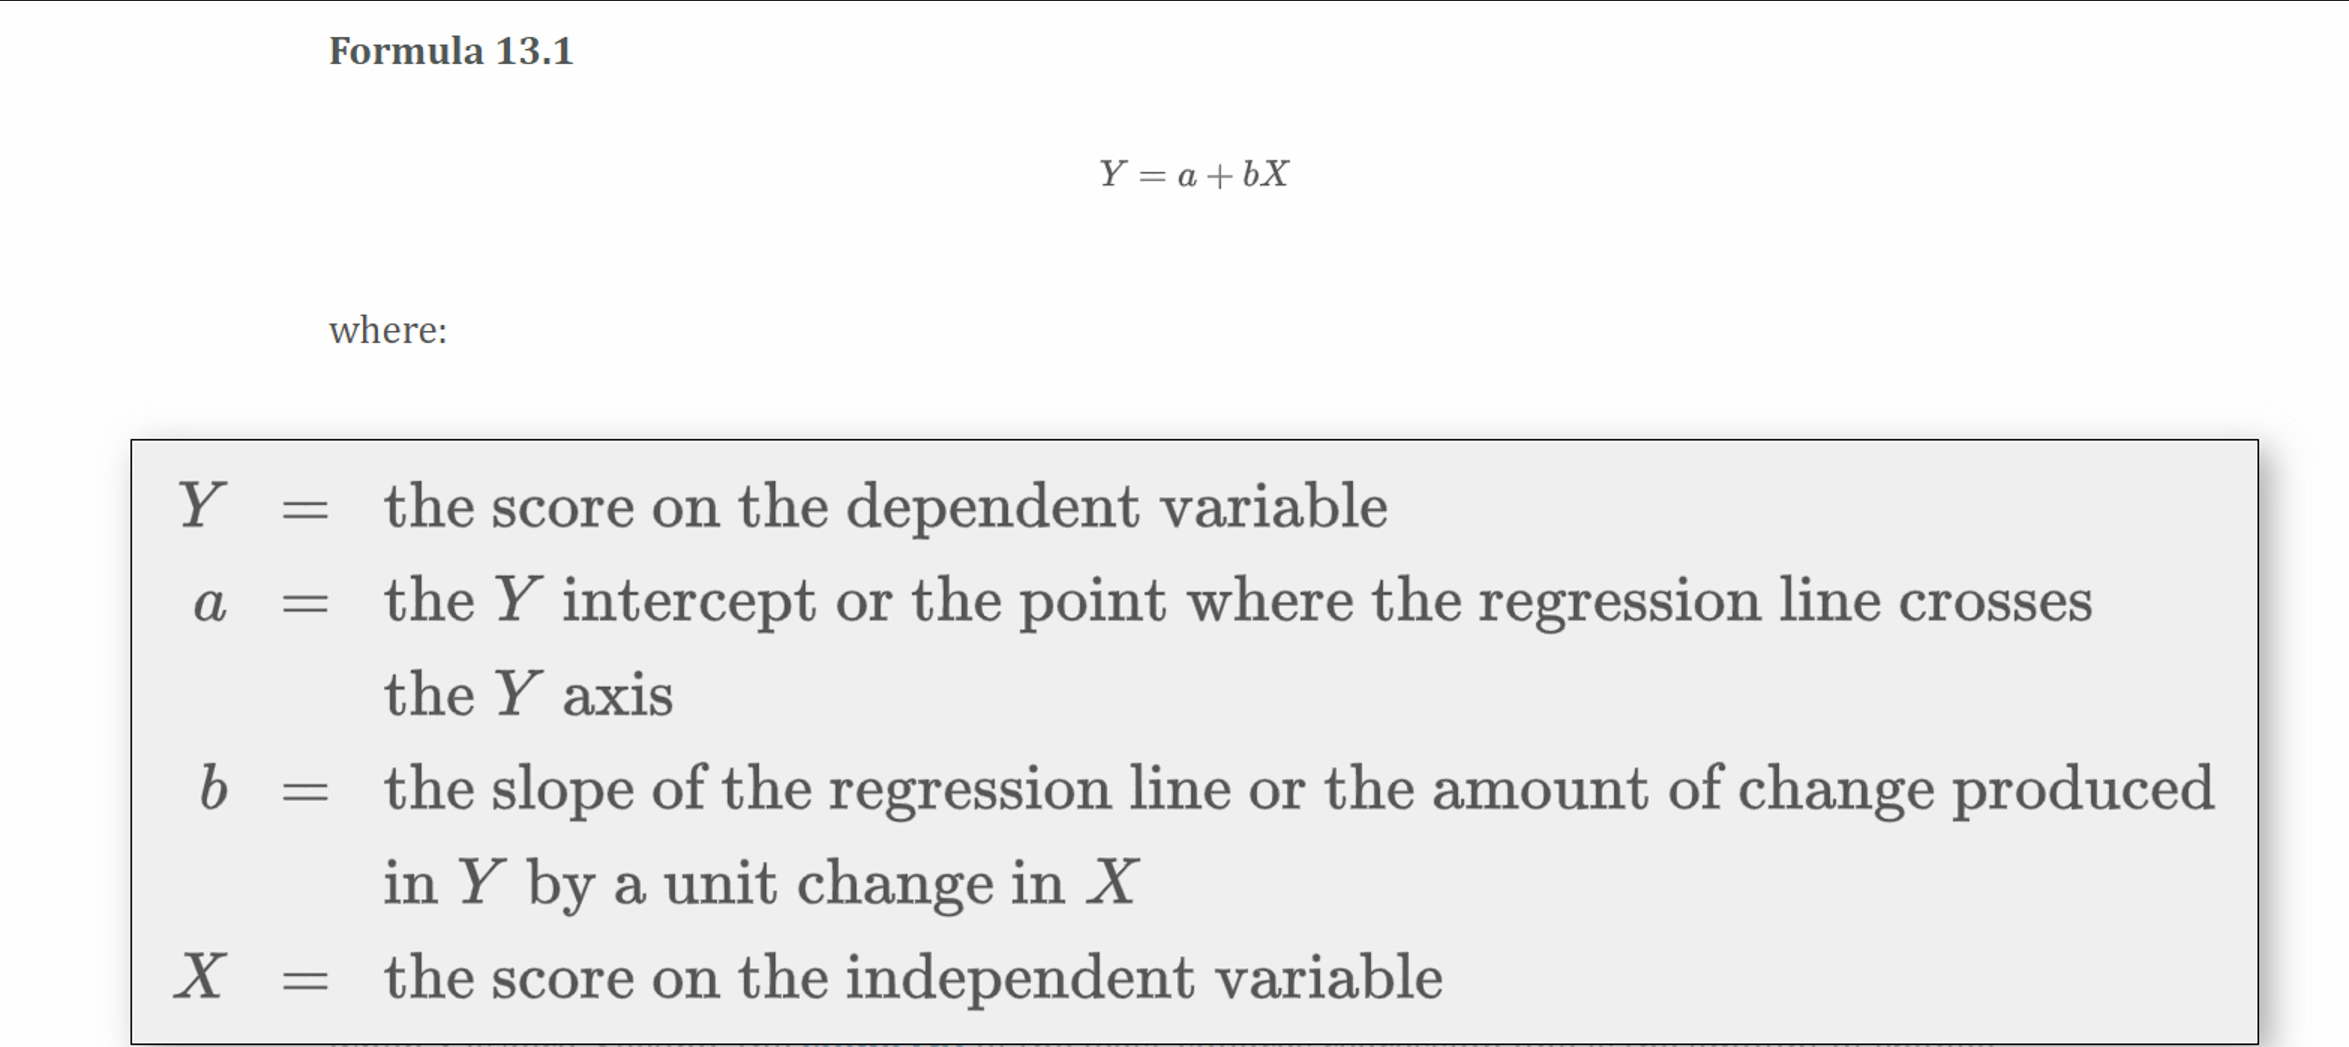
least-squares regression formula
4
New cards
slope formula
slope measures the amount of change in Y when X changes

5
New cards
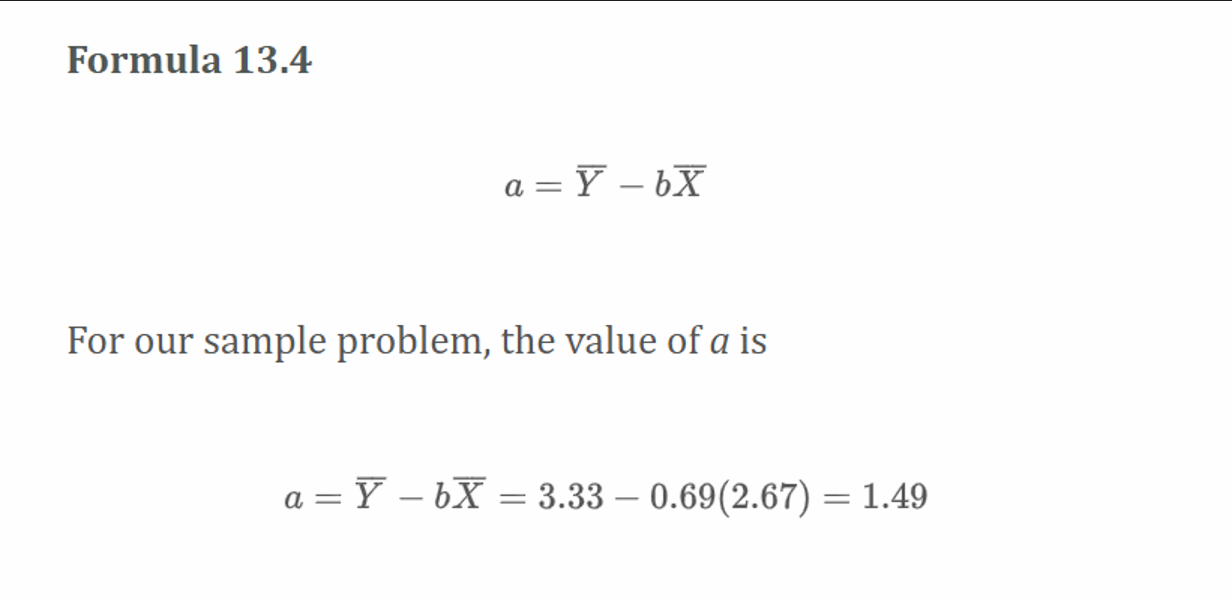
a formula
Y when X is zero
6
New cards
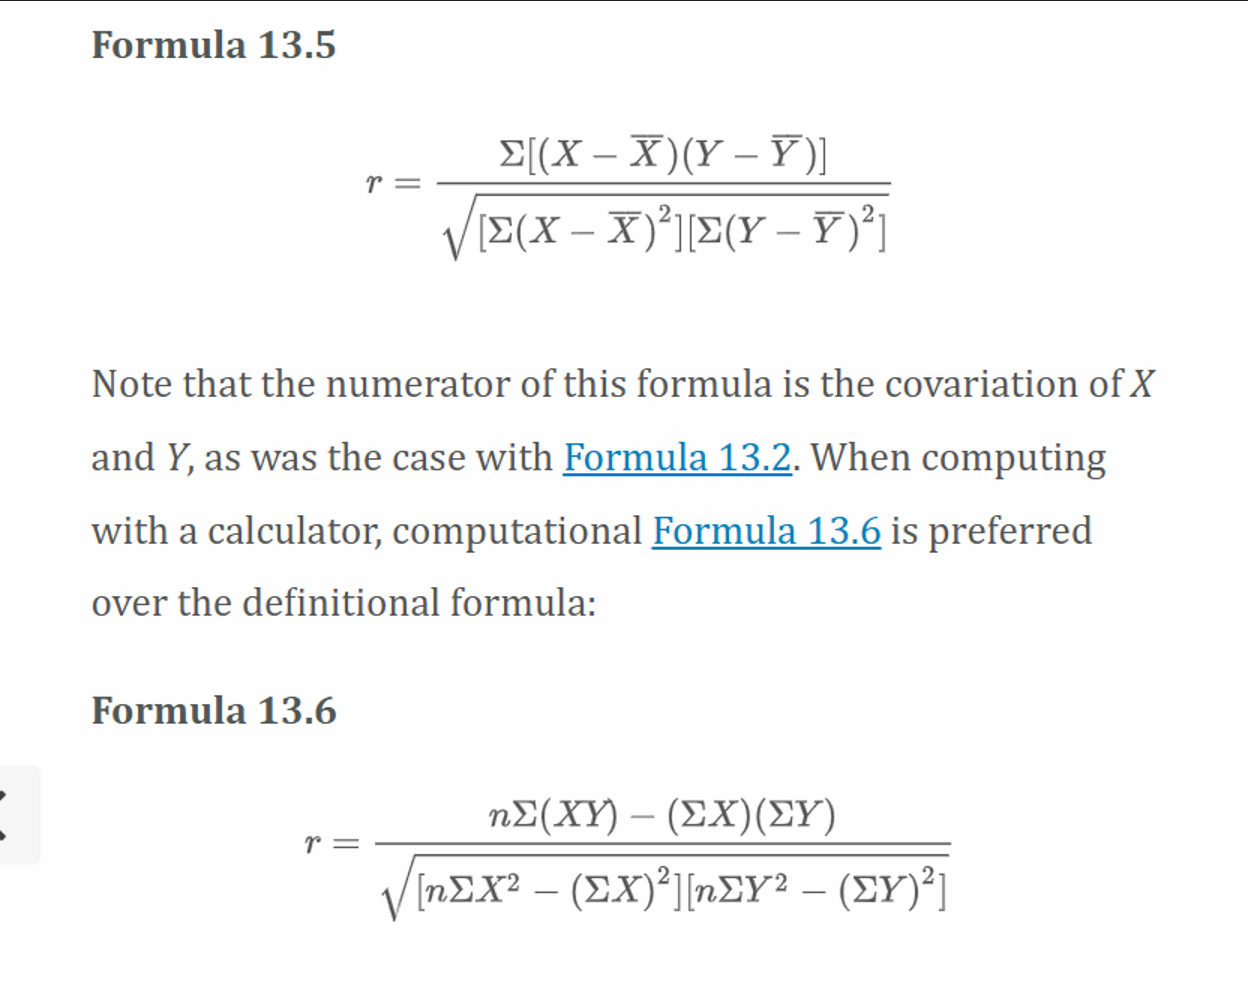
Pearson’s R: Measure of association for Interval-ratio variables
bivariate normal distributions
linear
homoscedasticity
normally distributed
range: 0.00 to -1.00 or +1.00
7
New cards
r²
indicates the extent to which X helps to explain Y’s variation
8
New cards
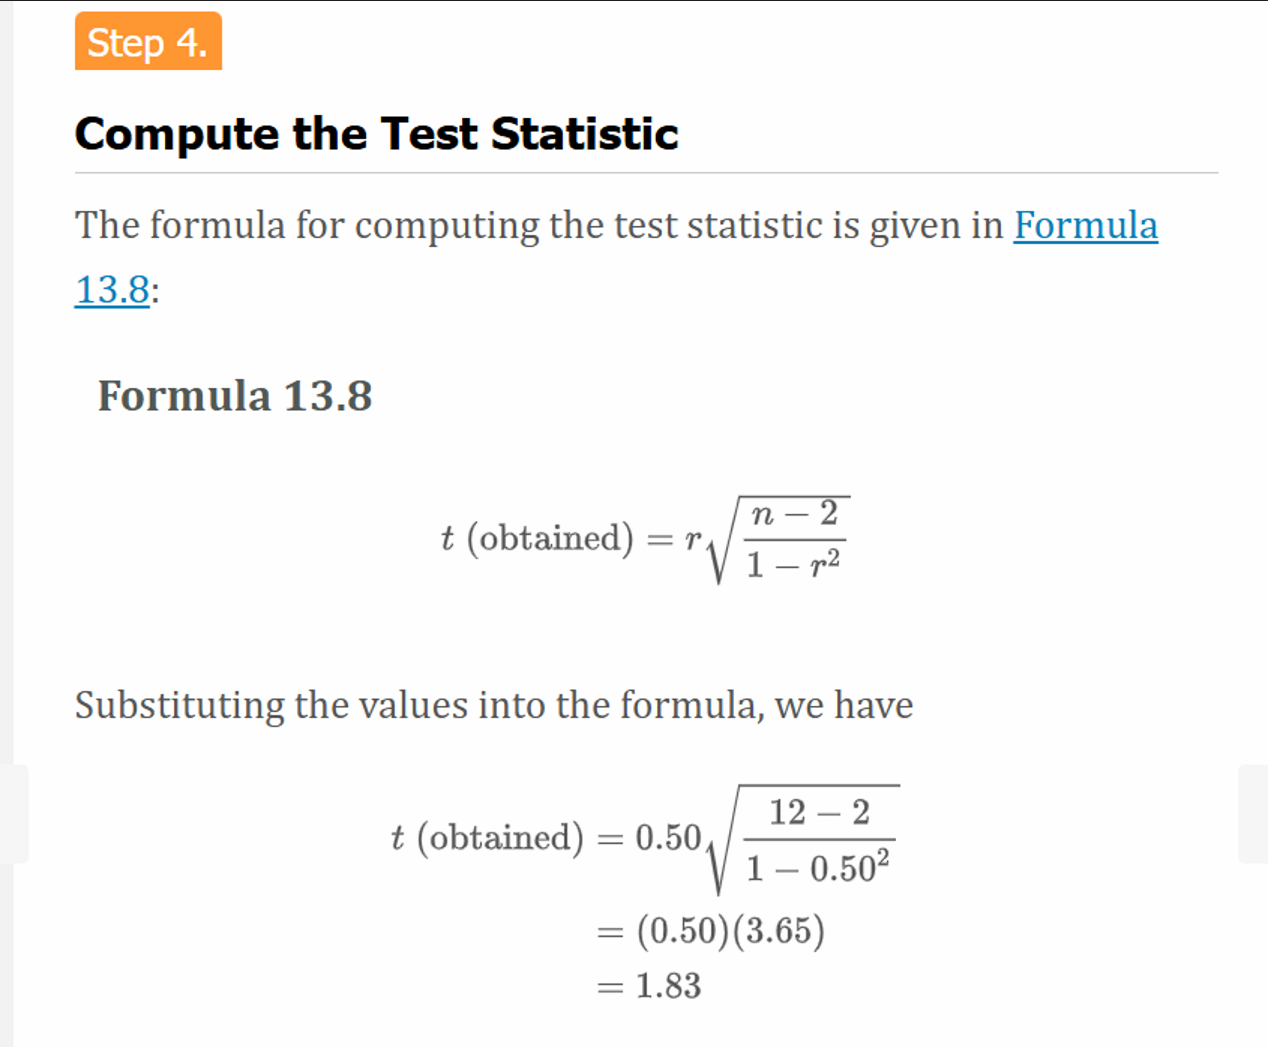
T (obtained) formula
9
New cards
degrees of freedom for T-distribution
df: n - 2