SIS SKILLS - Human Bio
1/21
There's no tags or description
Looks like no tags are added yet.
Name | Mastery | Learn | Test | Matching | Spaced |
|---|
No study sessions yet.
22 Terms
Aim
Statement that describes the purpose of the experiment.
‘To investigate/To determine’
Hypothesis
A scientific statement based on the available information that can be tested by experimentation. When appropriate, the statement expresses an expected relationship between the independent and dependent variables for observed phenomena.
A hypothesis can either be disproved or supported by experimental data. It can never be conclusively proven beyond doubt
Variables
Independent – variable deliberately manipulated by the experimenter. It is deliberately changed by the experimenter to determine its effect on the dependent variable.
Dependent – variable that is measured and changes/depends on the independent variable.
Controlled variables – variables that are kept the same/constant between the control and experimental groups. An experiment should only have one changing variable so it can properly measure the influence of the independent variable.
Experimental Group
the group(s) that are exposed to the changes in the independent variable being tested.
Control Group
A group where the independent variable being tested cannot influence the results. The control group provides the base data with which you can make a comparison – assumptions can be made that any differences are due to the independent variable.
Uncontrolled Variables
Factors you should be aware of but cannot control such as genetic variation between people. If there are uncontrolled variables in an investigation, this must be considered when interpreting the results. Large sample size, replicating and repeating an experiment makes the data more reliable as it helps to overcome the effects of uncontrolled variables
Blind/ Double Blind
When experimenting with people, it is important that the subjects do not know whether they are in the experimental group or the control group e.g. placebos (fake tablets that appear to be exactly the same as the real tablets) can be used when experimenting on the effects of different drugs. This is given to counter the psychological effect of the experiment on the subjects. Some people may show an expected effect just because they are given a substance not because of any effect of that substance.
· Blind experiment: participants do not know which group they are in, to reduce or eliminate bias.
Double-blind experiment: both tester and subject are blinded (do not know what group subjects are in)
Human Error
A mistake, eg; incorrectly reading the scale on an instrument

Random Error
An unpredictable error that can occur in an experiment. Eg influence of climate
Systematic Error
Due to a design in the experiment. These errors cannot be reduced by calculating an average
Qualitative Observations
·
These are usually subjective (description based). E.g. The indicator changed from blue to red.
Quantitative observations
These are usually measurements using precise measurement aids i.e. ruler etc. They are preferable as they are objective.
Primary data – data collected directly by a person or group
Secondary data – data collected by a person or group other than the person or group using the data
Results Table
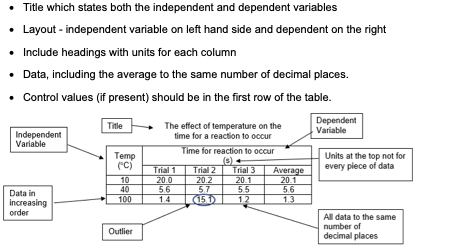
· Title which states both the independent and dependent variables
· Layout - independent variable on left hand side and dependent on the right
· Include headings with units for each column
· Data, including the average to the same number of decimal places.
· Control values (if present) should be in the first row of the table.
Calculations
· Mean – average of the data
· Median – the value in the middle of the data set
· Mode – the number in the data set that appears the most often
Range – the smallest to largest observed data value
Graph
All graphs must include
o Accurate title that includes both variables and average (if you are graphing average data)
o Correctly allocates the independent variable to the X axis and the dependent variable to the Y axis
o Scale uses even intervals and graph size is appropriate for the grid
o Axes are labelled with units
· Bar graph – when the data displayed is discrete.
o Bars are accurate with a space left between each bar
· Line graph – when displaying continuous data.
o Data points are accurate and joined with a ruler (or line of best fit)
o Include a key where more than one line is drawn

Interpolation/ Extrapolation
For line graphs only
· Interpolation refers to a prediction within the range of the data
· Extrapolation refers to a prediction outside of the range of data given
You have greater confidence with a prediction that can be made within a data range/interpolation or where there are more data points around the prediction. This will increase the accuracy of your prediction.
Describe and explain trends
Describe - Provide characteristics and features.
Explain - Relate cause and effect; make the relationships between things evident; provide why and/or how
Accuracy
The extent to which a measurement result represents the quantity it purports to measure. Eg mm>cm
The only way to make your data more accurate is to use more accurate devices to measure. Use a ruler with cm and mm not just cm on it.
Validity
· It is valid when the experiment tests the hypothesis/what is intended to be tested
· Validity is the extent to which tests measure what was intended; the extend to which data produced from tests and other processes are accurate.
· It is dependent on the experimental design
Validity is increased by:
· Only having one independent variable/one changing variable
· Controlling all other variables to make a fair test
· Experiment should contain a control group. – A group that is not exposed to the changing conditions of the experimental variable.
Accurate measuring techniques
Reliability
· The chances of getting the same/similar result if the experiment was repeated
· It is dependent on:
(a) Sample size: To draw conclusions from an experiment the sample size has to be large enough to reduce the influence of chance results or abnormal results, biological variation and allow for the averaging of results.
(b) Replicates: By duplicating an experiment a number of times over a period of time the effect of unforeseen or uncontrollable variables such as climate and experimental error can be reduced. Also enables averaging of results.
Reliability is increased by:
· Increasing the sample size/having a large sample size
· Increasing the number of replicates/repeat procedures
Collecting multiple sets of data enables an average to be calculated. This will increase the chances of representative data, decreasing chance effects and the influence of outliers / random errors / biological variation.
Conclusion
A conclusion is a statement that is supported or disproved by the data. It relates back to the hypothesis under investigation. Often a conclusion will contain a few inferences to explain the experimental results.
Evaluate a conclusion
· To ascertain the value or amount of; appraise carefully
Is it correct or not? Determine if the data is valid, accurate and reliable.
Research Ethics
Norms of conduct that determine ethical research behaviour; research ethics are governed by principles, such as honesty, objectivity, integrity, openness and respect for intellectual property and include consideration of animal ethics.
· Informed consent – subject informed on objectives on research, procedure, risks, benefits of research before voluntarily agreeing to be in the investigation
· Risk of harm – minimise any risk of harm to participants
· Confidentiality – identities only revealed to people directly involved
· Voluntary participation – people should not feel pressured to take part in research
Anonymity – Participants in the research remain anonymous, even to researcher.