Module 2: Foundations of Physics
1/15
There's no tags or description
Looks like no tags are added yet.
Name | Mastery | Learn | Test | Matching | Spaced |
|---|
No study sessions yet.
16 Terms
Fundamental SI base quantities AND units (6)
Mass (kilogram)
Length (metre)
Time (second)
Temperature (Kelvin)
Electrical current (ampere)
Amount of substance (mol)
Uncertainties
Measure of possible error in a measurement due to precision of the equipment OR experimenter (these cannot be avoided)
How can uncertainties be found? (2)
The LARGER of:
- The precision of the meter
- HALF the range of a set of repeated readings
Random error/uncertainty
Caused by human misjudgements (choosing where a reading lies), limitations of equipment due to sensitivity (e.g. ammeter constantly changing readings), parallax & reaction time
Systematic error/uncertainty
Shift measurements in 1 direction (e.g. zero errors not taken, incorrectly calibrated instruments)
In PAGs/exams, say you have checked for zero errors for every instrument
Error bars
Show the range of absolute uncertainty for each data point
Percentage uncertainty (from table measurements)
% uncertainty = (Absolute uncertainty / value) x 100
OR for repeated measurements:
(Absolute uncertainty / mean value) x 100
Percentage uncertainty (from a graph w/ error bars)
% uncertainty = (best gradient - worst gradient) / best gradient x 100
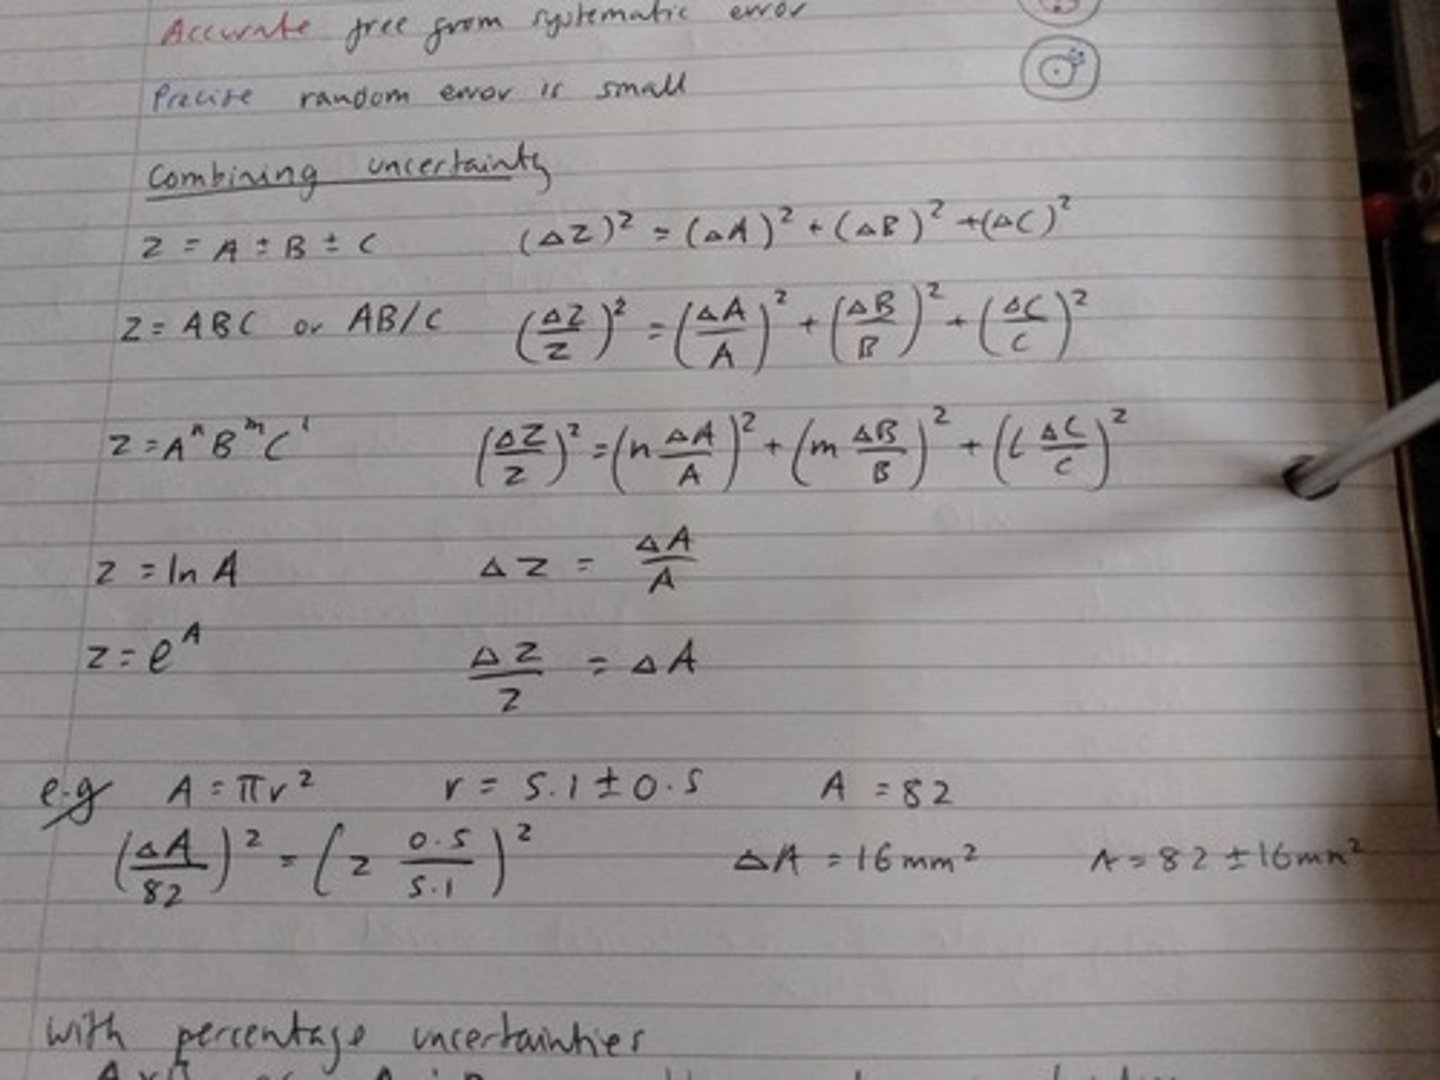
Combining Uncertainty rules (3)
- Adding/subtracting: add the ABSOLUTE uncertainties
- Multiplying/dividing values: add the PERCENTAGE uncertainties
- Raising to powers: multiply the PERCENTAGE uncertainty by the power
Scalars vs Vectors + examples of each
Scalars: magnitude ONLY e.g. speed, distance, time, density, pressure, p.d., frequency, temperature, energy, power, mass
Vectors: magnitude + specific stated direction e.g. acceleration, velocity, displacement, force, momentum, current, electric/magnetic field
How should 6-markers about experiments linking to an equation be split up? (3)
1. Describe how to perform experiment (method)
2. Measurements
3. How the data can be analysed (always the same steps)
How to analyse data from an experiment for 6-markers (6)
1. Construct a table of A vs B
2. y = mx + c analysis
3. Graph of A vs B
4. Draw LOBF
5. Take gradient
6. Compare gradient value to experimental value
Other things to consider for method/measurements in experiment 6-markers (4)
- "Using a slow-motion camera with playback facilities and a ruler/timer in shot" (favourite Physics phrase)
- Use set squares to measure something (e.g. from ground to midpoint of balls)
- Repeat experiment for same A → find average
- Repeat experiment for different A
Evaluate the accuracy of experimental value vs. actual value
If experimental value is accurate:
% uncertainty > % difference
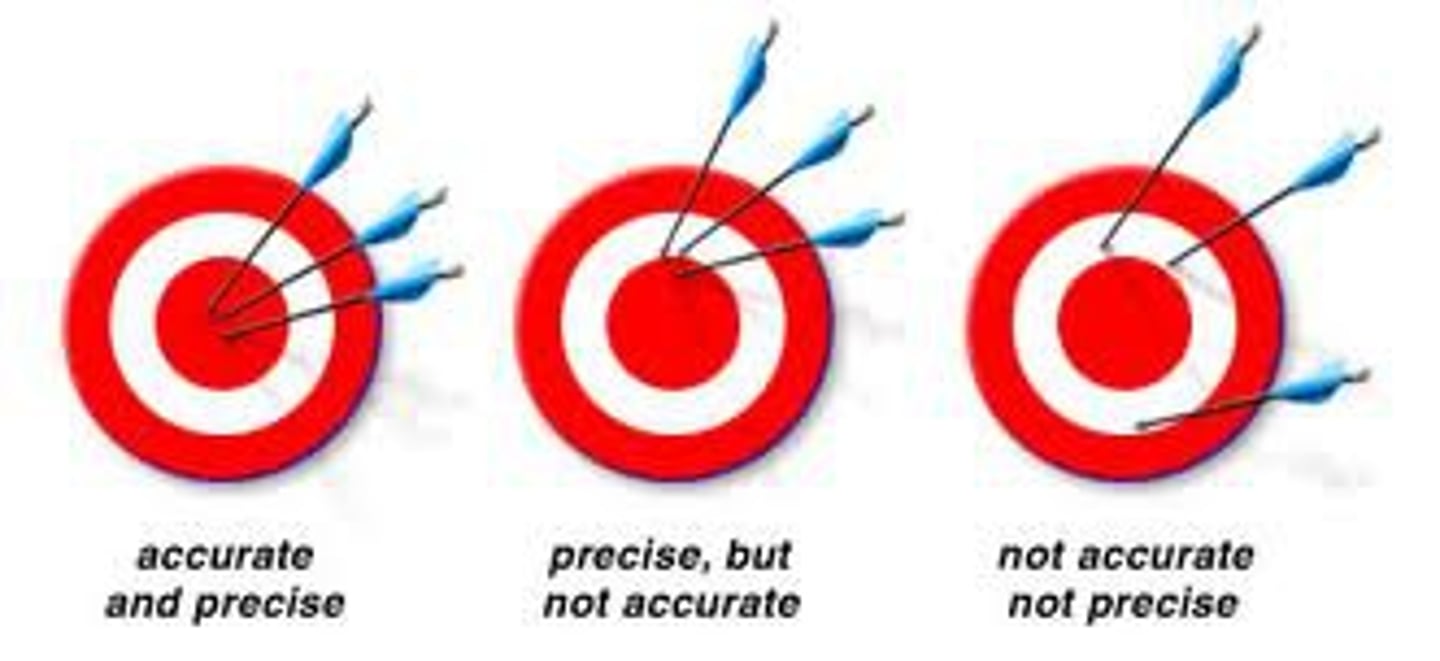
Precision vs. Accuracy
- Accuracy: measure of how close measurement is to true value
- Precision: measure of closeness of agreement between measured values
How can the scientific community validate new ideas? (2)
- Results published to allow peer review
- Procedure shared with other scientists to allow replication